
The cryptocurrency sector has spent the day equally divided between cryptos that ended up in the red and the green. The largest cryptocurrency by market cap pushed past its $16,000 mark and is currently trading for $16,291, representing an increase of 3.26% on the day. Meanwhile, Ethereum lost 0.15% on the day, while XRP gained 0.45%.
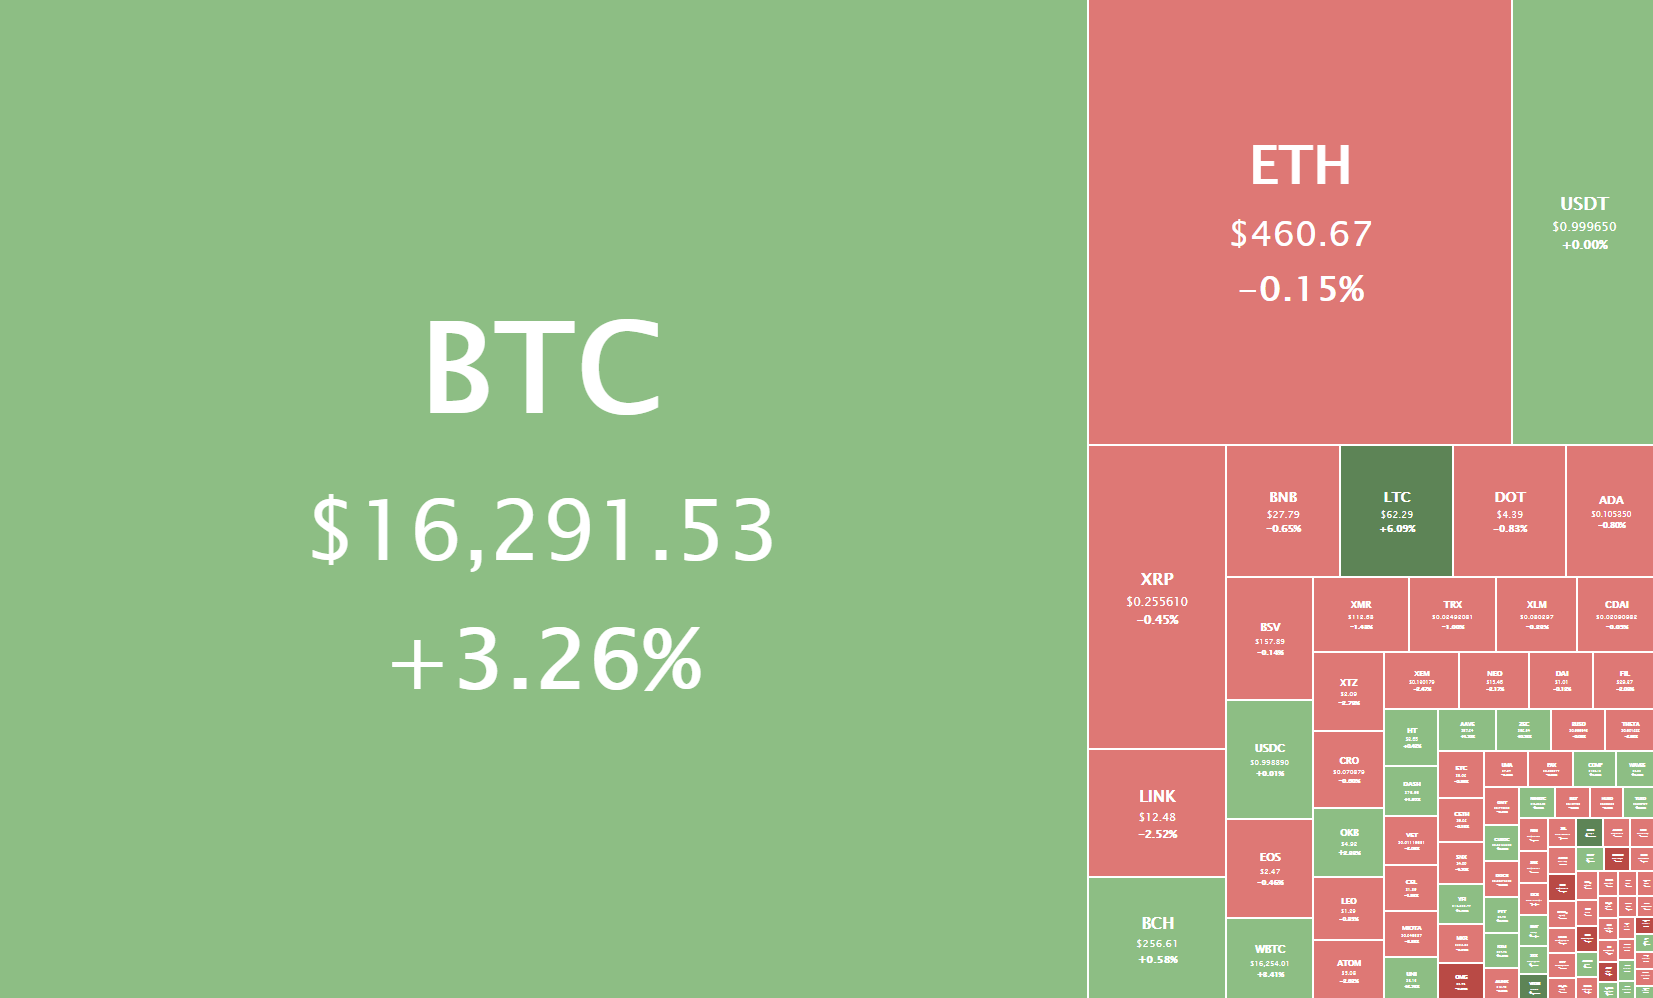
Daily Crypto Sector Heat Map
Blockstack gained 33.78% in the past 24 hours, making it the most prominent daily gainer out of the top100 cryptos ranked by market capitalization yet again today. It is closely followed by Dash’s gain of 13.33% and Decred’s 8.98% gain. On the other hand, ABBC Coin lost 12.08%, making it the most prominent daily loser. Ampleforth lost 11.75% while Aragon lost 10.85%, making them the 2nd and 3rd most prominent daily losers.
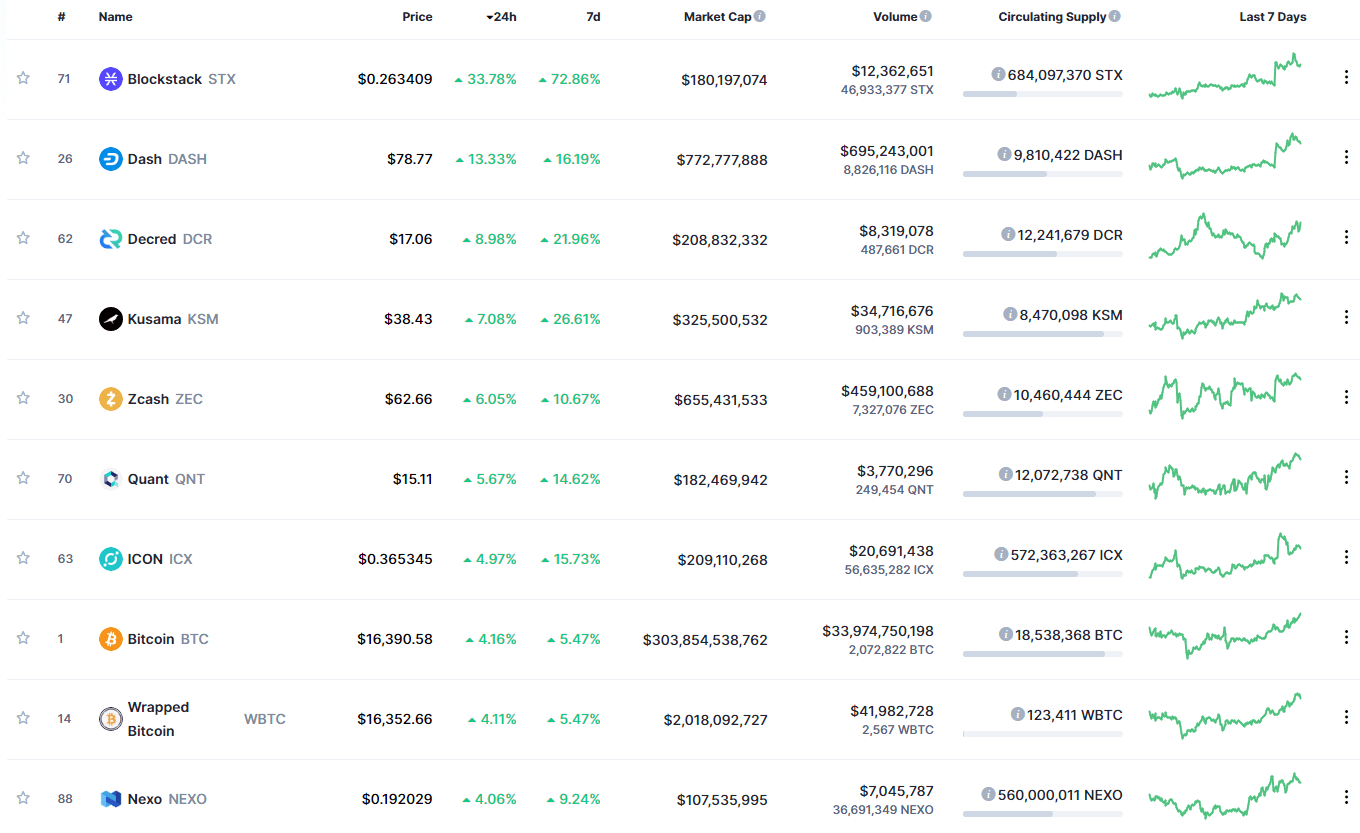
Top 10 24-hour Performers (Click to enlarge)
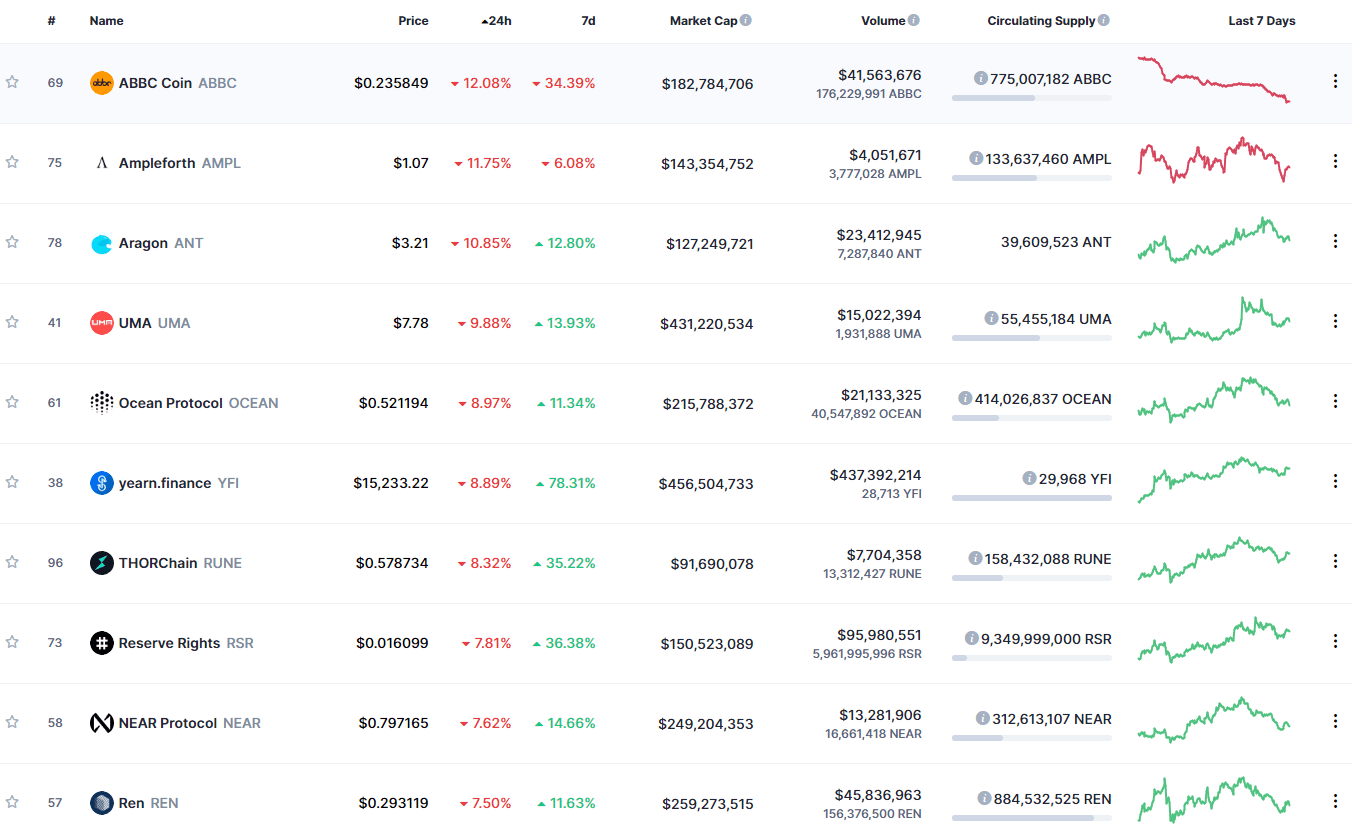
Bottom 10 24-hour Performers (Click to enlarge)
Bitcoin’s market dominance has increased since we last reported, with its value is currently staying at 65.3%. This value represents a 0.8% difference to the upside compared to the value it had yesterday.
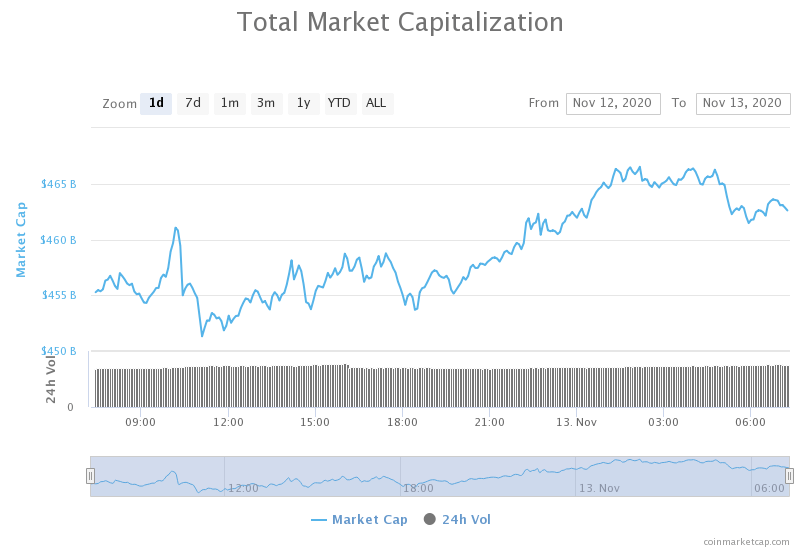
Daily Crypto Market Cap Chart
The crypto sector capitalization has gone up over the course of the day. Its current value is $462.86 billion, representing an $8.70 billion increase compared to our previous report.
_______________________________________________________________________
What happened in the past 24 hours?
_______________________________________________________________________
- US Customers Can Now Buy Bitcoin on PayPal, Wait List Lifted (Cryptobriefing)
- Bitfinex Enters P2P Lending Industry, Offers Loans up to $250,000 (Cryptobriefing)
- European Users Can Soon Earn up to 9% on BlockFi (Cryptobriefing)
- CBDCs Will Replace Private Stablecoin Tether, Central Bankers Say (Cryptobriefing)
- One of China’s biggest banks is allowing investors to buy bonds with Bitcoin (Cryptoslate)
- $1 billion worth of Ethereum is about to be released into the DeFi market (Cryptoslate)
- Bitcoin-friendly US regulator slammed for focusing “too much” on crypto (Cryptoslate)
- Crypto market maker B2C2 is pushing Japan’s biggest trading houses to buy bitcoin (The Block)
- Fed vice chair says the US central bank is still in ‘early stages’ of a possible CBDC (The Block)
- ECB not ‘racing to be first’ but Lagarde’s hunch is that Europe will issue a digital euro (The Block)
_______________________________________________________________________
Technical analysis
_______________________________________________________________________
Bitcoin
The largest cryptocurrency by market capitalization has tested the $16,000 mark for a long time, failing a couple of times as profit-taking chipped away too much bull power. However, BTC has officially broken the $16,000 resistance today, turning it into support. The move that pushed it past this mark has ended right at the $16,500 resistance, which held up quite well. Many say the reason for the move past $16,000 is that banks and firms are moving their funds into BTC due to uncertainties in the traditional markets (major indexes traded slightly in the red yesterday). An engulfing candle that followed the last green candle of the move, as well as RSI bouncing off of the overbought area, show that a correction is the most likely option at the moment.
Slow and steady increases in volume accompanied each of Bitcoin’s moves. Traders can use this info to enter and exit trades safely.
BTC/USD 4-hour Chart
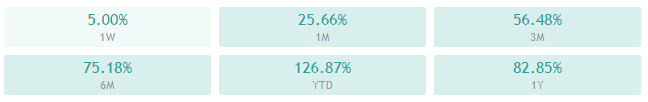
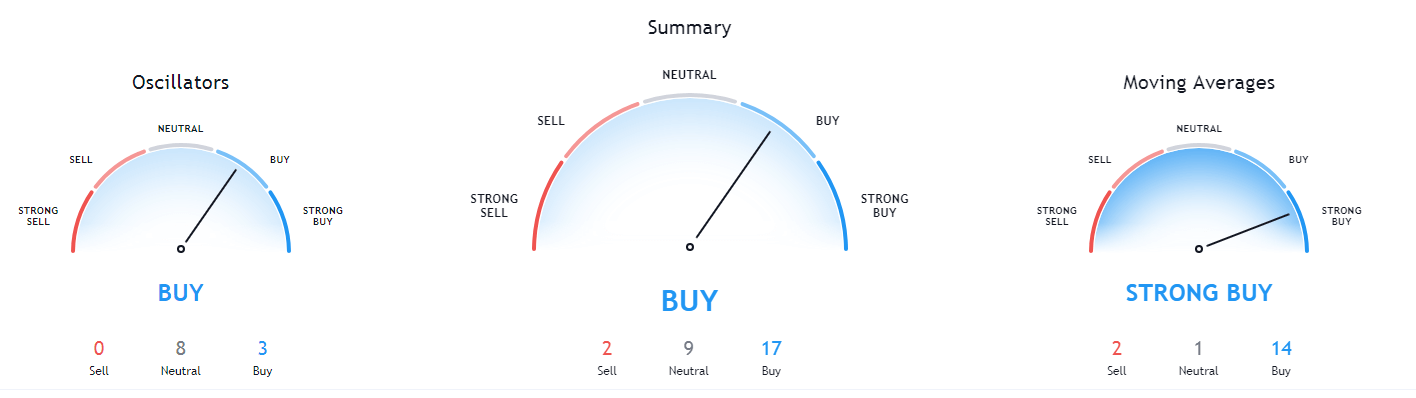
Bitcoin’s technicals are bullish overall but are split between the 4-hour and weekly time-frames, which are more tilted towards the neutral position, and daily and monthly time-frames, which are completely bullish.
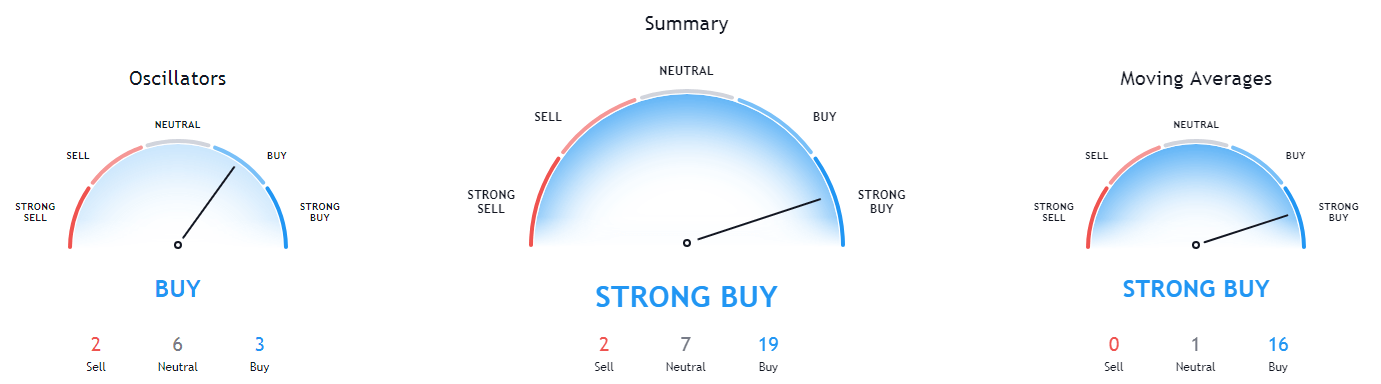
BTC/USD 1-day Technicals
Technical factors (4-hour Chart):
- Price is well above its 50-period EMA and its 21-period EMA
- Price is near its top Bollinger band
- RSI is near the overbought territory (64.03)
- Volume is slightly above average
Key levels to the upside Key levels to the downside
1: $16,500 1: $16,000
2: $16,700 2: $15,480
3: $17,000 3: $14,640
Ethereum
Ethereum has continued its upward path, supported by its ascending channel top line. The second-largest cryptocurrency by market cap managed to hold itself above this level, effectively slowly increasing in price due to the slope of the support line. However, it is yet to be seen if ETH can stay above this level for long, and a potential drop below the line is quite possible.
Ethereum traders should look for ETH dropping below the top line of the ascending channel and trade off of that.
ETH/USD 4-hour Chart
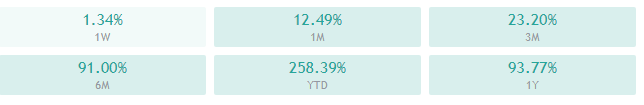
Ethereum’s technicals are bullish on all time-frames, with its 4-hour time-frame being more tilted towards the neutral position and longer time-frames being completely bullish.
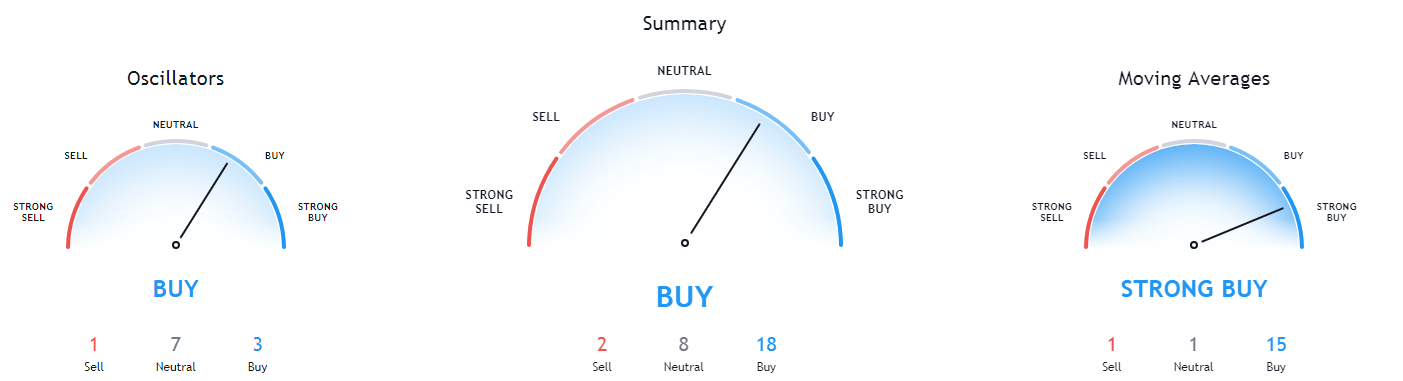
ETH/USD 1-day Technicals
Technical Factors (4-hour Chart):
- The price is above its 50-period and slightly above its 21-period EMA
- Price is slightly above its middle Bollinger band
- RSI is neutral (53.64)
- Volume is average
Key levels to the upside Key levels to the downside
1: $470 1: $451
2: $490 2: $445
3: $500 3: $420
Ripple

The fourth-largest cryptocurrency by market cap has had a slow day of sideways action within the range it is in for almost a week. XRP has moved slightly towards the middle of the range after it failed to break the $0.26 resistance level, entering a period of low volatility.
Traders shouldn’t really be interested in XRP at the moment due to its low volatility. However, those that want to trade XRP can enter trades with targets and stop-losses that correspond to the current support/resistance levels.
XRP/USD 4-hour Chart
XRP’s technicals on the 4-hour and daily time-frame have changed its stance from bullish/neutral to straight bullish, while its weekly time-frame is still almost completely neutral. Its monthly overview shows strong bearish sentiment.
XRP/USD 1-day Technicals
Technical factors (4-hour Chart):
- The price is above its 50-period EMA and at its 21-period EMA
- Price is at its middle Bollinger band
- RSI is neutral (50.34)
- Volume is slightly below average
Key levels to the upside Key levels to the downside
1: $0.26 1: $0.2454
2: $0.266 2: $0.235
3: $0.27 3: $0.227
Related posts
 Daily Crypto Review, May 15 – Bitcoin Rejected from $10,000 – What’s Next?
 Daily Crypto Review, Sept 2 – Ethereum Pushing Towards $500; Decentralized Exchanges Volume Surges
 Daily Crypto Review, Sept 4 – Bitcoin at $10,000: What Happened? Detailed Price Level Analysis
 Daily Crypto Review, Sept 8 – Peter Schiff Buying More Bitcoin; Investors Keep Buying BTC Despite Downside Potential