
While the top cryptocurrencies had quite a slow day, the DeFi market kept going up. Bitcoin is currently trading for $11,890, which represents an increase of 2.37% on the day. Meanwhile, Ethereum gained 7.57% on the day, while XRP gained 6.91%.

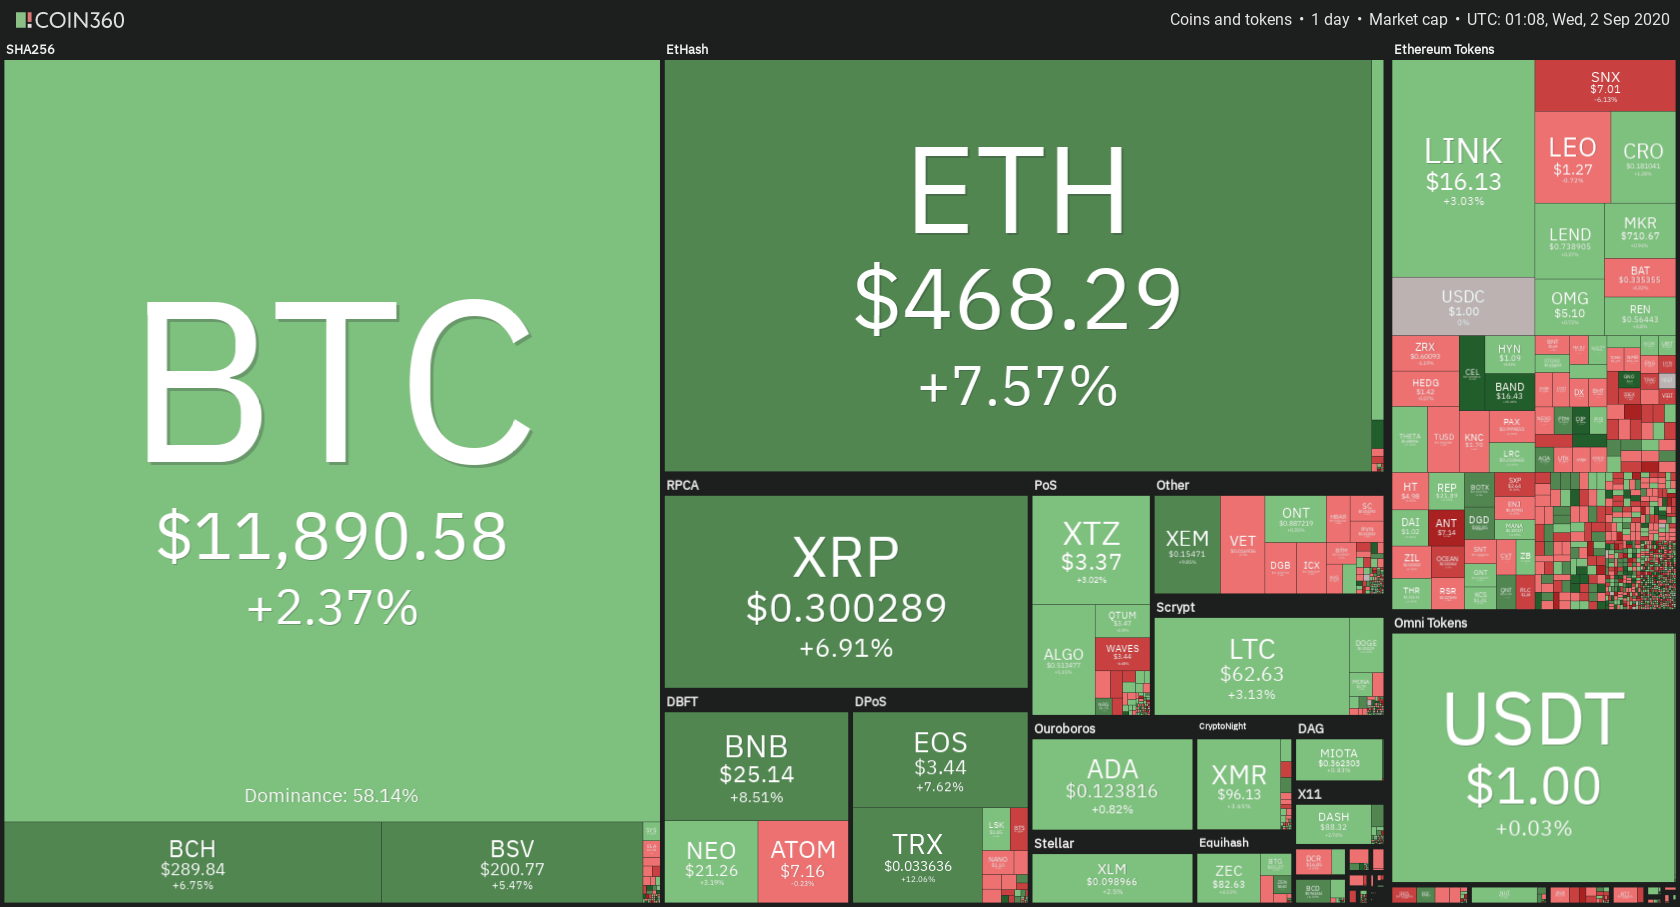
Daily Crypto Sector Heat Map
When taking a look at top100 cryptocurrencies, DFI.Money gained 111.02% on the day, making it the most prominent daily gainer. SushiSwap (35.54%) and Flexacoin (23.70%) also did great. On the other hand, the bZx Protocol lost 16.28%, making it the most prominent daily loser. It is followed by Aragon’s loss of 10.47% and Kusama’s drop of 9.44%.

Top 10 24-hour Performers (Click to enlarge)
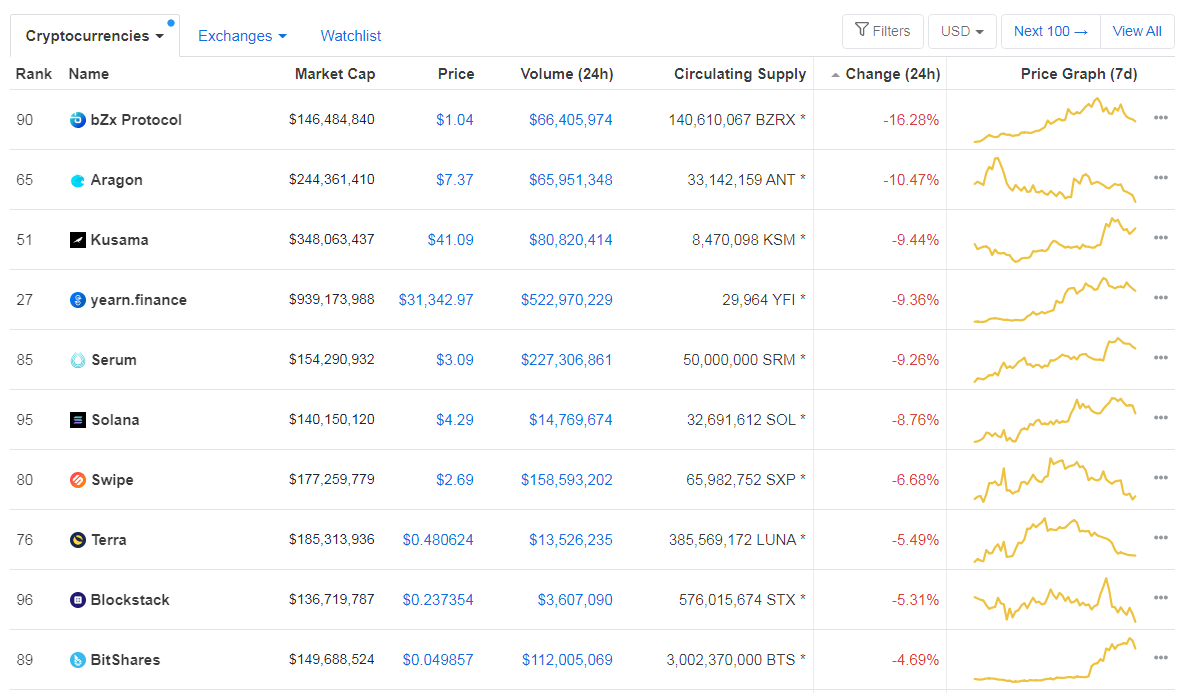
Bottom 10 24-hour Performers (Click to enlarge)
Bitcoin’s dominance level has gone down slightly, with its value is currently at 58.14%, represents a 0.26% difference to the downside when compared to when we last reported.
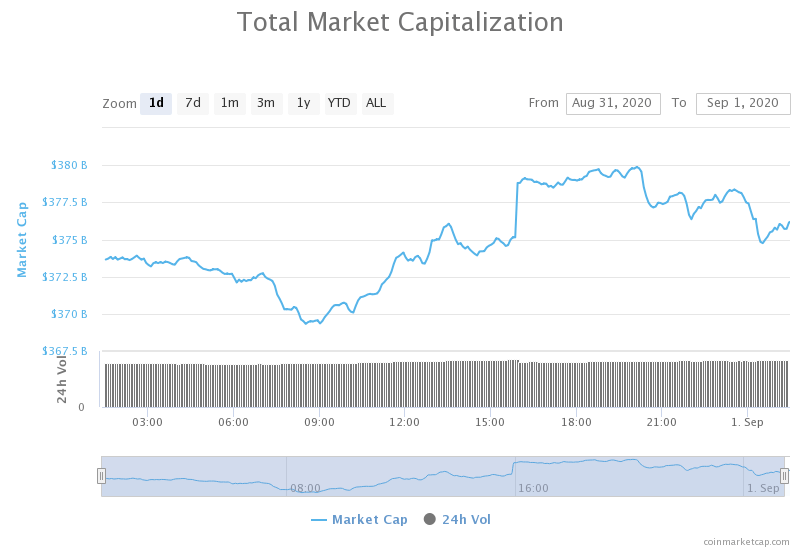
Daily Crypto Market Cap Chart
The crypto sector capitalization has increased significantly over the course of the day. Its current value is $391.05 billion, which represents an increase of $14.67 billion when compared to our previous report.
_______________________________________________________________________
What happened in the past 24 hours?
_______________________________________________________________________
- Decentralized Exchange Volume Rose 160% in August to $11.6B, Setting Third Straight Record (Coindesk)
- Ethereum’s’s Yearn.finance (YFI) continues ascent to $40k as two new products come to fruition (Cryptoslate)
- Institutions are buying Litecoin (LTC) at a 1,200% price premium (Cryptoslate)
- Ethereum founder Vitalik Buterin slams the “yield farming” frenzy (Cryptoslate)
- Tezos Reaches $25 Million Settlement in a Class-Action Lawsuit Over $232M ICO (Cryptobriefing)
- All Eyes on Ethereum as ETH Makes New Yearly Highs, Aiming for $550 (Cryptobriefing)
- BitMEX rolls out mobile trading app across 140 countries (The Block)
- Ethereum transaction fees hit another all-time high amid DEX volume boom (The Block)
- Bitfinex owner invests more than $1 million in upcoming security token exchange Dusk Network (The Block)
- Tether plans to add support for the ZK-Rollups to reduce pressure on Ethereum (The Block)
_______________________________________________________________________
Technical analysis
_______________________________________________________________________
Bitcoin
After managing to fend off the bears and establish its presence above $11,630 yesterday, Bitcoin started moving towards the upside. The largest cryptocurrency by market cap pushed towards the upside and quickly reached the $12,000 mark. However, the cryptocurrency did not stay above it for long and fell under it yet again. Bitcoin is now on a path towards the downside.
Traders should pay attention to how Bitcoin’s price reacts to its moving averages, as well as to $11,630.
BTC/USD 4-hour Chart
Technical factors:
- Price is above its 50-period and 21-period EMA
- Price is at its middle band
- RSI is neutral (52.80)
- Volume is slightly increased
Key levels to the upside Key levels to the downside
1: $11,630 1: $11,460
2: $12,015 2: $11,090
3: $12,330 3: $10,855
Ethereum
Ethereum had another extremely bullish day, where its parabolic rise continued. The second-largest cryptocurrency by market cap surged towards the upside and passed $445 with ease, only to be stopped a little under $490. Ethereum is now consolidating slightly below this level.
Ethereum’s parabolic price rise is attributed to a surge of interest in DeFi projects, and all they have to offer.
Ethereum traders should pay attention to DeFi announcements, as well as to how ETH will consolidate.
ETH/USD 4-hour Chart
Technical Factors:
- The price is above its 21-period and 50-period EMA
- The price is just below the upper band
- RSI is in the overbought territory (73.71)
- Volume is descending (from extremely high)
Key levels to the upside Key levels to the downside
1: $445 1: $415
2: $496 2: $400
3: $360
Ripple
XRP, boosted by the other cryptos increasing in price, pushed towards the upside itself. The third-largest cryptocurrency by market cap managed to get past the $0.285 resistance level, and then quickly (and successfully) retested it. The move towards the upside got stopped at $0.305, and XRP is now consolidating slightly under it.
While XRP’s move seems like it ran out of steam, its volume is still relatively high, which may indicate a possibility of further volatility.
Traders should look at XRP’s volume spikes and check for any signs of its next move’s direction.
XRP/USD 4-hour Chart
Technical factors:
- The price is above its 21-period and 50-period EMA
- Price is just under its upper band
- RSI is stable and extremely close to being overbought (63.57)
- Volume is slightly above average
Key levels to the upside Key levels to the downside
1: $0.31 1: $0.285
2: $0.32 2: $0.266
3: $0.3328 3:$0.2454
Related posts
 Daily Crypto Review, Sept 11 – DeFi Sector Experiences Volatility; The Rest Of The Market Stable
 Daily Crypto Review, Sept 23 – Gold Pushing BTC Towards $9,500; XRP Bears Taking Over
 Daily Crypto Review, Sept 28 – XRP Exiting Bearish Structure and Aiming for $0.245; Bitcoin Eyeing $11,000
 Daily Crypto Review, Sept 30 – Goldman Sachs Entering the Crypto Sector; Bitcoin Prepares for a Move
One reply on “Daily Crypto Review, Sept 2 – Ethereum Pushing Towards $500; Decentralized Exchanges Volume Surges”
decentralised exchanges becoming more popular