
The cryptocurrency sector has mostly tried to consolidate after this weekend’s losses. Bitcoin is currently trading for $10,496, representing an increase of 0.68% on the day. Meanwhile, Ethereum gained 0.26% on the day, while XRP lost 1.28%.


Daily Crypto Sector Heat Map
If we look at the top100 cryptocurrencies, OMG Network gained 21.05% on the day, making it the most prominent daily gainer. Synthetix Network (20.54%) and Hyperion (16.87%) also did great. On the other hand, Avalanche lost 54.43%, making it the most prominent daily loser. It is followed by Orchid’s loss of 13.56% and Celo’s loss of 10.10%.
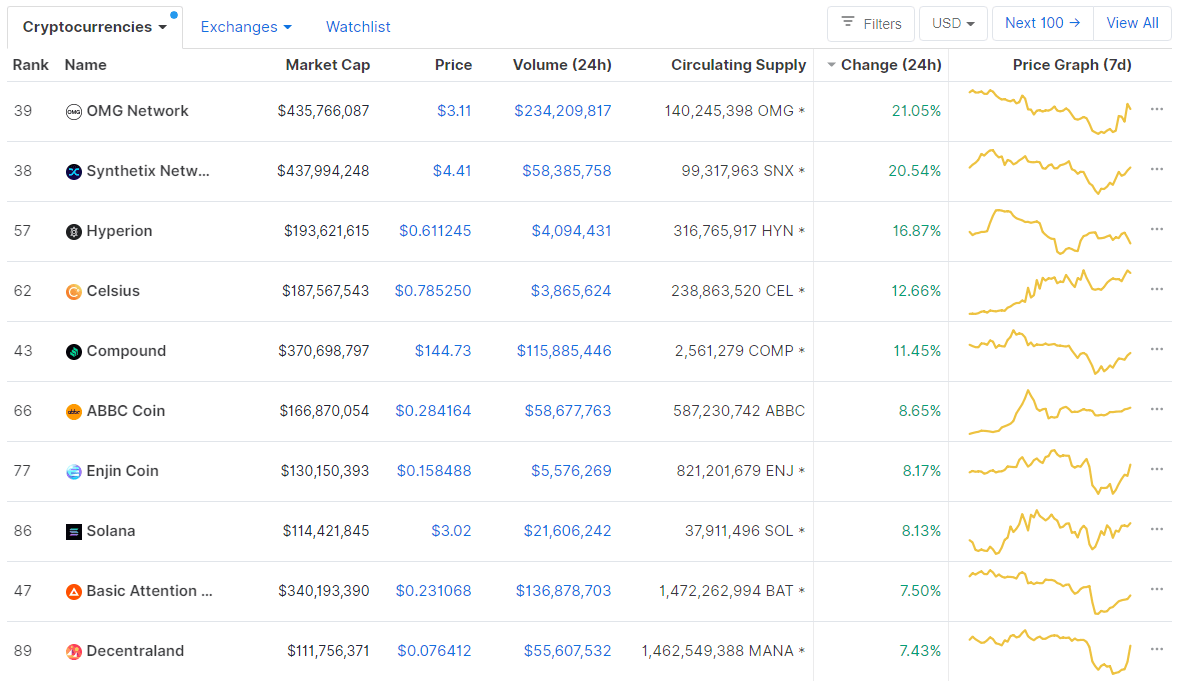
Top 10 24-hour Performers (Click to enlarge)
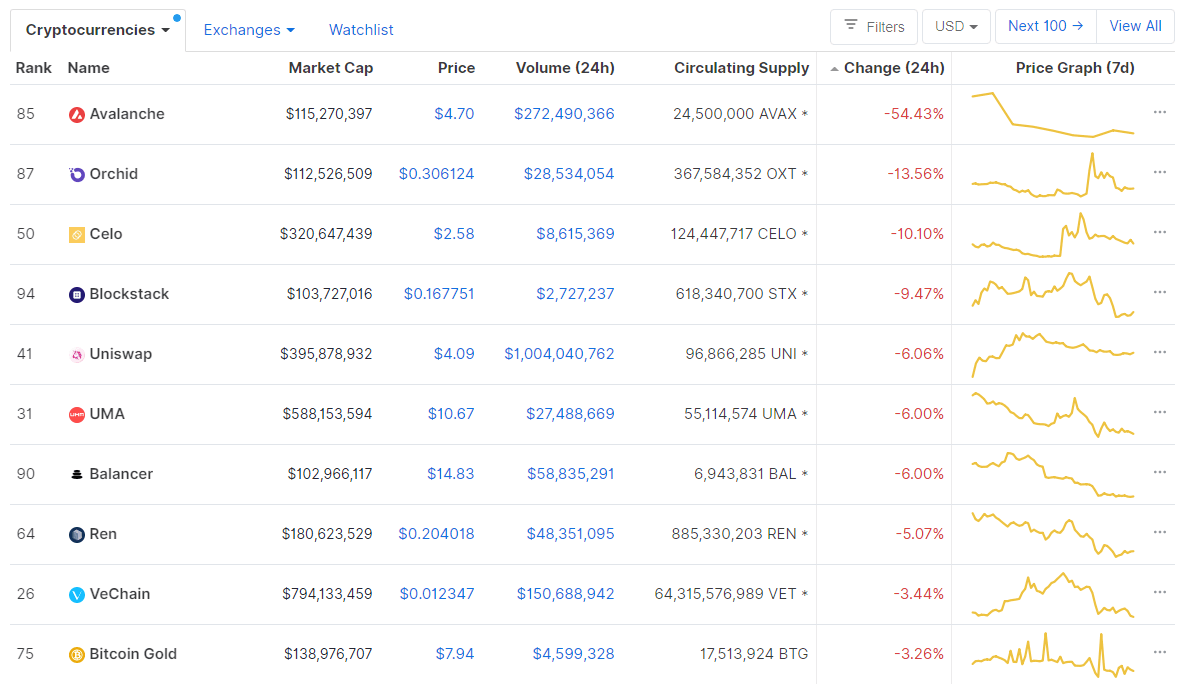
Bottom 10 24-hour Performers (Click to enlarge)
Bitcoin’s dominance level experienced a slight decrease since our last report, with its value currently being at 61.10%. This value represents a 0.19% difference to the downside when compared to when we last reported.
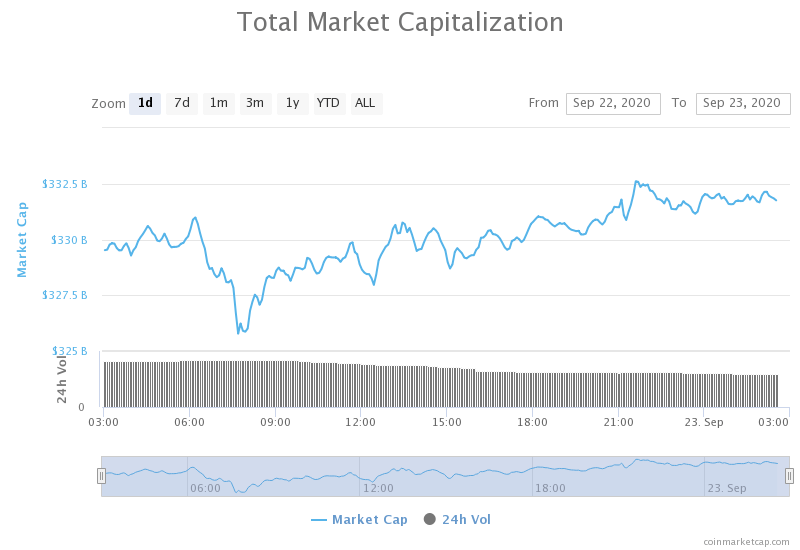
Daily Crypto Market Cap Chart
The crypto sector capitalization has slightly increased in value over the past 24 hours. Its current value is $333.91 billion, which represents an increase of $3.7 billion when compared to our previous report.
_______________________________________________________________________
What happened in the past 24 hours?
_______________________________________________________________________
- MicroStrategy CEO could ‘liquidate $200M in Bitcoin on a Saturday’ (Cointelegraph)
- Yearn .finance’s founder and others aren’t bullish on Uniswap’s current governance model (Cryptoslate)
- Top VC says amid 40% drop: the fundamentals for Ethereum have never been better (Cryptoslate)
- Cardano Finally Flashes Buy Signal After 50% Nosedive (Cryptobriefing)
- American Regulators Warm up to Crypto, Banks Authorized to Hold Stablecoins (Cryptobriefing)
- Exorbitant Gas Fees on Ethereum Force UniLogin to Shutter Operations (Cryptobriefing)
- Craig Wright of Bitcoin SV Won’t Escape Latest Crypto Lawsuit (Cryptobriefing)
- Jeremy Allaire talks USDC, multi-chain support and new stablecoin guidance (The Block)
- ECB report says the term ‘stablecoin’ needs reform because of its ambiguity (The Block)
- Crypto exchange Bithumb reportedly looking for a buyer (The Block)
_______________________________________________________________________
Technical analysis
_______________________________________________________________________
Bitcoin
Bitcoin has spent the day trying to “end the battle” for the 23.6% Fib retracement level. With it ultimately ending up above it, Bitcoin has managed to stay out of the bearish cycle it was about to jump in. With that being said, the 1-day chart is still calling for a pullback towards the $9,300-$9,500. The large red triangle on our chart shows Bitcoin’s possible correlation with gold (as the gold chart looks exactly the same, with the exception that its triangle already popped to the downside), which may cause another push towards the downside.
BTC/USD 1-day Chart
If we take a look at the 4-hour time frame, the largest cryptocurrency by market cap managed to stay above the triangle bottom line and gain a foothold at the 23.6% Fib retracement line. However, Bitcoin’s sentiment is still slightly bearish in the short-term, which may ultimately result in another nosedive.
BTC/USD 4-hour Chart
Bitcoin’s short-term technicals are still very bearish. However, the more we look at longer time frames, the better the situation is. While the technicals are very bearish on the 4-hour chart, the daily and weekly overview are not so bad (though still tilted towards the downside), while the monthly overview is still very bullish.
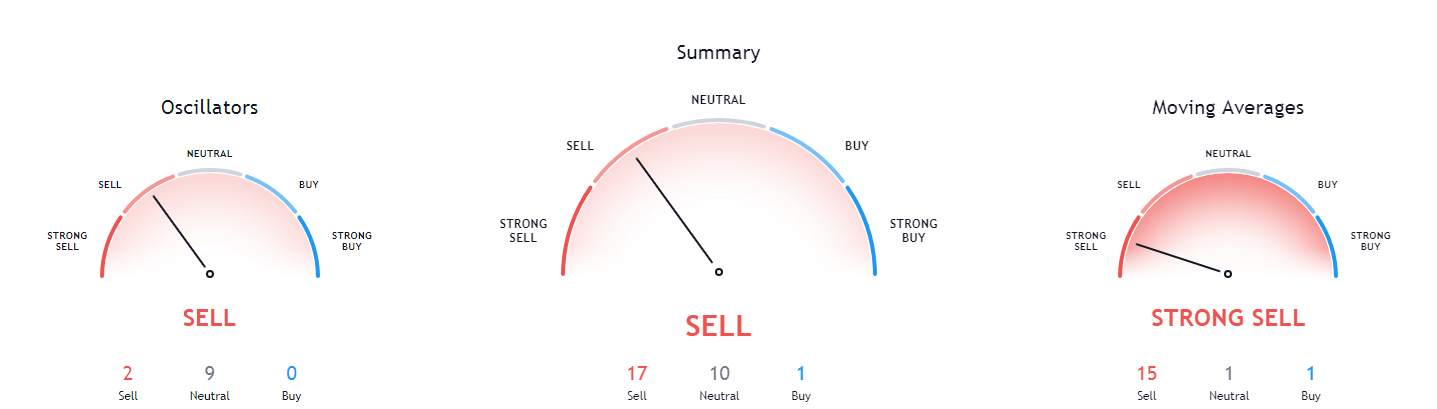
BTC/USD 4-hour Technicals
Technical factors (4-hour Chart):
- Price is slightly below its 50-period EMA and its 21-period EMA
- Price slightly below its middle Bollinger band
- RSI is neutral and recovering from the downswing (39.62)
- Volume is slowly descending from a massive spike
Key levels to the upside Key levels to the downside
1: $10,630 1: $10,500
2: $10,850 2: $10,015
3: $11,000 3: $9,880
Ethereum
DeFi market is experiencing a bloodbath, with yearn.finance dropping 50% from its highs established in the past weeks and the rest of the market following. With that being said, many institutional investors have said they are macro-driven and not crypto-driven and that ETH’s fundamentals have never been better.
However, if we take a look at Ethereum’s chart, we can see that the situation is not exactly bullish. The second-largest cryptocurrency by market cap has barely established support at the $340 level. With the volume coming back to normal, it seems that ETH will stay at this level and try to consolidate in the short-term.
ETH/USD 4-hour Chart
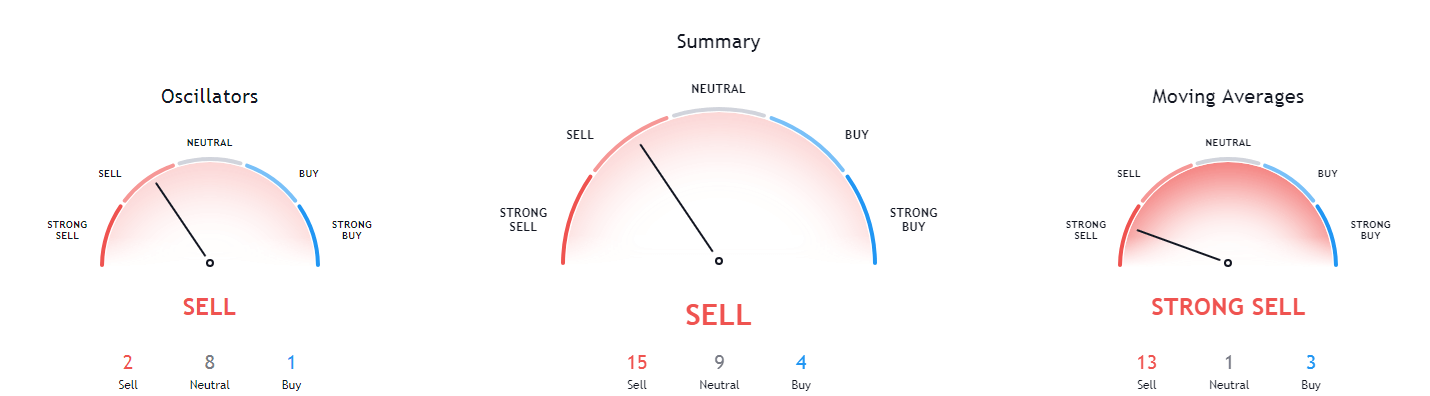
Ethereum’s short-term technicals are extremely bearish, while its mid-term technicals are getting quite bullish. This confirms the story that the “smart money” is telling, which is that institutional money is coming into the market regardless of the short-term bearishness.
ETH/USD 4-hour Technicals
Technical Factors (4-hour Chart):
- The price is below both its 21-period and its 50-period EMA
- The between its middle and bottom Bollinger band
- RSI is neutral but tilted towards the downside (34.67)
- Volume has returned to average
Key levels to the upside Key levels to the downside
1: $360 1: $340
2: $371 2: $300
3: $400 3: $289
Ripple
XRP has spent the day trying to consolidate after a push towards the downside. The fourth-largest cryptocurrency by market cap has (for now) stopped its squeeze down after hitting the bottom of the bottom Bollinger band, which stopped it from descending further. While the sentiment is still bearish, the move towards the downside that will finish the Elliot impulse wave’s fifth leg may be delayed slightly.
XRP/USD 1-day Chart
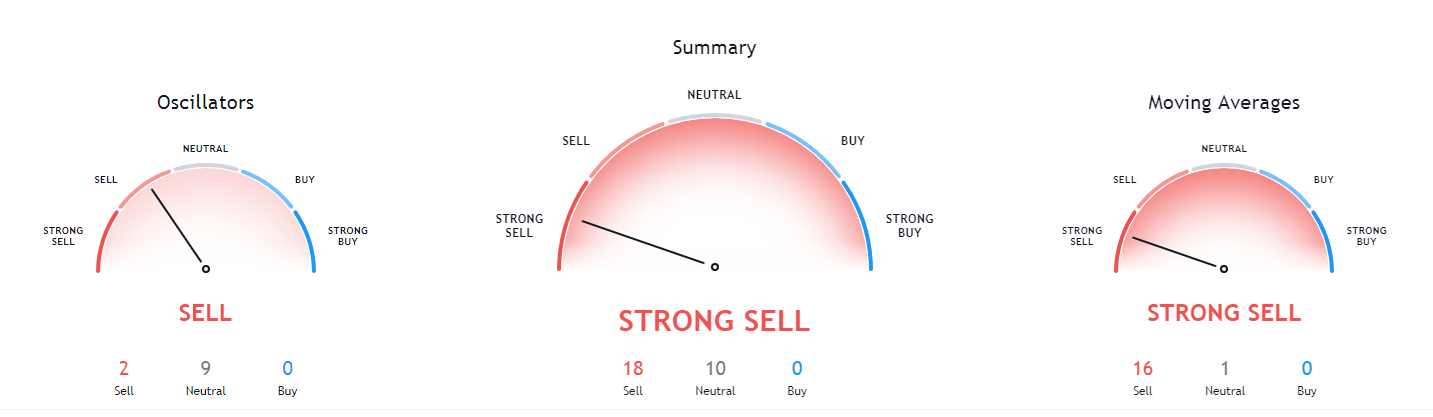
Taking a look at the technicals, XRP is showing extreme bearish sentiment on both short-term and long-term charts. Its 4-hour, daily, weekly and monthly indicators are heavily tilted towards the downside, which is certainly not a good sign for the XRP bulls.
XRP/USD 4-hour Technicals
Technical factors (4-hour Chart):
- The price is below both its 21-period EMA and its 50-period EMA
- Price is slightly above its bottom Bollinger band
- RSI is neutral and flat (38.38)
- Volume is coming back to average
Key levels to the upside Key levels to the downside
1: $0.235 1: $0.227
2: $0.2454 2: $0.221
3: $0.266 3: $0.214
Related posts
 Daily Crypto Review, May 19 – Bitcoin Not Producing Enough Blocks?
 Daily Crypto Review, May 25 – Bitcoin Under $9,000; Goldman Sachs Hosting a Conference Call on Crypto
 Daily Crypto Review, May 29 – Bitcoin above $9,500; Goldman’s Criticism vs. Grayscale’s Optimism
 Daily Crypto Review, Sept 10 – Ethereum Double-Digit Gains; Crypto – S&P500 Correlation nears All-Time-Highs
One reply on “Daily Crypto Review, Sept 23 – Gold Pushing BTC Towards $9,500; XRP Bears Taking Over”
Big consolidation at the minute big move coming