Categories
Crypto Cryptocurrencies

Top 20 Fun & Interesting Facts About Bitcoin: Part 1

If you just started learning about Bitcoin or are trying to understand why it is different from everything else, this is the place to be.

1. Bigger Picture of Bitcoin vs. Blockchain 

Satoshi, the Japanese inventor of Bitcoin, is praised for overcoming the massive challenge of moving value online. Bitcoin certainly paved the way for the creation of new coins; but, more importantly, it opened our eyes to the new world of possibilities.

As a breakthrough invention, we can compare it to the first phone or aircraft. Still, as many Bitcoin connoisseurs like to point out, it is of vital importance that we don’t mix up the precursors and their more modern replacements. Who would like to use the brick phone nowadays anyway?

Therefore, when Bitcoin first appeared, it naturally shifted things quite a bit. We were presented with this new technology and decentralized digital currencies, which is one of its greatest benefits to this day. 

What we now know as a decentralized distributed ledger allowed transactions to be made without any intermediary. This meant that banks finally no longer had to give their blessing for things to work, making Blockchain technology as important as the first car. 

Now, the planes we use today differ greatly from the craft first designed by the Wayne brothers. We still appreciate the power of invention, but like with the software industry, we are inclined to use the newer versions which accommodate our current needs. 

Some experts tend to stress these differences because they understand that new inventions may not always work out in the long term in their initial form. Sometimes we need to debug and fix issues before we can be fully satisfied with anything. 

Bitcoin, which is essentially the first technology of its kind, definitely drew the attention of both people and institutions. Nonetheless, certain experts in the field still call for understanding what Blockchain entails and brings to the table in the long term aside from Bitcoin.

Ray Dalio, one of the most successful hedge fund managers in history, stated that he doesn’t really believe in Bitcoin, but he did say that he believes in the technology behind it. Although he received major backlash for his statements on Bitcoin, we cannot but notice similarities between the comments made by different individuals.

As Bitcoin remains the only market-proven use for Blockchain, those in favor of Bitcoin fervently disapprove of any separation between the cryptocurrency and the technology it is backed by. Some even say that favoring one over the other is the same as preferring the internet to HTTP. Still, it is crucial that we differentiate between Bitcoin cryptocurrency and Blockchain technology. 

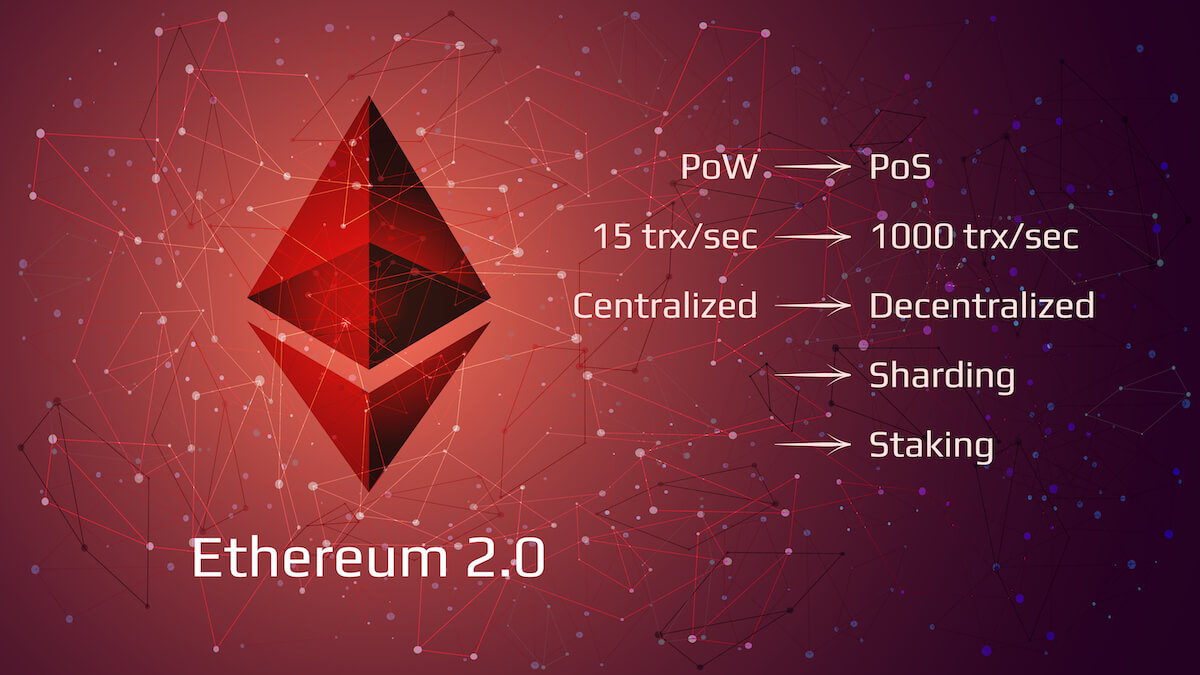
Blockchain, the first version of a decentralized distributed ledger, is a historically significant invention that introduced unprecedented changes in the world. As a first of its kind, Blockchain is sometimes criticized for the algorithm upon which it is built – proof of work (PoW). Twelve years after its creation, Blockchain’s performance is believed to be a far cry from what we should be having. 

All critics aim to point out a need for a more sophisticated version of a decentralized distributed ledger that compensates for Blockchain’s limitations. While we still need the basic function of Blockchain, we also need much faster and efficient performance, thus calling for a replacement of the current PoW design.

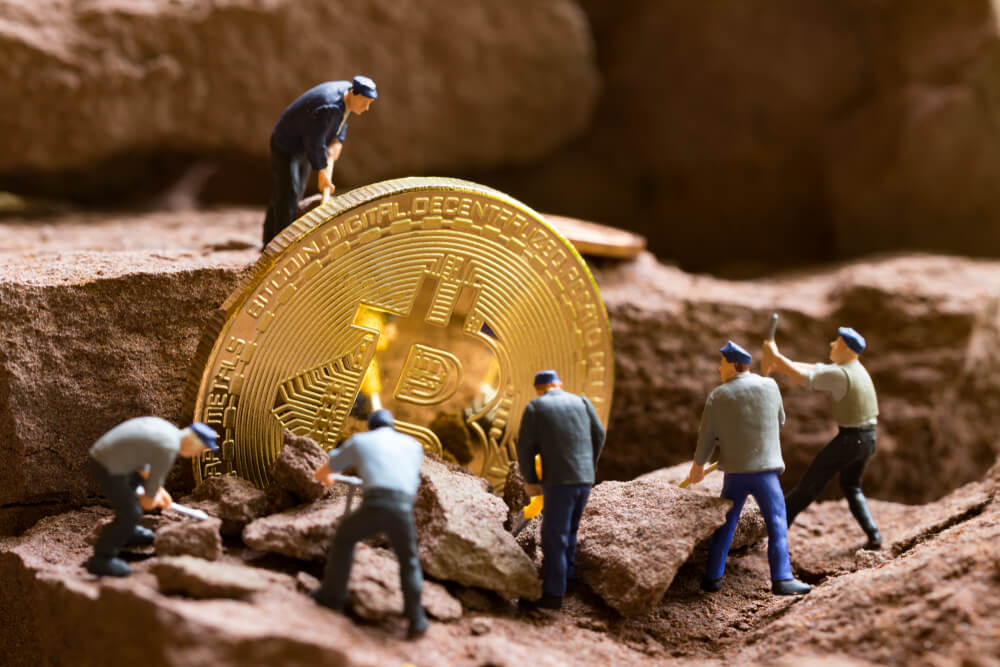
Whereas traders certainly enjoy the option of earning a few extra tokens through staking (i.e. mining), the fact that the system requires this mechanism to function highlights its imperfections. Why do we need this feature in the first place? Why should any system’s security depend on this? 

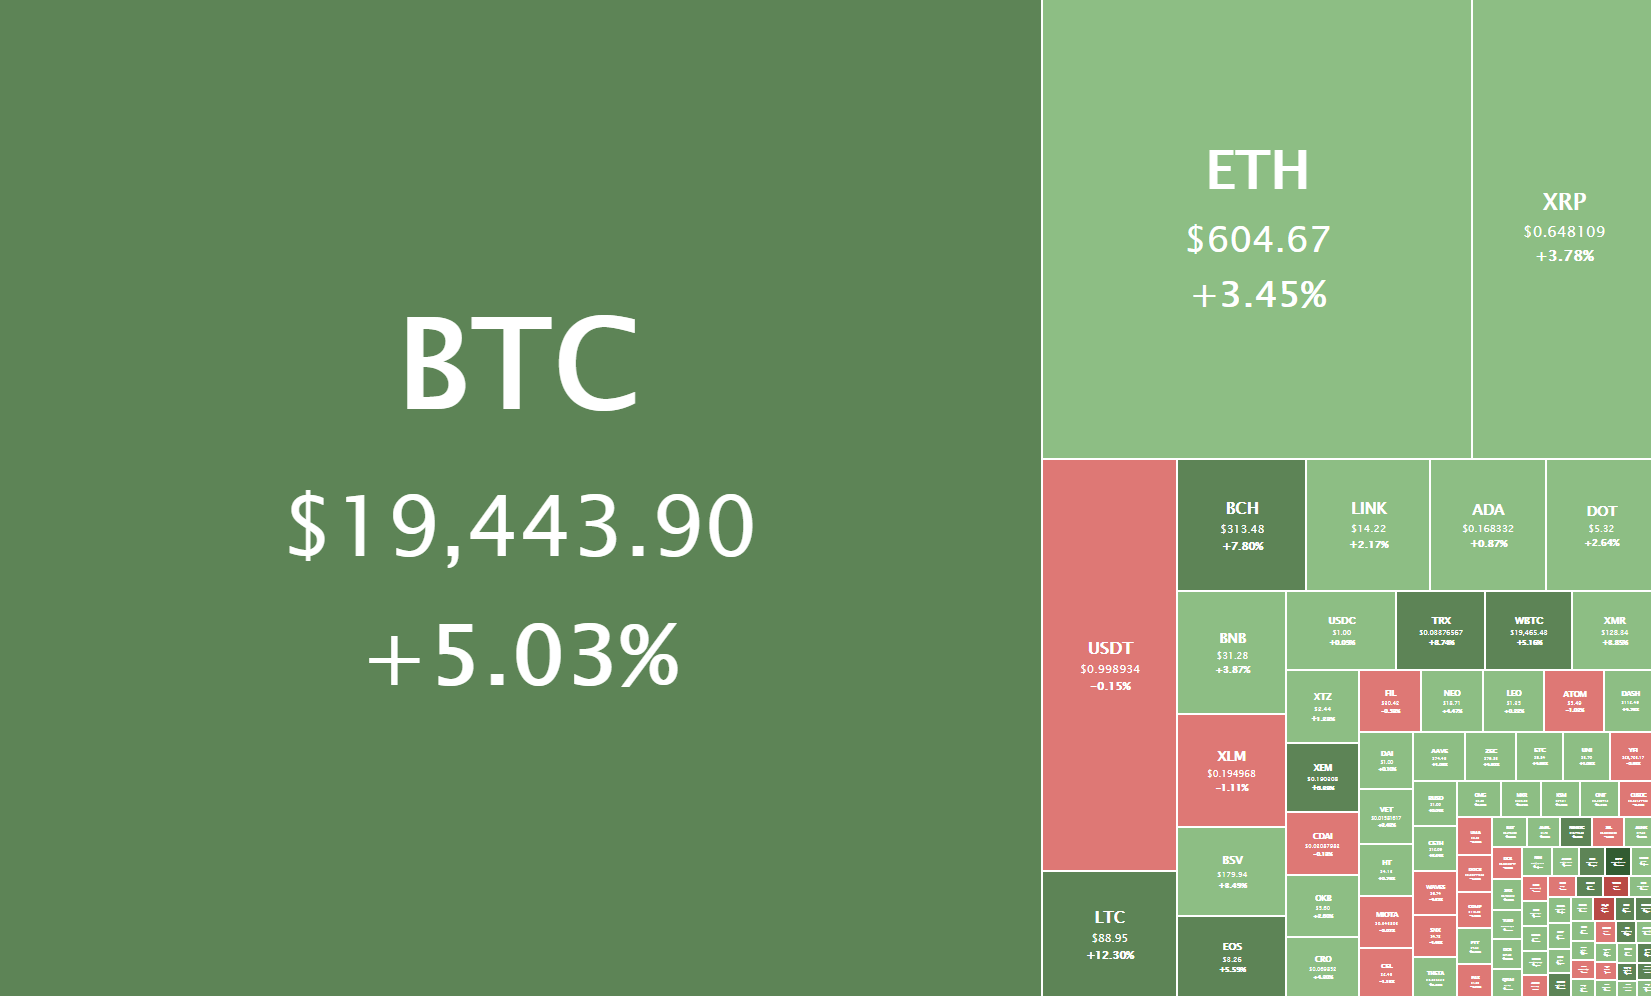
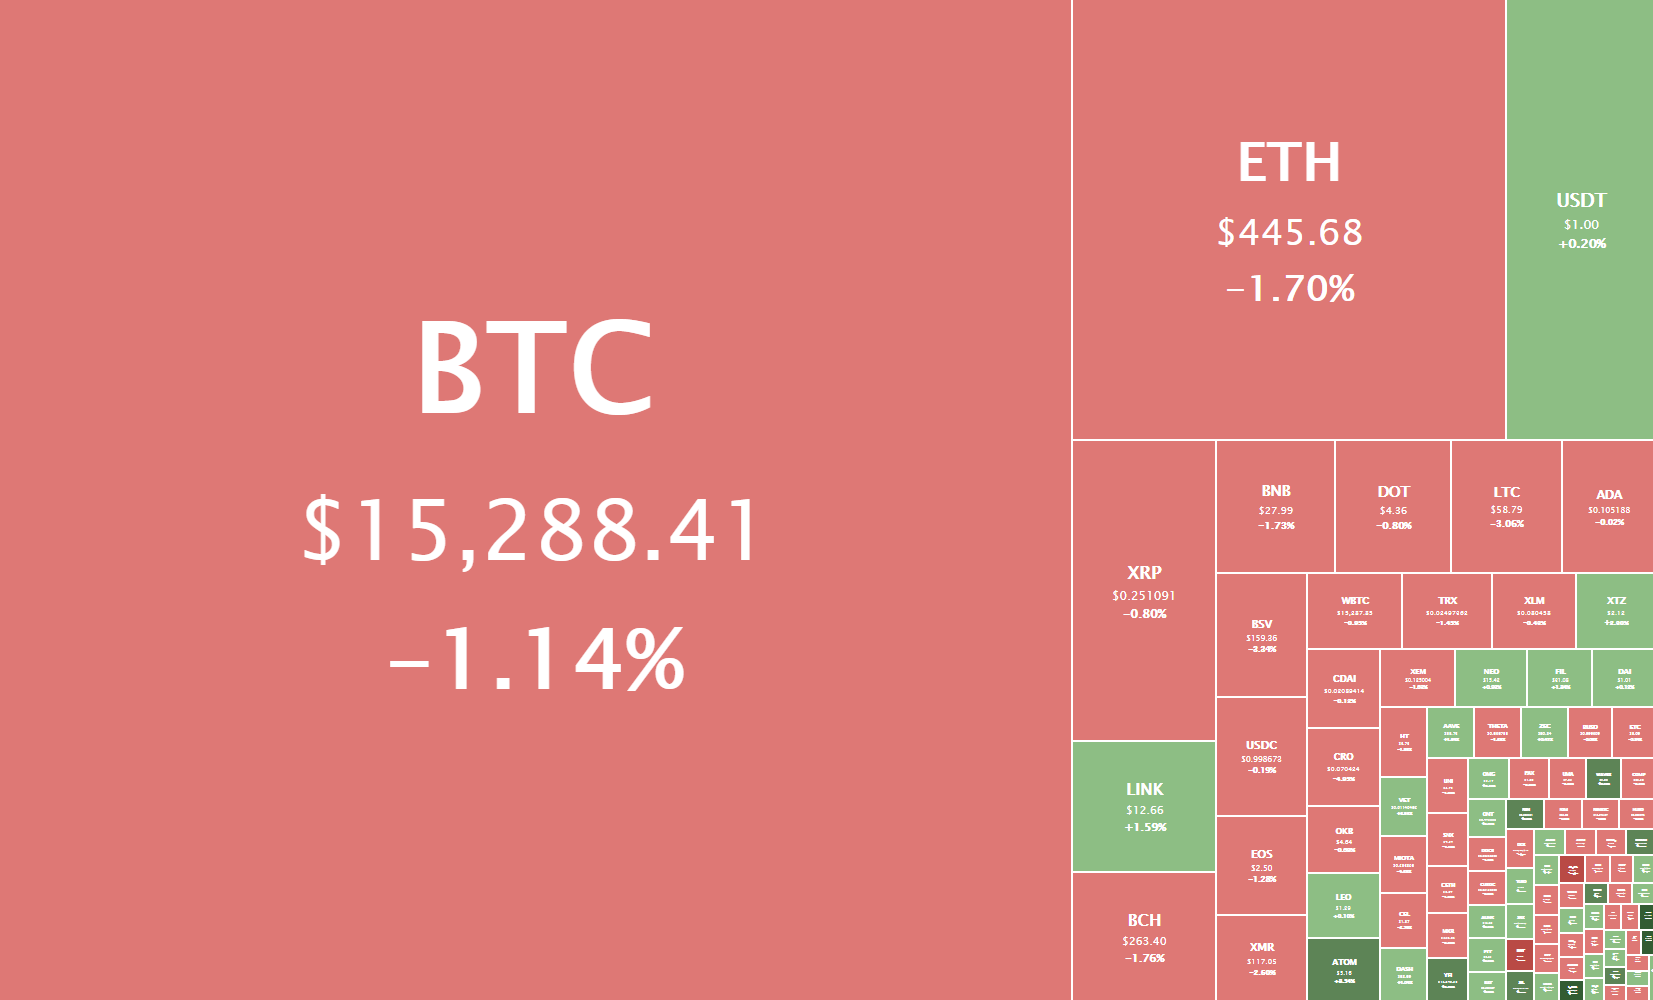
Luckily, we have seen some successful attempts to break this barrier in the recent past. A new distributed ledger, a permissioned distributed ledger, is able to process 10 times more transactions per second than any blockchain-based cryptocurrency. While Bitcoin still resides on Blockchain, XRP (previously called Ripple) cryptocurrency successfully uses the new system, which makes it surpass the limitations traders faced before.

Some people believe that the only reason we all rely on Blockchain is that no superior replacement has been found. So, are we still looking for a more efficient solution that can satisfy the basic requirements and speed up the process at the same time? Well, different companies have advertised their products in the past few years, claiming to have overcome challenges inherent to Blockchain.

Some financial professionals go as far as to say that this new distributed ledger finally leaves room for engineering scalable digital currency systems with the real potential to become, or even replace, major currencies in the global financial system.  

The Blockchain-based cryptocurrency system may never be apt at achieving this, but we finally have the stage ready for digital currencies to compete with conventional currencies on the global level. Interestingly enough, some like to think that these new possibilities pose a threat to both Bitcoin and Blockchain.

2. New coins to potentially harm Bitcoin

Ray Dalio believes how another cryptocurrency could disrupt Bitcoin, offering the impact iPhone had on Blackberry as an example. While changes are happening in the world of cryptocurrencies, avid Bitcoin enthusiasts believe that this scenario is highly unlikely.

The power of Bitcoin lies in its path dependence. This one-time invention is not just any product we will toss away after it serves its purpose. Now, why is that so?

The invention of Bitcoin was a critical breakthrough that can only happen once in a lifetime. Many argue how it was the way in which events unfolded that rendered Bitcoin the uniqueness it has. 

For example, if this new cryptocurrency was launched today, its chain security would be extremely weak at first, as it would require everything to be done afresh. As everyone is nowadays already familiar with Bitcoin, it is likely that the new cryptocurrency (which we will call Bitcoin 2.0) with weaker chain security would probably have to fight opposition in the form of banks and governments, among others. 

Therefore, Bitcoin’s importance does not only lie in what it brought to humankind but the organic sequence of events that led to its release. The order of events can hardly be replicated, which leaves little room for Bitcoin 2.0 ever being created.

What is more, Bitcoin’s money supply is scarce, which makes people want to hold it. Traders would always go for more liquidity, greater network effects, and stronger chain security, making Bitcoin 2.0 look rather pale in comparison. 

Even if Bitcoin 2.0 was devised in a way to feature negative scarcity (i.e. a deflationary monetary policy), it would be practically impossible to determine its rate, not to mention the mechanism of money supply decay.

Fighting for the best market position, impending and unavoidable chain forks would reduce Bitcoin 2.0’s liquidity and chain security, essentially making traders opt for the original Bitcoin.

3. Bitcoin’s Expiration Date

As we mentioned above, Bitcoin’s money supply is scarce. When Bitcoin was invented, it was issued on a predictable supply curve. We know that after the mid-22nd century, there would be no more Bitcoin made.

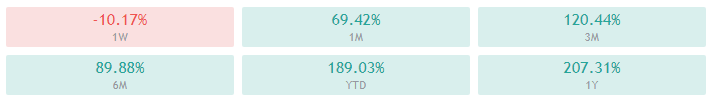
We additionally know that there is a point after which you literally can’t split the coin in half anymore and it also goes to zero (i.e. exponential decay that approaches zero). This means that, while in 2020 we had approximately 1800 coins produced per day, the production is going to fall below 1 by 2100. This is one of the things that make Bitcoin exceptionally unique.

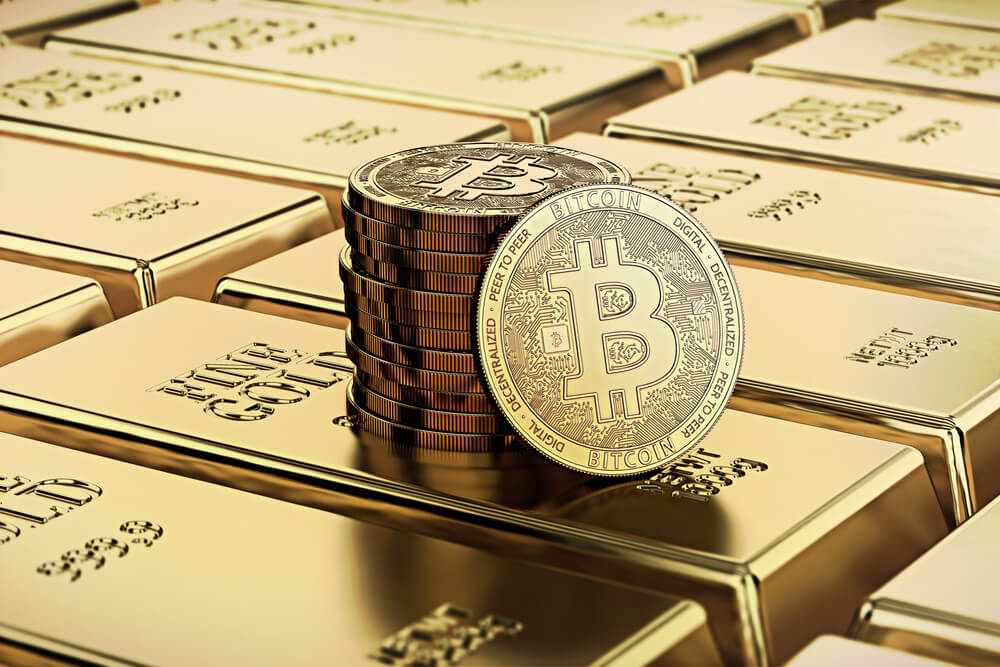
4. Bitcoin similar to gold

As the scarcest monetary metal, gold came to dominate the world. Owing to it being the most inflation-resistant, governments across the world built their monetary systems on this metal. Gold has several determining qualities that allowed it to serve as a medium of exchange:

  • durability, allowing it to persist through time without deteriorating
  • visibility, reflected in gold’s changeability and transformative power that makes it more tradable
  • portability, making gold easily moved from one place to another
  • recognizability, making it easy for people to differentiate between gold and anything else
  • scarcity or limited supply creating its value

Gold essentially became money because its supply was both scarce and predictable. People’s efforts to increase the production of gold could barely affect its supply. Because of this, gold turned into a preferred means of pricing and payment. 

Now, how can Bitcoin compare to that?

The absolute scarcity of Bitcoin, which we discussed in Part 1 of this series, makes it the ultimate pricing mechanism. This trait allows people to easily express their needs through trade, safely hold their capital, and compete at scale.

There are two main characteristics of gold that are essentially comparative to Bitcoin:

  1. production difficulty
  2. new supply predictability

History taught us how these played out with gold. However, Bitcoin may be even harder to obtain than this precious metal. Even if everyone focused on the production, we could still hardly generate more Bitcoin.

Bitcoin is based on a mechanism called difficulty adjustment, which makes it increasingly hard to forcefully obtain greater quantities of this cryptocurrency. While we can calculate with mathematical precision how many coins will be issued by the mid-22nd century (see the previous article for more information), it is unlike any asset or commodity we’ve heard of. 

It is important to understand that this mechanism functions in both directions – if more resources are directed at mining, other market participants will face difficulty in getting their share; similarly, if a percentage of production is stopped, others will enjoy easier access.

Scarcity of money affects its utility, which is why a zero growth terminal money supply represents perfect scarcity and makes Bitcoin a perfect monetary technology. We can say that there has only been one analog gold and Bitcoin, due to its uniqueness, is probably going to remain the only digital gold. Similarly, as gold’s value is undeniable, the market recognized Bitcoin’s worth. The more liquidity there is in the market, the more network effects and value it has as well.

It is also interesting to note how Bitcoin followed the same monetization path as gold did. No one used gold at first until they slowly started to recognize its value and importance. People started to barter gold and it slowly turned into an invaluable asset. Because of its stable value, gold penetrated all spheres of life over time, and we are already seeing how cryptocurrencies are taking over the world in a similar fashion. 

When people finally understood what gold was worth, it turned into a currency. Not only did people exchange gold for goods but gold also turned into money. That is how we had the gold standard and gold paper money as well. When people thought they were using banknotes, they were actually trading the value of gold. Now, currencies are no longer pegged to gold but think about Bitcoin here. Bitcoin serves the same purpose today. 

Bitcoin is slowly but surely gaining a track record in reliability, predictability, cost-effectiveness, and manipulation resistance, which puts it in the same position as gold. More and more individuals and public personas predict that Bitcoin will be the next reserve currency, which after this comparison with gold is far from surprising. 

5. Bitcoin supreme to CBDCs

Ray Dalio, who we first mentioned in the first article of this series, saw Bitcoin as inferior to central bank digital currencies (CBDCs) or cryptocurrencies such as Libra (i.e. Diem). Bitcoin is viewed as a less stable and more unpredictable medium of exchange. Naturally, this is a predictable statement because any currency in hands of large corporations such as banking institutions is prone to manipulation and external control. 

Monetary policies serve to enrich those whom these policies favor, and, as Bitcoin opened new doors that were previously unimaginable, we’ve seen more and more announcements on the issuance of new cryptocurrencies lately. There are many terms in which we can define this decision, but certainly, it is a wise move for those who recognized the movement Bitcoin set forth.

Still, as Bitcoin is undeniably a scarce money supply, it can only further appreciate in terms of exchange ratio against fiat currencies. It is a well-known fact that today’s currencies are printed freely, without any real value backing up these decisions. Over time, these activities can cause fiat currencies to become entirely worthless, as many have noticed already. 

Now, comparison with fiat currencies is a standard approach for determining the value of any emerging asset such as Bitcoin is. This price discovery is based on volatility assessment, which we have seen many times before. However, this mechanism in which we assign value may not be as functional as one may think.

In 1999, when Amazon crashed 94% from 85 USD to only 5 USD, no one expected a massive comeback. However, when Amazon started conquering the digital sphere, its value impressively grew by over 33,000%. This is an excellent example of how gaining control over the digital world entails gaining space driven by scarcity. Like with gold, Amazon ascended to market dominance owing to finite distribution channels and winner-take-all dynamics previously seen with gold.

Now, many would say that this is a highly volatile stock and they would be correct. However, volatility goes both ways or, more precisely, its function is two-fold. We need volatility to go both up and down. There can be no superiority in performance without undergoing volatility. And, the same is true for Bitcoin despite it not being a stock. There needs to be some volatility between zero and the top. What we have been seeing in the cryptocurrency market lately is demonstrative of this mechanism. So, we only need to power through. 

Now, contrary to popular belief, money is not a government creation although governments evidently want their piece of cake. Any trading society will require a medium, which money serves since it is simply the most tradable thing. People will always conduct trading to get to the things they need. Before they exchanged goods and now we exchange other things. So, as this dynamic unfolds, something necessarily becomes more tradable than anything else does. We mentioned at the beginning of this article which traits propelled gold to its globally recognized position, so you can compare for yourself where Bitcoin stands in terms of durability, visibility, portability, recognizability, and most importantly scarcity in comparison to emerging cryptocurrencies. All based on the information we provided in the first and the second article of this series. 

Would you bet on Bitcoin’s superior monetary traits?

Categories
Cryptocurrencies

Bitcoin: 10 Things I Wish I’d Known Earlier

Bitcoin is a crazy beast! It’s had some huge ups and downs over the past few years for those that are trading it as well as those that are simply holding it. Much like many things in life, we know a lot more now than we did a few years back, and there are things that we know now that we absolutely wished that we knew back then. That is what we are going to be looking at today, 10 things that we wish we had known about Bitcoin all those years ago.

It Will Hit $30,000+

Many people said it, yet a lot of the people that stated that Bitcoin would hit those prices did not put their money where their mouth is. Unfortunately, I was one of those people. I told others that it would go that high, others bought in because of what I said, yet I did not. I simply said it but did not do it. That was a huge mistake, especially as I had some bitcoin from back when they were worth about $10, I also had some when they were worth $6,000. Now that they are worth over $30,000, I have none. So I wish I had taken my own advice and bought in. A really tough lesson, but a good one.

There Are No Bull or Bear Markets (Technically)

This may sound strange, but if you look at bitcoin as a whole, there is only a bullish market with pretty much no bears. The problem is that most people look at the short term, what is happening now, and I have done the same thing. I have seen drops and I have sold, rather than looking at the big picture. When we look at long term trading, then the markets have only moved up, meaning that if we buy at any point in bitcoins history, we would now be making money. Even if we bought at the previous all-time highs, which people said was a stupid thing to do, at the time yes, but overall no. the markets are bullish, and probably will be for years to come.

Don’t Believe Everything You Hear

People say a lot of things. Some may turn out to be true, while others can be completely made up. The crypto and Bitcoin world is full of people saying things. If you believe it all you will be buying and selling every minute. Instead, you need to find sources that give good and accurate information. Easier said than done, but it is possible, do not listen to social media, which is simply full of people shouting about anything they want without any real evidence behind it.

Idiots Make Money Too

We often see things about people selling their homes to buy bitcoin. We all called them an idiot, but now, they are pretty darn rich…but they are still idiots. People risk all sorts of things on hopes and dreams, some work out others don’t. Just because someone made a lot of money with bitcoin does not mean that they aren’t idiots.

Volatility Is Great

A lot of people are scared of volatility and there is a lot of it when it comes to Bitcoin, but it is also the volatility that makes it so profitable. I was a little scared of the volatility, the fact that I could very easily lose my money, but instead I should have been looking at the opportunities that it was presenting me. I should have used that volatility to help increase my accounts and to look at it as a good thing rather than the bad that I did.

Learn From the Mistakes

Mistakes are there as a brilliant learning tool, one that should always be used. Unfortunately, it is not something that I used. Instead, I committed the same mistake multiple times, to the horror of my account balance. Of course, eventually, I did learn from them and no longer make them, but I should have known that I needed to learn straight away. If you make a mistake, be sure that you learn from it and don’t commit the same mistakes over and over.

You Can’t Trade It Like Forex

While it looks very similar and uses the same brokers and charts, the way that you trade bitcoin varies a lot when you compare it to forex trading. Again, this is something that I did not realise straight away. When I began trading it, I traded it with the same strategies and this led to a lot of losses. Bitcoin simply does not follow the same fundamentals or systems that forex trading does, so you need to adapt, and need to create your own strategy that better suits the way that bitcoin moves.

People Control the Markets

Something that I learned a little down the line was that the Bitcoin markets are not entirely their own thing. They can be massively influenced by a number of large traders, they can freeze the price or help to push it up, so when you see huge movements from different wallets. This can give you an idea of what may be about to happen. I never took any notice back then of huge sell-offs or huge buys, but if I had I would have made a lot more and prevented some of the losses that I had.

It’s Easy to Access Bitcoin

A few years back it was not quite as easy to get access to bitcoin, to buy it, or to trade it. However, it wasn’t anywhere near as hard to get than I thought it was. There were many more brokers offering it. I was simply sticking to the major brokers, ones that offered it with pretty high spreads. Instead, I should have been looking for more specialist brokers, the ones that are focusing on cryptocurrencies. There were quite a few of them around and they offered much better trading conditions.

There Is A Lot of Dead Hype

Hype is all around when it comes to cryptocurrencies, especially Bitcoin. Everywhere you look you will see people hyping up the price or what will happen. The problem is that a lot of this hype has come from nothing. There is nothing fueling it. The next big bull run is tomorrow, next week, the month after, there will be hype and rumours about it pretty much all the time. You need to be careful what you listen to and which bits of hype you listen to. Certainly don’t believe everything that you hear.

Those are 10 things that I wish I knew earlier about Bitcoin, some when I look back are pretty obvious and I should have known, but we often get caught up in the moment and I certainly did. There are probably other things that I should have known or done, but that is the past, it is now time to look to the future and what can be achieved from here, using what I have learned.


Categories
Cryptocurrencies

Who Is the True Creator of Bitcoin?

Satoshi Nakamoto is the known and recognized creator of Bitcoin. And even if we don’t know who Satoshi Nakamoto is or was, we do know what he has done. He or she (or they) invented the bitcoin protocol and published it in a scientific paper through the Cryptography Mailing List in October 2008.

No one knows his or her identity, which makes this all the more mysterious. We will refer to Satoshi as “he” going forward in this article. Satoshi’s identity is a topic that always arouses curiosity. It is for this reason that we publish this article echoing the information that exists to date. In 2009 he published the first version of the bitcoin client and participated with others in the project until his presence began to dilute towards the end of 2010.

He worked with others at first although he took great care not to make personal information visible and the last one he knew of him/her was in the spring of 2011 when he said that “he was to other things”.

But it’s Japanese, isn’t it?

“Satoshi” means “clear, witty, wise thinking”.

“Naka” can mean “mean, relationship”.

“Moto” can mean “origin or creation”.

We can’t know for sure if he was Japanese or not, not even his gender, age, or any other data. We might even be talking about a group of people, instead of a single individual.

Does anyone know who Nakamoto is?

No, but the conclusions people draw when they start to investigate can lead to even more intriguing information. Joshua Davis of the New Yorker believes that Satoshi Nakamoto is Michael Clear, a cryptography student at Trinity College in Dublin.

He drew this conclusion after analyzing 80,000 words from Nakamoto’s writings and looking for grammatical coincidences. He also suspected Finnish sociologist, economist, and video game developer Vili Lehdonvirta. Both have denied being the creators of bitcoin, making it public to Michael Clear at the 2013 Web Summit.

Fast Company’s Adam Penenberg contradicted that information by claiming that Nakamoto was three people:

“Neal King, Vladimir Oksman and Charles Bry”.

He came to this conclusion by writing loose phrases from Nakamoto’s scientific article on Google to see if they were used anywhere else. One of them, “computationally impractical to reverse”, turned out to be part of a patent application filed by these three people, regarding a system to update and distribute encryption keys.

“… the outputs of which are fixed-size strings that are computationally 

impractical to reverse-map. In this manner, the shared secret …”

The bitcoin.org domain originally used to publish the scientific paper created by Satoshi had been registered three days before the patent request.

It was registered in Finland and one of the patent authors had traveled there six months before the domain was registered.

All of those “involved” deny it.

In any case, when the bitcoin.org domain was registered on August 18, 2008, he/she who registered it used a Japanese anonymous registration service and the hosting used a Japanese ISP. The registration of the site was then transferred to Finland on 18 May 2011.

It is curious that the domain with extension “.com” (usually the most desired, bitcoin.com) was registered on January 4, 2008… Maybe it’s just chance. Currently, Bitcoin.com is owned by Roger Ver.

Others think it was Martii Malmi, a developer from Finland who has been involved in bitcoin development from the start, creating its user interface.

In May 2013, internet pioneer Ted Nelson added more fuel to the fire by stating that Satoshi could be Japanese mathematician Shinichi Mochizuki, although he admits that the evidence is circumstantial at best.

In February 2014, Leah McGrath Goodman of Newsweek claimed to have found the real Satoshi Nakamoto. Dorian S Nakamoto has since denied knowing anything about Bitcoin, coming to hire a lawyer and making an official statement.

Hal Finney, Michael Weber, Wei Dai, and other developers are among the names that occasionally come to light in media reports and discussions in online forums as potential “Satoshis”.

A group of forensic linguists from Aston University believes that the real creator is retired law professor Nick Szabo, based on the analysis of the scientific article on bitcoin.

Dominic Frisby, a comedian, and writer also suggests that Szabo is the strongest candidate to be Satoshi in his book “Bitcoin: The Future of Money”.

His detailed analysis takes into account the linguistic factors of what Satoshi wrote as well as his knowledge of C++ and his likely birthday date.

To a large extent, all of these potential Satoshi candidates have insisted that they are not the creators of bitcoin.

Michael Weber hasn’t answered yet.

Some even think that Bitcoin has been the creation of 4 leading technology companies. This is because the name of Satoshi Nakamoto carries within it clues to them: SAmsung, TOSHIba, NAKAmichi, and MOTOrola.

Jed McCaleb, a lover of Japanese culture living there who created Mt. Gox and co-founded Ripple and later Stellar, has also been targeted.

Another theory suggests that scientists Donal O’Mahony and Michael Peirce are Satoshi Nakamoto, based on a scientific paper of which they are authors and which deals with virtual payments together with Hitesh Tewari, based on a book they published together. O’Mahony and Tewari also worked at Trinity College, that is, at the same site as Michael Clear.

Israelis Dorit Ron and Adi Shamir of the Weizmann Institute recanted allegations made in an article suggesting a link between Satoshi and Silk Road, the black market dismantled by the FBI in October 2013. They suggested a link between an address that supposedly belonged to Satoshi and the site.

Security investigator Dustin D. Trammel owned the address and was said to be Satoshi. Either way, others think he wasn’t even Japanese. His English, in the texts he wrote, shows typical idiomatic nuances of a native English.

What do we know about him?

One thing we know, based on interviews with people who have worked with him/her in the early stages of bitcoin development is that their system is very well thought out. His coding skills were unconventional, according to developer Jeff Garzik, as he did not apply the same tests on the code you would expect from a classic computer engineer.

How many bitcoins could he have?

In an analysis made by Sergio Lerner, an authority in the world of Bitcoin and cryptography, it was suggested that Satoshi mined most of the first blocks of the network and that he could have a fortune of about a million bitcoins.

What is he doing now?

No one knows what Satoshi is currently involved in. But in one of the last emails he sent to a developer, dated April 23, 2011, he said, “I’ve moved on to other things. He’s in good hands with Gavin and the rest.”

Does he work for the government?

Although there are rumors that Satoshi may work for one of the “three-letter” intelligence agencies (CIA, FBI, etc.), or maybe even some shadow organization looking for a common currency to dominate the planet, developer Jeff Garzik makes it clear:

“Satoshi published an open-source system so that no one needed to know who he was or what knowledge he had. Open-source software makes it impossible to hide secrets. Source code speaks for itself.”

In fact, he was smart to use a pseudonym. This, then, forces people to focus on the technology itself rather than the person behind it.

Today, Bitcoin is much bigger than the figure of Satoshi Nakamoto. It doesn’t matter who it is for many anymore. Its initial code has been improved thanks to the effort of some of the best brains on the planet working collaboratively. The work has been done in a totally altruistic way daily making this technology better and better.

Categories
Crypto Market Analysis

Daily Crypto Review, Dec 29 – XRP Trading Suspended by Coinbase and OKEx, Causing a 22% Price Dip

The cryptocurrency sector had is currently in a consolidation phase as Bitcoin fell below $27,000. Bitcoin is currently trading for $26,624, representing a decrease of 1.13% compared to yesterday’s value. Meanwhile, Ethereum’s price has decreased by 2.56% on the day, while XRP had another major dip, losing 19.42% of its value.

 Daily Crypto Sector Heat Map

Ethereum Lightning gained 1097.36% in the past 24 hours, making it the most prominent daily crypto gainer by far. It is followed by N3RD Finance’s 94.18% and Matrix AI Network’s 86.08% gain. On the other hand, COVER Protocol lost 97.97%, making it the most prominent daily loser. It is followed by Encryptgen’s loss of 91.18% and Mining Core Coin’s loss of 69.41%.

Top 10 24-hour Performers (Click to enlarge)

Bottom 10 24-hour Performers (Click to enlarge)

Bitcoin’s market dominance has moved up slightly since our last report, with its value currently being 69.2%. This value represents a 0.1% difference to the upside than the value it had when we last reported.

Daily Crypto Market Cap Chart

The cryptocurrency sector capitalization has decreased slightly since we last reported, with its current value being $712.73 billion. This represents an $8.45 billion decrease when compared to our previous report.

_______________________________________________________________________

What happened in the past 24 hours?

_______________________________________________________________________

_______________________________________________________________________

Technical analysis

_______________________________________________________________________

Bitcoin

Ever since it hit the $28,391 all-time high, Bitcoin has been trading in a sideways manner. Its price is currently within a large channel, bound by $25,512 to the downside and the aforementioned all-time high to the upside.

The descending volume alongside sideways trading was never a long-term occurrence with Bitcoin, but rather good indicators of a new explosive move ahead.

Bitcoin traders should be mindful of any volume spikes when trading, and should look for smaller time-frame Fib retracements if they want to be more precise with setting their support and resistance levels.

BTC/USD 1-hour chart

Bitcoin’s technicals on both short-term and long-term time-frames are completely bullish and show close to no signs of neutrality or bearishness.

BTC/USD 1-day Technicals

Technical factors (4-hour Chart):
  • Price is above its 50-period EMA and at its 21-period EMA
  • Price is at its middle Bollinger band
  • RSI is neutral (55.72)
  • Volume is slightly above average, but descending
Key levels to the upside          Key levels to the downside

1: $28,391                                 1: $25,512

2: $29,000                                 2: $24,696

3: $30,000                                  3: $24,315

Ethereum

Ethereum’s move towards the upside ended at $747, prompting a pullback. However, while many analysts believed that Ether would not keep its price above $700, that’s exactly what happened.

Ethereum’s signature trading move has occurred once again, with that move being: pushing up, then pulling back, and breaking the 21-hour moving average to the downside, only to find support at the 50-hour moving average and push back up. Knowing how Ethereum moves alongside watching Bitcoin’s moves is one of the safest ways to trade cryptocurrencies at the moment, as the moves have pre-determined stop-losses and targets.


ETH/USD 1-hour Chart

Ethereum’s shorter time-frames are completely bullish and show no signs of neutrality or bearishness, while its longer-time frames have some neutrality present alongside the overall bullishness.

ETH/USD 1-day Technicals

Technical Factors (4-hour Chart):
  • Price is above both its 50-period and its 21-period EMA
  • Price is above its middle Bollinger band
  • RSI is neutral (59.39)
  • Volume is trading on above-average levels
Key levels to the upside          Key levels to the downside

1: $747                                     1: $675

2: $800                                     2: $653 

3: $900                                      3: $632

Ripple

XRP has experienced another extremely bad day, as its price dropped more than 22% on the day. The move came as a result of two major exchanges, OKEx and Coinbase, dropping support for XRP due to the pending lawsuit against its company, Ripple, as well as Ripple’s executives.

Trading XRP is extremely risky at the moment due to price fluctuations that are a result of news rather than technical formations.

XRP/USD 1-hour Chart

XRP’s technicals on all time-frames are tilted towards the sell-side, with all of them showing slight signs of neutrality.

XRP/USD 1-day Technicals

Technical factors (4-hour Chart):
  • Its price is currently far below both its 50-period EMA and its 21-period EMA
  • Price is at its bottom Bollinger band
  • RSI is in the oversold territory (28.88)
  • Volume has spiked to above-average levels
Key levels to the upside          Key levels to the downside

1: $0.25                                    1: $0.214

2: $0.30                                     2: $0.14

3: $0.358 

Categories
Crypto Market Analysis

Daily Crypto Review, Dec 28 – Ethereum Breaks $700; Bitcoin at $30k?

The cryptocurrency sector had an incredible weekend as Bitcoin skyrocketed towards $28,000. Bitcoin is currently trading for $27,031, representing a decrease of 2.91% compared to yesterday’s value, but a massive increase compared to its value on Friday. Meanwhile, Ethereum’s price has increased by 12.79% on the day, while XRP managed to lose 4.05%.

 Daily Crypto Sector Heat Map

EncrypGen gained 2787.56% in the past 24 hours, making it the most prominent daily crypto gainer by far. It is followed by Bankacoin’s 212.44% and Trabzonspor Fan Token’s 178.8% gain. On the other hand, CEZO lost 89.89%, making it the most prominent daily loser. It is followed by JD Coin’s loss of 64.79% and Triumph X’s loss of 57.74%.

Top 10 24-hour Performers (Click to enlarge)

Bottom 10 24-hour Performers (Click to enlarge)

Bitcoin’s market dominance has moved down slightly since our last report, with its value currently being 69.1%. This value represents a 0.25% difference to the downside than the value it had when we last reported.

Daily Crypto Market Cap Chart

The cryptocurrency sector capitalization has increased over $100 billion since we last reported, with its current value being $721.10 billion. This represents a $101.89 billion increase when compared to our previous report.

_______________________________________________________________________

What happened in the past 24 hours?

_______________________________________________________________________

_______________________________________________________________________

Technical analysis

_______________________________________________________________________

Bitcoin

Bitcoin did not sleep this weekend as it took its time to push towards new all-time highs. The best-known cryptocurrency pushed towards the upside, reaching as high as $28,391 at one point. It is now consolidating around the $27,000 level and preparing for the next move.

Our Fib extensions drawn on Friday worked exactly as expected, with Bitcoin respecting every single one of them. With all of them still being a valid choice, traders should either look for a bounce off the immediate support levels or increased volume followed by a sharp increase in price. Trading Bitcoin’s pullbacks is not exactly the best option at the moment.

BTC/USD 4-hour chart

While Bitcoin’s 4-hour and weekly technicals show a full tilt towards the buy-side, its daily and monthly technicals show some neutrality signs.

BTC/USD 1-day Technicals

Technical factors (4-hour Chart):
  • Price is above its 50-period EMA and slightly above its 21-period EMA
  • Price is slightly above its middle Bollinger band
  • RSI is neutral (62.10)
  • Volume is slightly above average
Key levels to the upside          Key levels to the downside

1: $28,391                                 1: $25,512

2: $29,000                                 2: $24,696

3: $30,000                                  3: $24,315

Ethereum

While Ethereum did manage to score some gains over the weekend, its upside got overshadowed by Bitcoin’s growth. However, the second-largest cryptocurrency by market cap has decided to make that up by suddenly pushing from $624 all the way up to $738. While the move seemingly ended here, it is not yet certain whether the price will break the level or go even higher, or start its consolidation at slightly lower levels.

Traders should utilize the volume indicator, order books, and well-established support/resistance levels to its fullest to catch these explosive trades while remaining safe.

ETH/USD 4-hour Chart

Ethereum’s shorter time-frames are completely bullish, while its longer-time frames show slight neutrality signs.

ETH/USD 1-day Technicals

Technical Factors (4-hour Chart):
  • Price is far above both its 50-period and its 21-period EMA
  • Price is at its top Bollinger band
  • RSI has stepped into the overbought territory (71.68)
  • Volume is trading on above-average levels
Key levels to the upside          Key levels to the downside

1: $738                                     1: $675

2: $800                                     2: $632 

3: $900                                      3: $600

Ripple

XRP has been trading on low volume and slowly descending after a brief rally to $0.385. The fourth-largest cryptocurrency keeps getting crushed by various companies dropping support or liquidating their XRP positions after Ripple and its executives got sued by the SEC.

XRP traders should (more than anything) pay attention to the news. However, there are many other cryptocurrencies with much safer and potentially more profitable trading setups at the moment.

XRP/USD 4-hour Chart

XRP’s technicals on all time-frames slightly tilted towards the sell-side, but they all show some signs of uncertainty.

XRP/USD 1-day Technicals

Technical factors (4-hour Chart):
  • Its price is currently far below its 50-period EMA and slightly below its 21-period EMA
  • Price slightly below its middle Bollinger band
  • RSI has left the oversold territory (37.46)
  • Volume is returning to average levels
Key levels to the upside          Key levels to the downside

1: $0.30                                    1: $0.25

2: $0.358                                   2: $0.214

3: $0.475 

Categories
Crypto Market Analysis

Daily Crypto Review, Dec 24 – XRP Downturn Pulls the Crypto Sector in the Red

The cryptocurrency sector reacted to XRP getting crushed by the market and ended up mostly in the red. Bitcoin is currently trading for $23,112, representing a decrease of 1.97% when compared to yesterday’s value. Meanwhile, Ethereum’s price has decreased by 6.27% on the day, while XRP managed to lose a whopping 30.85%.

 Daily Crypto Sector Heat Map

Folgory Coin gained 5571.49% in the past 24 hours, making it the most prominent daily crypto gainer by far. It is followed by MINDOL’s 1224.26% and DACC’s 1070.44% gain. On the other hand, 3x Long XRP Token lost 77.00%, making it the most prominent daily loser. It is followed by B21 Invest’s loss of 74.30% and YFPRO Finance’s loss of 70.96%.

Top 10 24-hour Performers (Click to enlarge)

Bottom 10 24-hour Performers (Click to enlarge)

Bitcoin’s market dominance has moved up over one percent since our last report, with its value currently being 69.3%. This value represents a 1.5% difference to the upside than the value it had when we last reported.

Daily Crypto Market Cap Chart

The cryptocurrency sector capitalization has decreased significantly since we last reported, with its current value being $619.31 billion. This represents a $22.90 billion decrease when compared to our previous report.

_______________________________________________________________________

What happened in the past 24 hours?

_______________________________________________________________________

_______________________________________________________________________

Technical analysis

_______________________________________________________________________

Bitcoin

Bitcoin was one of the few cryptocurrencies not affected by the major downturn of XRP after the SEC announced a lawsuit against Ripple and its executives. The largest cryptocurrency by market cap stayed within its wide range and continued trading sideways after bouncing back from the $24,000 level.

Traders currently have the option to catch a couple of safe trades within the trading range Bitcoin is in, or wait for it to spike in volume and break the range (either to the downside or upside).

BTC/USD 4-hour chart

While Bitcoin’s daily and weekly technicals are slightly tilted towards the bull side, its 4-hour and monthly technicals show some hints of neutrality alongside the bullishness.

BTC/USD 1-day Technicals

Technical factors (4-hour Chart):
  • Price is above its 50-period EMA and at its 21-period EMA
  • Price at its middle Bollinger band
  • RSI is neutral (53.57)
  • Volume is slightly above average
Key levels to the upside          Key levels to the downside

1: $24,315                                 1: $22,054

2: $24,700                                 2: $21,350

3: $25,511                                  3: $19,918

Ethereum

Unlike Bitcoin, Ethereum got affected by XRP’s downturn, which pulled it back over 5% on the day. The second-largest cryptocurrency fell below its $600 support level, and caused a quick panic-sell which brought its price as low as $550 (though just for a moment). Ether is now fighting to stay above the $581 level, which it will most likely succeed.

Many analysts are calling for a double bottom and are expecting an upswing from Ethereum. Traders should pay close attention to Ether’s volume and (possibly) order books.

ETH/USD 4-hour Chart

Ethereum’s weekly and monthly technicals are completely bullish, while its 4-hour and daily overview are mainly tilted towards the sell-side, but show some signs of uncertainty.

ETH/USD 1-day Technicals

Technical Factors (4-hour Chart):
  • Price is below both its 50-period and its 21-period EMA
  • Price is close to its bottom Bollinger band
  • RSI is neutral (37.44)
  • Volume is on slightly above-average levels
Key levels to the upside          Key levels to the downside

1: $600                                     1: $581

2: $632                                     2: $564 

3: $675                                      3: $545

Ripple

XRP got crushed as more bad news came. The fourth-largest cryptocurrency by market cap got dropped by various exchanges, as well as its positions fully liquidated by major funds such as Bitwise. Its price dipped over 65% in just 5 days. However, XRP seems to have found support in (first) the $0.214 and (later) $0.25 levels.

XRP will most likely try to either hold its price level or push slightly towards the upside. While its further downside potential is not very high (unless more bad news comes out), buying or longing XRP is extremely risky.

XRP/USD 4-hour Chart

XRP’s technicals on all time-frames are completely tilted towards the sell-side.

XRP/USD 1-day Technicals

Technical factors (4-hour Chart):
  • Its price is currently far below both its 50-period EMA and its 21-period EMA
  • Price slightly above its bottom Bollinger band
  • RSI is in the oversold territory (19.40)
  • Volume is on extremely high levels
Key levels to the upside          Key levels to the downside

1: $0.30                                    1: $0.25

2: $0.358                                   2: $0.214

3: $0.475 

Categories
Crypto Market Analysis

Daily Crypto Review, Dec 23 – Is This the End of XRP? SEC Officially Files Lawsuit Against Ripple and its Executives

The cryptocurrency sector was mostly neutral as Bitcoin gained even more market dominance. Bitcoin is currently trading for $23.498, representing an increase of 3.53% when compared to yesterday’s value. Meanwhile, Ethereum’s price has increased by 1.28% on the day, while XRP managed to lose a whopping 23.99%.

 Daily Crypto Sector Heat Map

SYNC Network gained 97.23% in the past 24 hours, making it the most prominent daily crypto gainer by far. It is followed by 3x Short XRP Token’s 84.56% and Basis Share’s 77.1% gain. On the other hand, DMme lost 85.99%, making it the most prominent daily loser. It is followed by 3x Long XRP Token’s loss of 66.89% and S4FE’s loss of 60.04%.

Top 10 24-hour Performers (Click to enlarge)

Bottom 10 24-hour Performers (Click to enlarge)

Bitcoin’s market dominance has moved up over one percent since our last report, with its value currently being 67.8%. This value represents a 1.2% difference to the downside than the value it had when we last reported.

Daily Crypto Market Cap Chart

The cryptocurrency sector capitalization has increased since we last reported, with its current value being $642.21 billion. This represents a $9.69 billion increase when compared to our previous report.

_______________________________________________________________________

What happened in the past 24 hours?

_______________________________________________________________________

_______________________________________________________________________

Technical analysis

_______________________________________________________________________

Bitcoin

Bitcoin continued trading within a decently large range, bound by $22,054 to the downside and $24,315 to the upside. The largest cryptocurrency by market cap managed to gain a couple of percent on its price today, as most of the market consolidated. Therefore, Bitcoin market dominance has risen once again, almost reaching 70%.

Bitcoin’s descending volume and sideways trading were always a sign of a new move in the making. However, as the current trading range is quite wide, the sharp move to either side might not be so imminent.

BTC/USD 4-hour chart

While Bitcoin’s daily and weekly technicals are tilted towards the bull side, its 4-hour and monthly overviews are slightly bullish, but show some hints of neutrality.

BTC/USD 1-day Technicals

Technical factors (4-hour Chart):
  • Price is above its 50-period EMA and slightly above its 21-period EMA
  • Price near its middle Bollinger band
  • RSI is neutral (56.31)
  • Volume is slightly above average
Key levels to the upside          Key levels to the downside

1: $24,315                                 1: $22,054

2: $24,700                                 2: $21,350

3: $25,511                                  3: $19,918

Ethereum

Ethereum has followed Bitcoin to the upside and gained just enough traction to attempt a $632 level break, but not enough to actually break it. This triggered a small correction, which brought it to the middle of the range, bound by $600-$602 to the downside and $632 to the upside.

Ethereum’s price movements are (in the past couple of days) either an exact copy of Bitcoin’s moves, or an exaggerated move in the same direction. Traders could possibly use this to trade Ether’s exaggerated moves by watching Bitcoin’s movement.

ETH/USD 4-hour Chart

Ethereum’s daily, weekly, and monthly technicals are completely bullish, while its 4-hour overview is tilted towards the sell-side.

ETH/USD 1-day Technicals

Technical Factors (4-hour Chart):
  • Price is slightly below both its 50-period and its 21-period EMA
  • Price is close to its middle Bollinger band
  • RSI is neutral (44.94)
  • Volume is on slightly above-average levels
Key levels to the upside          Key levels to the downside

1: $632                                     1: $600

2: $675                                     2: $581 

3: $738.5                                   3: $564

Ripple

XRP got crushed today on horrible news of SEC officially filing a lawsuit against its company Ripple as well as against its cofounders. While MoneyGram took a lenient position and didn’t want to make any negative comments, most crypto exchanges are planning on delisting XRP due to concerns regarding regulation.

While some may think that short-selling XRP is a good idea, watch out for slippage and insufficient demand.

XRP/USD 4-hour Chart

XRP’s short-term technicals show a heavy tilt towards the sell-side, while its long-term technicals (weekly and monthly) remain bullish.

XRP/USD 1-day Technicals

Technical factors (4-hour Chart):
  • Its price is currently far below both its 50-period EMA and its 21-period EMA
  • Price slightly below its bottom Bollinger band
  • RSI is in the oversold territory (18.53)
  • Volume is on extremely high levels
Key levels to the upside          Key levels to the downside

1: $0.40                                    1: $0.33

2: $0.475                                   2: $0.297

3: $0.481 

Categories
Crypto Market Analysis

Daily Crypto Review, Dec 22 – XRP Plummets on News of SEC Suing Ripple; Crypto Sector in the Red

The cryptocurrency sector bounced back from its recent highs as the news of a new COVID-19 strain came out. Bitcoin is currently trading for $22,716, representing a decrease of 5.01% when compared to yesterday’s value. Meanwhile, Ethereum’s price has decreased by 5.41% on the day, while XRP managed to lose a whopping 16.97%.

 Daily Crypto Sector Heat Map

P2P gained 185.24% in the past 24 hours, making it the most prominent daily crypto gainer by far. It is followed by DMme’s 123.95% and Actinium’s 96.18% gain. On the other hand, Wownero lost 54.05%, making it the most prominent daily loser. It is followed by Tap’s loss of 47.05% and Super Bitcoin’s loss of 46.31%.

Top 10 24-hour Performers (Click to enlarge)

Bottom 10 24-hour Performers (Click to enlarge)

Bitcoin’s market dominance has moved up over one percent since our last report, with its value currently being 66.6%. This value represents a 1.4% difference to the downside than the value it had when we last reported.

Daily Crypto Market Cap Chart

The cryptocurrency sector capitalization has decreased significantly since we last reported, with its current value being $632.90 billion. This represents a $36.72 billion decrease when compared to our previous report.

_______________________________________________________________________

What happened in the past 24 hours?

_______________________________________________________________________

_______________________________________________________________________

Technical analysis

_______________________________________________________________________

Bitcoin

Bitcoin experienced a 5% pullback after the news of a new strain of COVID-19 came out. Of course, Bitcoin was not the only one hit, as all traditional asset classes dipped in the past 24 hours as well. The downturn got stopped at the $22,054 level, and quickly sprung up to the current levels.

As mentioned in our previous daily crypto review, Bitcoin would experience an increase in volume as it exits consolidation below the recent highs, which happened today.

BTC/USD 4-hour chart

While Bitcoin’s daily technicals are tilted towards the bull side, its 4-hour overview is completely neutral. On the other hand, its weekly and monthly overviews are tilted towards the buy-side, but show hints of neutrality.

BTC/USD 1-day Technicals

Technical factors (4-hour Chart):
  • Price is above its 50-period EMA and below its 21-period EMA
  • Price between its bottom and middle Bollinger band
  • RSI is neutral (48.91)
  • Volume is slightly above average
Key levels to the upside          Key levels to the downside

1: $24,315                                 1: $22,054

2: $24,700                                 2: $21,350

3: $25,511                                  3: $19,918

Ethereum

Ethereum has followed Bitcoin to the downside, and lost just over 5% on the day. The second-largest cryptocurrency by market cap fell below the $632 level and attempted to break the $600-$602 support line. However, ETH bulls stopped the downturn, and the cryptocurrency is now consolidating right above this level.

Ethereum’s price movements are pretty tame so far, and traders should pay close attention to Bitcoin and its movement in the near future as Ether seems to follow it almost to the tee.

ETH/USD 4-hour Chart

Ethereum’s daily, weekly and monthly technicals show a strong bullish tilt, while its 4-hour overview is tilted towards the sell-side.

ETH/USD 1-day Technicals

Technical Factors (4-hour Chart):
  • Price is below both its 50-period and its 21-period EMA
  • Price is close to its bottom Bollinger band
  • RSI is heading towards being oversold (37.52)
  • Volume is on slightly above-average levels
Key levels to the upside          Key levels to the downside

1: $632                                     1: $600

2: $675                                     2: $581 

3: $738.5                                   3: $564

Ripple

XRP had a horrible 24 hour trading session as its price crashed on Ripple’s announcement that they will most likely get sued by the SEC. This news brought its price down almost 20%, with it currently trading right above the $0.457 level, which stopped XRP from going down further.

XRP traders should pay attention to further updates on the lawsuit news as well as to any volume increase the cryptocurrency experiences.

XRP/USD 4-hour Chart

XRP’s long-term technicals (weekly and monthly) show a slight tilt towards the buy-side, while its short-term technicals (4-hour and daily) are completely bearish.

XRP/USD 1-day Technicals

Technical factors (4-hour Chart):
  • Its price is currently far below both its 50-period EMA and its 21-period EMA
  • Price slightly below its bottom Bollinger band
  • RSI is in the oversold territory (25.83)
  • Volume has returned to average levels
Key levels to the upside          Key levels to the downside

1: $0.5                                      1: $0.475

2: $0.543                                   2: $457

3: $0.57                                    3: $45

Categories
Crypto Market Analysis

Daily Crypto Review, Dec 21 – Bitcoin Dangerously Close to Making a Sharp Move

The cryptocurrency sector is split between gainers and losers as Bitcoin consolidates right below its all-time high level. Bitcoin is currently trading for $23,825, representing an increase of 1.03% when compared to yesterday’s value. Meanwhile, Ethereum’s price has decreased by 1.42% on the day, while XRP managed to lose 3.20%.

 Daily Crypto Sector Heat Map

Axion gained 3402.38% in the past 24 hours, making it the most prominent daily crypto gainer by far. It is followed by MahaDAO’s 199.69% and Elxis’ 186.79% gain. On the other hand, Golden Ratio Per Liquidity lost 59.64%, making it the most prominent daily loser. It is followed by ALL BEST ICO’s loss of 50.84% and Quras’s loss of 49.42%.

Top 10 24-hour Performers (Click to enlarge)

Bottom 10 24-hour Performers (Click to enlarge)

Bitcoin’s market dominance has moved down almost half a percent since our last report, with its value currently being 65.1%. This value represents a 0.4% difference to the downside than the value it had when we last reported.

Daily Crypto Market Cap Chart

The cryptocurrency sector capitalization has increased since we last reported, with its current value being $669.26 billion. This represents an $18.25billion increase when compared to our previous report.

_______________________________________________________________________

What happened in the past 24 hours?

_______________________________________________________________________

_______________________________________________________________________

Technical analysis

_______________________________________________________________________

Bitcoin

Bitcoin has spent its weekend slowly rising towards the resistance level of its trading channel, which is bound by $22,055 to the downside and $24,315 to the upside. However, The two attempts to break the resistance level and enter the price discovery phase failed, leaving Bitcoin just below $24,315. With volume descending ever since Dec 17, we might expect this consolidation to end with a volume boom and a very sharp move.

While it is yet unknown whether this sharp move will be to the upside or downside, the increase in volume and a strong push towards one side will make it quite clear. Traders can use this momentum to catch a very safe trade.


BTC/USD 2-hour chart

While Bitcoin’s technicals are overall bullish, they either show signs of neutrality or even hints of bearishness. Its daily and monthly overviews have some indications of sellers being present, while its 4-hour and weekly overviews are bullish-neutral.

BTC/USD 1-day Technicals

Technical factors (4-hour Chart):
  • Price is far above both its 50-period and its 21-period EMA
  • Price slightly below its top Bollinger band
  • RSI is close to being overbought (65.90)
  • Volume is decreasing, and trading below the average level
Key levels to the upside          Key levels to the downside

1: $24,315                                 1: $22,054

2: $24,700                                 2: $21,350

3: $25,511                                  3: $19,918

Ethereum

Ethereum has, unlike Bitcoin, descended slowly within its trading range, which is bound by $675 to the upside and $632. The second-largest cryptocurrency by market cap had one strong push towards the downside, which brought its price all the way down to $620 on Dec 20. However, the bulls prevailed, and Ether is now trading above $632 safely.

Ethereum’s price movements seem pretty tame, meaning that its next move will be of larger magnitude. Traders should pay close attention to Bitcoin and its moves in the near future before trading any other cryptocurrency, including Ether.

ETH/USD 2-hour Chart

Ethereum’s technicals are very bullish on all time-frames, with only its weekly overview showing slight neutrality.

ETH/USD 1-day Technicals

Technical Factors (4-hour Chart):
  • Price is far above its 50-period and at its 21-period EMA
  • Price is slightly below its bottom Bollinger band
  • RSI is neutral (52.43)
  • Volume is on slightly above-average levels
Key levels to the upside          Key levels to the downside

1: $675                                     1: $632

2: $738.5                                  2: $600 

3: $817.5                                   3: $581

Ripple

With XRP’s strong push towards the upside ending on Dec 17, the fourth-largest cryptocurrency by market cap has entered another descending channel. The price was slowly dwindling down over the weekend, breaking the $0.57 support level, and then confirming its position below it. The price even went below the $0.543 support at one point, but quickly recovered.

XRP’s volume is currently almost non-existent, and traders should pay attention to any volume spikes if they intend on trading XRP.

XRP/USD 2-hour Chart

XRP’s technicals are quite mixed, but overall tilted slightly towards the buy-side. It’s 4-hour and daily overviews are bullish-neutral, while its weekly overview shows some hints of bearishness. Its monthly overview, however, is completely bullish.

XRP/USD 1-day Technicals

Technical factors (4-hour Chart):
  • Its price is currently between its 50-period EMA and its 21-period EMA
  • Price slightly above its bottom Bollinger band
  • RSI is neutral (48.77)
  • Volume has descended to average levels
Key levels to the upside          Key levels to the downside

1: $0.57                                    1: $0.543

2: $0.597                                   2: $0.5

3: $0.63                                    3: $0.475

Categories
Crypto Market Analysis

BTC/USD Weekly Chart Analysis + Possible Outcomes

In this week’s BTC/USD analysis, we will be taking an in-depth look at the most recent technical formations, as well as look for the possible price outcomes in the following days.

Overview

The crypto sector was nothing short of explosive as Bitcoin pushed past its old all-time highs and reached almost as high as $24,000. The largest cryptocurrency by market cap went into skyrocket mode without facing much resistance until it hit a wall near $23,800. As it failed to break this level twice, it started a consolidation phase.

While Bitcoin’s sentiment is extremely bullish, many analysts call for a pullback and say that the most recent push to the upside is still much overextended. However, Bitcoin is consolidating sideways rather than pulling back. One thing is certain, Bitcoin is preparing for its next move.

Technical factors


Bitcoin is currently in consolidation mode after it hit a wall twice near the $23,800 price level. The price range is getting narrower and narrower as time passes, indicating a strong breakout move out of the current boundaries inevitable. On top of that, Bitcoin’s volume has been steadily declining after the final attempt above $23,777. When it comes to support, Bitcoin’s downside is protected by the 21-period moving average as well as the $22,320 Fib retracement line.

While a move to the downside should be considered healthy, the current price bouncing off of its support levels might be just good enough for BTC to push towards the upside once again.

Likely Outcomes

We can expect three main outcomes for Bitcoin, with the ones starting with an upswing being just slightly more plausible.

  1. Bitcoin’s price can easily shoot up past $23,777 and enter price discovery mode yet again. Not much to say about the target levels there, except that the possible resistance zones might be Fib extensions from the current Fib retracement levels.
  2. Bitcoin’s price is most likely to push towards the upside, hit the all-time high level, and fail to break it, therefore prompting a pullback. In this case, the price will most likely fall below $22,320 and head straight for the $21,420 or even lower (some analysts are calling for a drop below $20,000 and a CME Futures gap fill).
  3. Bitcoin’s price might head straight down and break the $22,320 level, in which case the market will steadily test every single support level that has worked until now.

In any case, a significant increase in volume will be required, and traders should certainly pay attention to it.

Categories
Crypto Market Analysis

Daily Crypto Review, Dec 18 – Bitcoin at $23,000; Crypto Sector Preparing for the Next Move

The majority of the cryptocurrencies ended up in the green as the cryptocurrency sector tried to consolidate after Bitcoin’s price discovery in the all-time high territory. Bitcoin is currently trading for $22.912, representing an increase of 3.96% compared to yesterday’s value. Meanwhile, Ethereum’s price has increased by 0.16% on the day, while XRP managed to gain 3.79%.

 Daily Crypto Sector Heat Map

MobileGo gained 94.96% in the past 24 hours, making it the most prominent daily crypto gainer by far. It is followed by Puriever’s 85.99% and Tokes’ 85.09% gain. On the other hand, Basis Share lost 49.6%, making it the most prominent daily loser. It is followed by 3x Short Litecoin Token’s loss of 46.73% and Force For Fast’s loss of 42.92%.

Top 10 24-hour Performers (Click to enlarge)

Bottom 10 24-hour Performers (Click to enlarge)

Bitcoin’s market dominance has moved up half a percent since our last report, with its value currently being 65.5%. This value represents a 0.5% difference to the upside than the value it had when we last reported.

Daily Crypto Market Cap Chart

The cryptocurrency sector capitalization has increased since we last reported, with its current value being $651.01 billion. This represents a $17.07 billion increase when compared to our previous report.

_______________________________________________________________________

What happened in the past 24 hours?

_______________________________________________________________________

_______________________________________________________________________

Technical analysis

_______________________________________________________________________

Bitcoin

Bitcoin has stopped its price discovery phase as it bounced off the $24,000 level and began consolidating. The largest cryptocurrency by market cap is currently fighting for the $23,000 level, a minor pivot point within a larger range bound by $24,000 to the upside and $22,050 to the downside.

At the moment, the Fib extension sitting at $22,055 is the most likely strong support level, while Bitcoin’s upside is open to new highs if the cryptocurrency passes $24,000, $23,315, and $24,500.

BTC/USD 2-hour chart

Bitcoin’s 4-hour and weekly overview are fully bullish, while its daily and monthly time-frames show slight neutrality on top of the overall bullishness.

BTC/USD 1-day Technicals

Technical factors (4-hour Chart):
  • Price is far above both its 50-period and its 21-period EMA
  • Price slightly below its top Bollinger band
  • RSI is heavily overbought (80.71)
  • Volume is far higher than its average levels
Key levels to the upside          Key levels to the downside

1: $24,315                                 1: $22,054

2: $24,700                                 2: $21,350

3: $25,511                                  3: $19,918

Ethereum

Ethereum has, just like Bitcoin, hit a wall in its price ascension, triggering a pullback from the highs of $675. The second-largest cryptocurrency by market cap quickly fell to its immediate support level, which sits at $632. This level held up nicely, and Ethereum is now on a slow rise after confirming the support level.

An important thing to note is that Ethereum is very far from reaching its all-time high. It might be a good value investment simply because of its potential to increase its price faster than Bitcoin.

ETH/USD 2-hour Chart

Ethereum’s 4-hour and monthly overview are fully bullish, while its daily and weekly time-frames show slight neutrality on top of the overall bullishness.

ETH/USD 1-day Technicals

Technical Factors (4-hour Chart):
  • Price is far above both its 50-period and its 21-period EMAs
  • Price is between its middle and top Bollinger band
  • RSI has barely left the overbought territory (67.29)
  • Volume is much higher than its weekly average but is descending
Key levels to the upside          Key levels to the downside

1: $675                                     1: $632

2: $738.5                                  2: $600 

3: $817.5                                   3: $581

Ripple

XRP was the cryptocurrency that experienced the largest gains out of the three cryptocurrencies we cover daily. The fourth-largest cryptocurrency by market cap couldn’t break a high of $0.597 with conviction (though the price briefly went as high as $0.656), which triggered a correction to its $0.57 support level. After confirming this level as strong support, XRP continued its path towards the upside and slowly started increasing in price. It is currently contesting the $0.597 level once again.


XRP/USD 2-hour Chart

XRP’s 4-hour and monthly overview are fully bullish, while its daily and weekly time-frames show slight neutrality on top of the overall bullishness.

XRP/USD 1-day Technicals

Technical factors (4-hour Chart):
  • Its price is currently above both its 50-period EMA and its 21-period EMA
  • Price slightly below its top Bollinger band
  • RSI is nearing the overbought territory (63.71)
  • Volume is well above its average level, thought descending
Key levels to the upside          Key levels to the downside

1: $0.597                                    1: $0.57

2: $0.63                                    2: $0.543

3: $0.66                                     3: $0.5

Categories
Crypto Market Analysis

Daily Crypto Review, Dec 17 – BTC Reaches a New ATH at $22k; XRP Skyrockets as it Breaks its Descending Channel

The cryptocurrency sector experienced an overall major gain as Bitcoin reached its new all-time high. Bitcoin is currently trading for $22.095, representing an increase of 13.82% compared to yesterday’s value. Meanwhile, Ethereum’s price has increased by 9.69% on the day, while XRP managed to gain a whopping 23.35%.

 Daily Crypto Sector Heat Map

Puriever gained 238.59% in the past 24 hours, making it the most prominent daily crypto gainer by far. It is followed by Combine.finance’s 159.58% and Amun Bitcoin 3x Daily Shorts’ 146.94% gain. On the other hand, BigGame lost 82.62%, making it the most prominent daily loser. It is followed by GNY’s loss of 75,95% and Hush’s loss of 61.30%.

Top 10 24-hour Performers (Click to enlarge)

Bottom 10 24-hour Performers (Click to enlarge)

Bitcoin’s market dominance has moved up over a whole percent since our last report, with its value currently being 65%. This value represents a 1.1% difference to the upside than the value it had when we last reported.

Daily Crypto Market Cap Chart

The cryptocurrency sector capitalization has increased drastically since we last reported, with its current value being $634.94 billion. This represents a whopping $70.94 billion increase when compared to our previous report.

_______________________________________________________________________

What happened in the past 24 hours?

_______________________________________________________________________

_______________________________________________________________________

Technical analysis

_______________________________________________________________________

Bitcoin

Bitcoin has had quite an amazing day, as its price skyrocketed to new all-time highs. The largest cryptocurrency by market cap reached price discovery mode as its price topped at $22,400. While there are no set resistance levels at the moment, we can use Fib retracement extensions to determine where they could form.

At the moment, the Fib extensions sitting at $21,350 and $22,055 are the best contenders to act as support levels to Bitcoin’s eventual downturn.


BTC/USD 4-hour chart

Bitcoin’s daily and weekly overview are fully bullish, while its 4-hour and monthly time-frames show slight neutrality on top of the overall bullishness.

BTC/USD 1-day Technicals

Technical factors (4-hour Chart):
  • Price is far above both its 50-period and its 21-period EMA
  • Price slightly above its top Bollinger band
  • RSI is heavily overbought (86.76)
  • Volume is far higher than its average levels
Key levels to the upside          Key levels to the downside

1: $24,315                                 1: $22,054

2: $24,700                                 2: $21,350

3: $25,511                                  3: $19,918

Ethereum

Ethereum followed the extremely bullish sentiment caused by Bitcoin’s push, reaching a price of $625 before hitting a sell wall. The second-largest cryptocurrency by market cap has held these levels, and is currently consolidating above the $632 level.

An important thing to note is that, while Bitcoin has reached its ATH, Ethereum is very far from it. Ethereum might be a good value investment simply due to its potential to possibly reach towards higher levels on account of pushing towards its ATH.

ETH/USD 4-hour Chart

While Ethereum shows overall bullish sentiment on all time-frames, every time-frame except the monthly time-frame shows slight neutrality.

ETH/USD 1-day Technicals

Technical Factors (4-hour Chart):
  • Price is far above both its 50-period and its 21-period EMAs
  • Price is at its top Bollinger band
  • RSI is heavily overbought (78.20)
  • Volume is much higher than its weekly average
Key levels to the upside          Key levels to the downside

1: $675                                     1: $636.5

2: $738.5                                  2: $632 

3: $817.5                                   3: $600

Ripple

Unlike most days where XRP is having larger moves to the downside and smaller moves to the upside compared to BTC and ETH, the roles are reversed this time. The fourth-largest cryptocurrency by market cap has gained almost 25% on the day as its price bounced off of the lower line of the descending channel, and pushed towards the upside, reaching as high as $0.583 before starting its consolidation.

XRP is now trading within a range, bound by the $0.57 resistance and $0.543 support levels.


XRP/USD 4-hour Chart

XRP has changed its sentiment to overall bullishness, with its monthly time-frame showing full tilt towards the buy-side, and the rest of the time-frames showing some neutrality or hints of bearishness remaining.

XRP/USD 1-day Technicals

Technical factors (4-hour Chart):
  • Its price is currently above both its 50-period EMA and its 21-period EMA
  • Price slightly below its top Bollinger band
  • RSI is nearing the overbought territory (61.30)
  • Volume is well above its average level
Key levels to the upside          Key levels to the downside

1: $0.57                                     1: $0.543

2: $0.597                                    2: $0.5

3: $0.63                                     3: $0.475

Categories
Crypto Market Analysis

Daily Crypto Review, Dec 16 – XRP Getting Crushed; BTC and ETH Stuck within a Range

The cryptocurrency sector was mostly stable today as Bitcoin kept within its trading range. Bitcoin is currently trading for $19,393, representing an increase of 1.13% compared to yesterday’s value. Meanwhile, Ethereum’s price has increased by 0.10% on the day, while XRP managed to lose a whopping 8.56%.

 Daily Crypto Sector Heat Map

XcelToken Plus gained 263.82% in the past 24 hours, making it the most prominent daily crypto gainer by far. It is followed by Amun Bitcoin 3x Daily Long’s 161.53% and rbase.finance’s 129.84% gain. On the other hand, Maximine Coin lost 99.42%, making it the most prominent daily loser. It is followed by STEM CELL COIN’s loss of 97.69% and Patron’s loss of 89.45%.

Top 10 24-hour Performers (Click to enlarge)

Bottom 10 24-hour Performers (Click to enlarge)

Bitcoin’s market dominance has moved up since our last report, with its value currently being 63.9%. This value represents a 0.4% difference to the upside than the value it had when we last reported.

Daily Crypto Market Cap Chart

The cryptocurrency sector capitalization has decreased slightly since we last reported, with its current value being $564.0 billion. This represents a $4.20 billion decrease when compared to our previous report.

_______________________________________________________________________

What happened in the past 24 hours?

_______________________________________________________________________

_______________________________________________________________________

Technical analysis

_______________________________________________________________________

Bitcoin

Bitcoin has continued trading within a range between $19,100 and $19,570, possibly hitting a wall of profit-taking institutional traders. Despite the overall bullishness of the market, the largest cryptocurrency by market cap failed to break the $19,666 level or even reach it. This is because of the increasing number of BTC Whales (holders of 10,000 to 100,000 Bitcoin) leaving the market and taking profit as the price approaches the $20,000 mark.

The sheer amount of resistance hovering above $19,500 will make it quite hard for Bitcoin bulls to push towards the all-time highs. In case the aforementioned push doesn’t happen, we can expect a possible dip towards $18,000.

BTC/USD 4-hour chart

Bitcoin’s overview on all time-frames is bullish, with its weekly time-frame being the only one completely bullish. The rest of the time-frames are slightly tilted to the neutral side.

BTC/USD 1-day Technicals

Technical factors (4-hour Chart):
  • Price is above its 50-period and slightly above its 21-period EMA
  • Price is between its middle and top Bollinger band
  • RSI is neutral (60.06)
  • Volume is average
Key levels to the upside          Key levels to the downside

1: $19,100                                 1: $18,600

2: $19,666                                 2: $18,190

3: $20,000                                  3: $17,800

Ethereum

Ethereum has hit a sell wall as well, stopping its upward price movement just below $600 for the third time in 3 days. The second-largest cryptocurrency by market cap is stuck between $581 to the downside and $600 to the upside, which is a very narrow range for long-term trading.

Ethereum will most likely experience a sharp break out of the current range, creating a potential safe trade with set parameters.

ETH/USD 4-hour Chart

Ethereum’s overview on all time-frames is bullish, with its daily time-frame being the only one completely bullish. The rest of the time-frames are slightly tilted to the neutral side.

ETH/USD 1-day Technicals

Technical Factors (4-hour Chart):
  • Price is slightly above its 50-period and at its 21-period EMAs
  • Price is at its middle Bollinger band
  • RSI is neutral (54.03)
  • Volume is slightly below average when compared to the previous week
Key levels to the upside          Key levels to the downside

1: $600                                     1: $581

2: $632                                     2: $565 

3: $636.5                                   3: $545

Ripple

XRP has continued its downturn, this time breaking the crucial $0.475 level. Its price has steadily decreased ever since Dec 1, when it could not break $0.683. This steady descent has created a downtrend, which many analysts think is the death of XRP’s price.

However, there is still hope for XRP. Some analysts believe that this is the 4th of 5 waves in a pattern that XRP started creating on Aug 20 and that the next wave will start an uptrend that will propel its price above $1.

XRP/USD 4-hour Chart

XRP’s longer-term technicals are tilted towards the buy-side, while its short-term technicals are tilted towards the sell-side. While its 4-hour time-frame is completely bearish, its daily overview is slightly more neutral.

XRP/USD 1-day Technicals

Technical factors (4-hour Chart):
  • Its price is currently well below both its 50-period EMA and its 21-period EMA
  • Price is at its bottom Bollinger band
  • RSI is close to the oversold territory (31.25)
  • Volume is well below its average level
Key levels to the upside          Key levels to the downside

1: $0.5                                      1: $0.475

2: $0.543                                   2: $0.45

3: $0.57                                    3: $0.425

Categories
Crypto Market Analysis

Daily Crypto Review, Dec 15 – Bitcoin Whales Stopping the Push Towards $20k; XRP on the Downturn

The majority of the cryptocurrency sector ended up being in the slight green since we last reported, with Bitcoin trying to reach the all-time highs (though so-far unsuccessfully). Bitcoin is currently trading for $19,106, representing an increase of 0.15% compared to yesterday’s value. Meanwhile, Ethereum’s price has decreased by 0.32% on the day, while XRP managed to lose 2.97%.

 Daily Crypto Sector Heat Map

Mandi Token gained 175.35% in the past 24 hours, making it the most prominent daily crypto gainer by far. It is followed by yTSLA Finance’s 169.53% and DefHold’s 129.84% gain. On the other hand, DistX lost 98.32%, making it the most prominent daily loser. It is followed by AC Index’s loss of 94.05% and YXO’s loss of 43.16%.

Top 10 24-hour Performers (Click to enlarge)

Bottom 10 24-hour Performers (Click to enlarge)

Bitcoin’s market dominance has moved up very slightly since our last report, with its value currently being 63.5%. This value represents a 0.2% difference to the upside compared to the value it had when we last reported.

Daily Crypto Market Cap Chart

The cryptocurrency sector capitalization has increased since we last reported, with its current value being $569.80 billion. This represents a $9.01 billion increase when compared to our previous report.

_______________________________________________________________________

What happened in the past 24 hours?

_______________________________________________________________________

_______________________________________________________________________

Technical analysis

_______________________________________________________________________

Bitcoin

Bitcoin had quite an interesting day as it (at one point) tried to push towards the all-time highs, or at least towards its next resistance level (sitting at $19,666). However, the sheer resistance near the $20k level was immense, and the largest cryptocurrency by market cap dipped to its immediate support level ($19,100), which is where it’s at right now.

The data provided by various sources point to Bitcoin whales blocking the way towards and past $20k, despite all the bullish sentiment currently surrounding the cryptocurrency.


BTC/USD 4-hour chart

Bitcoin’s overview on all time-frames is fully bullish, with its monthly time-frame being slightly more tilted to the neutral side than the rest.

BTC/USD 1-day Technicals

Technical factors (4-hour Chart):
  • Price is above its 50-period and slightly above its 21-period EMA
  • Price is near its middle Bollinger band
  • RSI is neutral (55.33)
  • Volume is average when compared to the past week
Key levels to the upside          Key levels to the downside

1: $19,100                                 1: $18,600

2: $19,666                                 2: $18,190

3: $20,000                                  3: $17,800

Ethereum

Ethereum was in the same boat as Bitcoin for the past couple of days, with its price movement mirroring Bitcoin’s. Ether tried to move towards the $600 mark, but got stopped out just below it, triggering a pullback to its immediate support level ($581). However, its downside is well-guarded, both by the $581 support level and the 4-hour 21-period moving average.

Ethereum will most likely continue mirroring Bitcoin’s moves in the short future, meaning that traders should either focus on trading Bitcoin or pay close attention to its movements while trading Ether.

ETH/USD 4-hour Chart

Ethereum’s overview on all time-frames is fully bullish, with its weekly time-frame being slightly more tilted to the neutral side than the rest.

ETH/USD 1-day Technicals

Technical Factors (4-hour Chart):
  • Price is slightly above both its 50-period and 21-period EMAs
  • Price is near its middle Bollinger band
  • RSI is neutral (53.74)
  • Volume is slightly below average when compared to the previous week
Key levels to the upside          Key levels to the downside

1: $600                                     1: $581

2: $632                                     2: $565 

3: $636.5                                   3: $545

Ripple

XRP is one of the cryptocurrencies that rarely mirrors Bitcoin’s movements, and that was the case in the past 24 hours as well. However, the fact that its price doesn’t mirror the largest cryptocurrency was bad news lately. XRP’s price continued its slow descent, this time breaking the $0.5 mark to the downside. At one point, there was an attempt to regain this level, which got shut down pretty quickly.

While the overall crypto sector is surrounded by bullish sentiment, XRP is looking quite bearish in the short-term. Shorting the fourth-largest cryptocurrency by market cap can be a valid trading strategy, simply due to its consistency going down in recent days.

XRP/USD 4-hour Chart

XRP’s longer-term technicals are completely bullish, while its daily overview is slightly more tilted towards neutrality. Its 4-hour time-frame, however, is slightly tilted towards the sell-side.

XRP/USD 1-day Technicals

Technical factors (4-hour Chart):
  • Its price is currently below its 50-period EMA and slightly below its 21-period EMA
  • Price is between its middle and bottom Bollinger band
  • RSI is neutral (37.98)
  • Volume is well below its average level
Key levels to the upside          Key levels to the downside

1: $0.5                                      1: $0.475

2: $0.543                                   2: $0.45

3: $0.57                                    3: $0.425

Categories
Crypto Market Analysis

Daily Crypto Review, Dec 14 – BTC and ETH Consolidating After A Bull Rally; XRP Left in the Dust

The majority of the cryptocurrency sector ended up in the green as Bitcoin spent the weekend regaining the value it lost after failing to break its all-time high with confidence. Bitcoin is currently trading for $19,144, representing an increase of 1.69% compared to yesterday’s value. Meanwhile, Ethereum’s price has increased by 3.61% on the day, while XRP managed to gain 3.77%.

 Daily Crypto Sector Heat Map

BDCC Bitica COIN gained 229.29% in the past 24 hours, making it the most prominent daily crypto gainer by far. It is followed by Ethereum Lightning’s 223.18% and Nuggets’ 190.36% gain. On the other hand, rbase.finance lost 72.18%, making it the most prominent daily loser. It is followed by COIL’s loss of 48.85% and SBank’s loss of 40.65%.

Top 10 24-hour Performers (Click to enlarge)

Bottom 10 24-hour Performers (Click to enlarge)

Bitcoin’s market dominance has moved up half a percent since we last reported, with its value currently being 63.3%. This value represents a 0.5% difference to the upside compared to the value it had when we last reported.

Daily Crypto Market Cap Chart

The cryptocurrency sector capitalization has increased significantly over the weekend, with its current value being $560.79 billion. This represents a $31.22 billion increase when compared to our previous report.

_______________________________________________________________________

What happened in the past 24 hours?

_______________________________________________________________________

_______________________________________________________________________

Technical analysis

_______________________________________________________________________

Bitcoin

Bitcoin has been on fire this weekend, with its price skyrocketing from its recent lows. The uptrend that started on Dec 11 brought its price from $17,600 all the way up to $19,400 before starting to consolidate. The steep ascending trend it created was unsustainable in the long run, so Bitcoin left it and continued trading sideways just above $19,100. The largest cryptocurrency by market cap is currently fighting for this level, with the previous five 4-hour candles holding above the support.

BTC/USD 4-hour chart

Bitcoin’s daily and monthly technicals show slight signs of neutrality on top of its overall bullishness. On the other hand, its 4-hour and weekly technicals are completely bullish.

BTC/USD 1-day Technicals

Technical factors (4-hour Chart):
  • Price is above both its 50-period and 21-period EMAs
  • Price is between its middle and top Bollinger band
  • RSI is neutral (59.17)
  • Volume is slightly below the average level
Key levels to the upside          Key levels to the downside

1: $19,100                                 1: $18,600

2: $19,666                                 2: $18,190

3: $20,000                                  3: $17,800

Ethereum

Ethereum has followed Bitcoin’s footsteps and created its own ascending channel, in which it moved from Dec 11 until Dec 13. The second-largest cryptocurrency by market cap has left this channel and started its own consolidation phase right above the $581 support level.

Ethereum’s moves seem like a mirror to Bitcoin’s moves, with slightly more or less intensity. Traders should be extremely careful of sudden moves Bitcoin can make that could disrupt their Ethereum trades.

ETH/USD 4-hour Chart

Ethereum’s 4-hour, daily, and weekly technicals overall bullish but show signs of neutrality or even some bearish indicators. On the other hand, its monthly technicals are completely tilted towards the buy-side.

ETH/USD 1-day Technicals

Technical Factors (4-hour Chart):
  • Price is above both its 50-period and 21-period EMAs
  • Price is between its middle and top Bollinger band
  • RSI is starting to descend after being close to overbought (58.72)
  • Volume is average when compared to the previous week
Key levels to the upside          Key levels to the downside

1: $600                                     1: $581

2: $632                                     2: $565 

3: $636.5                                   3: $545

Ripple

XRP performed much worse than Bitcoin and Ethereum over the weekend, with its short-term outlook being quite bearish. The fourth-largest cryptocurrency by market cap ended up losing $13.11% of its value week-over-week, with its price currently sitting at the $0.5 level.

XRP is currently fighting to stay above the $0.5 level, with its past four 4-hour candles managing to do this. Traders may be able to catch a trade in either direction when XRP confirms its position above/below $0.5 on increased volume.

XRP/USD 4-hour Chart

XRP’s 4-hour and daily overviews are heavily tilted towards the sell-side but still show some neutral indicators. Its longer-term technicals, though, are completely bullish.

XRP/USD 1-day Technicals

Technical factors (4-hour Chart):
  • Its price is currently below both its 50-period EMA and its 21-period EMA
  • Price is between its middle and bottom Bollinger band
  • RSI is neutral (37.98)
  • Volume is slightly below the average level
Key levels to the upside          Key levels to the downside

1: $0.5435                                 1: $0.5

2: $0.57                                     2: $0.475

3: $0.6                                      3: $0.45

Categories
Crypto Market Analysis

BTC/USD Weekly Chart Analysis + Possible Outcomes

In this week’s BTC/USD analysis, we will be taking an in-depth look at the most recent technical formations, as well as look for the possible short-term price outcomes.

Overview

Bitcoin has had quite a volatile week experienced yet another steep decrease in price as a continuation of the bear retracement after the cryptocurrency couldn’t post new all-time highs with confidence. However, the largest cryptocurrency by market cap has recovered from the decline in a matter of days, with its price over $19,000 once again.

While Bitcoin’s fundamentals only grew stronger as more and more institutional investors acknowledge it as a competitor to gold. This trend of large public companies investing in the best-known cryptocurrency has been seen throughout 2020, and many say that this is the sole reason for the current Bitcoin’s run.

Technical factors


Bitcoin is currently in a steep upwards-facing trend, which brought its price from $17,600 all the way to $19,000. While the channel is way too steep to be considered a long-term option, Bitcoin has the option to follow it for a little bit more, possibly riding the way up to the $19,666 major resistance (and a previous all-time high on Bistamp). This will most likely be the pivot point for Bitcoin, which will decide if it will try to tackle the levels above $20,000 or stay below it and seek support near $19,100.

Likely Outcomes

Bitcoin’s currently sending out very bullish signals, but we included a slightly bearish scenario as well, just to make sure all bases are covered.

1: In case Bitcoin heads further up, its price will most likely stop at the major pivot point, which sits at $19,666. This level is the all-time high from 2017 and is a major resistance level. From here, Bitcoin bulls will have to decide whether they will push towards the upside or remain below this level:

  • In case that the price moves further up, its next possible resistance level (there isn’t much resistance above $20,000, so all possible resistance levels will be extensions of the Fib retracements) is most likely to be sitting at around $20,750.
  • In case the price decides to stay below $19,666, we can expect it to move down and look for support at $19,100 or $18,600 levels.

2: If Bitcoin breaks the ascending channel early and pushes towards the downside, its first strong support level is $19,100 (which it will inevitably break if it pushes down and breaks the channel) and then $18,600.

Entering any short trades could be quite risky at the moment due to the bullish momentum Bitcoin has gathered. However, trading above $20,000 is equally as risky as Bitcoin would be entering a zone with no set resistance and support levels. However, entering long traders is certainly a safer option at the moment.

Categories
Crypto Market Analysis

Daily Crypto Review, Dec 11 – Bitcoin Fighting for $18,000; Crypto Market in the Red

The majority of the cryptocurrency sector has ended up being in the red as Bitcoin spent most of the day under the $18,000 level. Bitcoin is currently trading for $17,920, representing a decrease of 2.91% compared to our last report. Meanwhile, Ethereum’s price has decreased by 4.30% on the day, while XRP managed to lost 2.85%.

 Daily Crypto Sector Heat Map

Freedom Reserve gained 950.51% in the past 24 hours, making it the most prominent daily crypto gainer by far. It is followed by LBRY Credits’s 336.6% and Seigniorage Shares’ 117.99% gain. On the other hand, Basis Cash lost 87.95%, making it the most prominent daily loser. It is followed by xBTC’s loss of 55.09% and IterationSyndicate’s loss of 44.55%.

Top 10 24-hour Performers (Click to enlarge)

Bottom 10 24-hour Performers (Click to enlarge)

Bitcoin’s market dominance has moved up less than half a percent since we last reported, with its value currently being 62.8%. This value represents a 0.2% difference to the upside compared to the value it had when we last reported.

Daily Crypto Market Cap Chart

The cryptocurrency sector capitalization has decreased in the past 24 hours, with its current value being $528.97 46.31 billion. This represents a $17.34 billion decrease when compared to our previous report.

_______________________________________________________________________

What happened in the past 24 hours?

_______________________________________________________________________

_______________________________________________________________________

Technical analysis

_______________________________________________________________________

Bitcoin

Bitcoin has spent most of the day in a price descent after it failed to break the $18,600 mark. BTC bulls tried to pick the price back up but failed, which has caused another mini-dip, which brought the price as low as $17,721 on Bitstamp. The $17,780 level has proven itself as great support once again, and Bitcoin is now trading in a range between it and $18,190.

Due to the amount of support and resistance levels in a narrow price range Bitcoin currently has, a push towards either side could be a possible safe trade to catch.

BTC/USD 2-hour chart

Bitcoin’s short-term technicals are tilted towards the sell-side but show slight signs of neutrality. Its long-time technicals, however, are completely bullish.

BTC/USD 1-day Technicals

Technical factors (4-hour Chart):
  • Price is below both its 50-period and 21-period EMAs
  • Price is close to its bottom Bollinger band
  • RSI is dipping towards being oversold (36.77)
  • Volume is slightly above the average level
Key levels to the upside          Key levels to the downside

1: $18,190                                 1: $17,780

2: $18,600                                 2: $17,500

3: $18,790                                  3: $17,200

Ethereum

Ethereum has quickly stopped in its tracks towards $600 after hitting a brick wall at $581. The rebound pulled its price back below $565, as well as $545, which it is now fighting for. The fact that Ethereum is in a short-term bear run is confirmed by higher volume candles during price drops than during price spikes.

Our call from yesterday regarding Ethereum’s dip after dropping below $565 turned out as predicted. Traders should pay attention to Bitcoin’s movements and the ascending (red) trend line when trading Etheruem.

ETH/USD 2-hour Chart

Ethereum’s short-term technicals are tilted towards the sell-side but show slight neutral signs. However, its long-time technicals are bullish, with its weekly overview being slightly neutral than its monthly overview.

ETH/USD 1-day Technicals

Technical Factors (4-hour Chart):
  • Price is below both its 50-period and 21-period EMAs
  • Price is slightly above its bottom Bollinger band
  • RSI is dipping towards oversold territory (36.18)
  • Volume is slightly above the average level
Key levels to the upside          Key levels to the downside

1: $565                                     1: $545

2: $581                                      2: $525 

3: $600                                      3: $510

Ripple

XRP followed the rest of the crypto sector and made a price dip, which brought its price to the $0.543 level, which held up quite nicely. Its price is now recovering and consolidating between $0.543 and $0.57, with no signs of potential movement to either side.

XRP traders should pay attention to Bitcoin’s price movement, as most cryptocurrencies follow the general market direction it sets.

XRP/USD 2-hour Chart

XRP’s 4-hour and daily overviews show confusing signs, with some indicators being bullish and some bearish. Its long-term technicals are, however, completely bullish.

XRP/USD 1-day Technicals

Technical factors (4-hour Chart):
  • The price is currently below both its 50-period EMA and its 21-period EMA
  • Price is slightly below its middle Bollinger band
  • RSI is neutral (41.75)
  • Volume is slightly above the average level
Key levels to the upside          Key levels to the downside

1: $0.57                                   1: $0.5435

2: $0.6                                       2: $0.5

3: $0.63                                    3: $0.475

Categories
Crypto Market Analysis

Daily Crypto Review, Dec 10 – Bitcoin Bulls Back in the Game as Sector Recovers From The Dip

The cryptocurrency sector is mostly green as cryptocurrencies took the day to recover from the sudden drop that occurred on Dec 8. Bitcoin is currently trading for $18,411, representing an increase of 1.25% compared to our last report. Meanwhile, Ethereum’s price has increased by 3.37% on the day, while XRP managed to gain 4.66%.

 Daily Crypto Sector Heat Map

WinCash gained 207.65% in the past 24 hours, making it the most prominent daily crypto gainer by far. It is followed by Nyan V2’s 181.02% and Pamp Network’s 172.94% gain. On the other hand, DMme lost 68.63%, making it the most prominent daily loser. It is followed by ALL BEST ICO’s loss of 64.69% and Moonday Finance’s loss of 54.48%.

Top 10 24-hour Performers (Click to enlarge)

Bottom 10 24-hour Performers (Click to enlarge)

Bitcoin’s market dominance has moved to the downside just under half a percent since we last reported, with its value currently being 62.6%. This value represents a 0.4% difference to the downside compared to the value it had when we last reported.

Daily Crypto Market Cap Chart

The cryptocurrency sector capitalization has increased significantly in the past 24 hours, with its current value being $546.31 billion. This represents a $10.23 billion increase when compared to our previous report.

_______________________________________________________________________

What happened in the past 24 hours?

_______________________________________________________________________

_______________________________________________________________________

Technical analysis

_______________________________________________________________________

Bitcoin

Bitcoin has spent the day slowly moving up after a sharp price descent, which brought it to $18,000. After establishing itself above $18,190, Bitcoin even tried to push further up above $18,600 but failed almost instantly, making its price go back to previous levels.

We want to point out (once again) Micheal van de Poppe’s call of a large CME gap looming between $18,275 and $16,995.

Due to the amount of support/resistance levels Bitcoin currently has, any push towards either the upside or downside could be a possible safe trade in the same direction.

BTC/USD 2-hour chart

Bitcoin’s daily, weekly, and monthly technicals are completely tilted towards the buy-side and show no bearish signs. Its 4-hour overview, however, is completely bearish.

BTC/USD 1-day Technicals

Technical factors (4-hour Chart):
  • Price is below both its 50-period and 21-period EMAs
  • Price is between its middle and bottom Bollinger band
  • RSI is has recovered from being oversold (43.38)
  • Volume is slightly above average
Key levels to the upside          Key levels to the downside

1: $18,600                                 1: $18,190

2: $18,790                                 2: $17,780

3: $19,000                                  3: $17,200

Ethereum

Ethereum has not only recovered from its drop to $530, where it hit the ascending (red) trend line but pushed back towards $600. Even though the price is not yet ready to tackle this resistance level, it has made an attempt to break the $581 level but failed and returned to the $565 one.

Ethereum traders should pay attention to whether the cryptocurrency will end up above or below $565, which may be an indicator of its short-term movement. Traders should also pay attention to Bitcoin’s movement whenever taking a trade with Ethereum.

ETH/USD 2-hour Chart

Ethereum’s daily and monthly technicals are completely tilted towards the buy-side and show no signs of bearishness. However, its 4-hour overview is completely bearish, while its weekly overview is bullish but shows slight neutrality as well.

ETH/USD 1-day Technicals

Technical Factors (4-hour Chart):
  • Price is below both its 50-period and 21-period EMAs
  • Price is slightly below its middle Bollinger band
  • RSI has recovered from being in the oversold territory (42.83)
  • Volume is slightly above average
Key levels to the upside          Key levels to the downside

1: $565                                     1: $550

2: $581                                      2: $525 

3: $600                                      3: $510

Ripple

XRP made a sharp (to the upside) price recovery as well, with its price pushing past $0.5435, as well as its $0.57 resistance (now support) levels. The fourth-largest cryptocurrency by market cap even tried to break $0.6 but got shut down swiftly. Its price is now consolidating slightly above $0.57 and showing no signs of potential dips.

XRP traders (finally) have the option to trade this cryptocurrency after several days of close-to-no volatility. Keeping track of Bitcoin’s movements when trading XRP is a must, as any change in Bitcoin’s price could change the outlook of the market as a whole.

XRP/USD 2-hour Chart

XRP’s daily, weekly, as well as monthly technicals, are completely tilted towards the buy-side and show no signs of neutrality or bearishness. Its 4-hour overview, on the other hand, is bearish with slight signs of neutrality.

XRP/USD 1-day Technicals

Technical factors (4-hour Chart):
  • The price is currently slightly below both its 50-period EMA, as well as its 21-period EMA
  • Price is slightly below its middle Bollinger band
  • RSI is neutral and recovered from being oversold (47.26)
  • Volume is slightly above average
Key levels to the upside          Key levels to the downside

1: $0.57                                   1: $0.5435

2: $0.6                                       2: $0.5

3: $0.63                                    3: $0.475

Categories
Crypto Market Analysis

Daily Crypto Review, Dec 09 – Bitcoin Drops to $18,000; Crypto Market Tumbles

The cryptocurrency sector has dropped significantly as bears took over the market. Bitcoin is currently trading for $18,315, representing a decrease of 4.50% compared to our last report. Meanwhile, Ethereum’s price has decreased by 6.17% on the day, while XRP managed to lose 7.73%.

 Daily Crypto Sector Heat Map

ALL BEST ICO gained 19,990.71% in the past 24 hours, making it the most prominent daily crypto gainer by far. It is followed by COIL’s 151.88% and Amun Bitcoin 3x Daily Short’s 112.92% gain. On the other hand, Monavale lost 54.51%, making it the most prominent daily loser. It is followed by KIMCHI.finance’s loss of 52.82% and Iteration Syndicate’s loss of 51.70%.

Top 10 24-hour Performers (Click to enlarge)

Bottom 10 24-hour Performers (Click to enlarge)

Bitcoin’s market dominance has moved to the upside just under half a percent since we last reported, with its value currently being 63%. This value represents a difference of 0.4% to the upside when compared to yesterday’s value.

Daily Crypto Market Cap Chart

The crypto sector capitalization has decreased significantly in the past 24 hours, with its current value being $536.08 billion. This represents a $32.76 billion decrease when compared to our previous report.

_______________________________________________________________________

What happened in the past 24 hours?

_______________________________________________________________________

_______________________________________________________________________

Technical analysis

_______________________________________________________________________

Bitcoin

After spending the past couple of days in a very narrow range, Bitcoin has finally made a move as bears took over the market. The price went down rapidly and reached as low as $18,000 at one point, but then went slightly above this crucial level.

While Bitcoin is safe from breaking $18,000 to the downside at the moment, Micheal van de Poppe pointed out that a large CME gap is looming. The gap ranges from $18,275 to $16,995.

Lastly, the Hash Ribbons indicator has posted a buy signal, giving long-term investors the green light to invest in Bitcoin. This indicator has proven itself one of the best RoI indicators for Bitcoin when it comes to long-term investing.

BTC/USD 4-hour chart

Bitcoin’s long-term technicals (weekly and monthly) are completely tilted towards the buy-side, while its daily overview is still bullish but showing slight signs of neutrality. On the other hand, its 4-hour overview is completely bearish.

BTC/USD 1-day Technicals

Technical factors (4-hour Chart):
  • Price is currently below both its 50-period EMA and its 21-period EMA
  • Price is at its bottom Bollinger band
  • RSI is close to being oversold (31.73)
  • Volume is average
Key levels to the upside          Key levels to the downside

1: $18,600                                 1: $18,190

2: $18,790                                 2: $17,780

3: $19,000                                  3: $17,200

Ethereum

Ethereum wasn’t immune to the downturn either, with its price dropping from the sub-$600 levels all the way down to just above $550. Unlike Bitcoin, however, there are no CME gaps to worry about, and Ethereum seems quite stable above $550.

The only thing to worry about when anticipating Ether’s next price move is Bitcoin’s movement. At the moment, Bitcoin is dictating all consolidations, as well as large moves in either direction.

ETH/USD 4-hour Chart

Ethereum’s monthly overview shows a full tilt towards the buy-side, while its daily and weekly overviews still show some signs of neutrality. On the other hand, its 4-hour overview is bearish but shows slight signs of neutrality.

ETH/USD 1-day Technicals

Technical Factors (4-hour Chart):
  • The price is currently below both its 50-period EMA and its 21-period EMA
  • Price is at its bottom Bollinger band
  • RSI is in the oversold territory (28.61)
  • Volume is above average
Key levels to the upside          Key levels to the downside

1: $565                                     1: $550

2: $582                                     2: $525 

3: $600                                      3: $510

Ripple

The fourth-largest cryptocurrency by market cap moved to the downside as well, with its $0.545 support level holding up as the last-resort support. XRP is currently stable and trading between $0.545 to the downside and $0.571 to the upside, with its price, seemingly creating a double bottom (today and on Dec 5).

XRP traders might want to (still) refrain from trading XRP simply due to the disbalance of the risk and reward, as well as due to its low volatility.

XRP/USD 4-hour Chart

XRP’s longer weekly and monthly time-frames show complete bullishness, while its 4-hour overview is completely bearish. Its daily overview is still bullish but shows some signs of neutrality or even some bearishness.

XRP/USD 1-day Technicals

Technical factors (4-hour Chart):
  • The price is currently below both its 50-period EMA, as well as its 21-period EMA
  • Price is at its bottom Bollinger band
  • RSI is close to being oversold (34.36)
  • Volume is slightly above average
Key levels to the upside          Key levels to the downside

1: $0.571                                   1: $0.545

2: $0.6                                       2: $0.5

3: $0.63                                    3: $0.475

Categories
Crypto Market Analysis

Daily Crypto Review, Dec 08 – BTC, ETH and XRP Preparing for a Big Move; Crypto Sector in Consolidation Mode

The cryptocurrency sector has spent the past 24, mostly consolidating, as it failed to reach past its resistance levels on Monday. Bitcoin is currently trading for $19,180, representing a decrease of 0.65% compared to our last report. Meanwhile, Ethereum’s price has decreased by 1.14% on the day, while XRP managed to lose 1.65%.

 Daily Crypto Sector Heat Map

Prophet gained 358.97% in the past 24 hours, making it the most prominent daily crypto gainer. It is closely followed by Seigniorage Shares’ 344.54% and xBTC’s 340.23% gain. On the other hand, CryptoBet lost 95.85%, making it the most prominent daily loser. It is followed by Semux’s loss of 90.60% and Bitball Nyan v2’s loss of 51.05%.

Top 10 24-hour Performers (Click to enlarge)

Bottom 10 24-hour Performers (Click to enlarge)

Bitcoin’s market dominance has moved to the upside over half a percent since we last reported, with its value currently being 62.6%. This value represents a difference of 0.6% to the upside when compared to yesterday’s value.

Daily Crypto Market Cap Chart

The crypto sector capitalization has increased in the past 24 hours, with its current value being $568.82 51.68 billion. This represents a $17.24 billion increase when compared to our previous report.

_______________________________________________________________________

What happened in the past 24 hours?

_______________________________________________________________________

_______________________________________________________________________

Technical analysis

_______________________________________________________________________

Bitcoin

Bitcoin has continued with its slow movement as another low volatility day passed. The largest cryptocurrency by market cap oscillated between $18,905 and $19,431. The one time it dropped under the $19,000 mark, it found support in the 50-period moving average, which has proven to be a strong (both support and resistance) level.

Due to the low volatility, traders can’t really do much at the moment. However, they can prepare for the next move Bitcoin makes.

Lastly, the Hash Ribbons (one of the best accumulation indicators) indicator has posted a buy signal, giving long-term investors the green light.

BTC/USD 4-hour chart

Bitcoin’s technicals on both short and long time-frames are bullish, with its weekly time-frame showing full tilt to the buy-side and its 4-hour, daily, and monthly time-frames tilting more towards neutrality.

BTC/USD 1-day Technicals

Technical factors (4-hour Chart):
  • Price is slightly above its 50-period EMA while being at its 21-period EMA
  • Price is at its middle Bollinger band
  • RSI is neutral (51.61)
  • Volume is slightly below average
Key levels to the upside          Key levels to the downside

1: $19,500                                 1: $19,000

2: $19,666                                 2: $18,790

3: $20,000                                  3: $18,600

Ethereum

Ethereum has, just like Bitcoin, had quite a slow day, with its price moving slightly down. At the moment, the second-largest cryptocurrency by market cap doesn’t seem like it will tackle $600, as its volume is too low to pressure this major resistance level. However, if and when a bull run past $600 happens, traders will have a great opportunity to catch a safe trade with a stop-loss slightly below $600 and a possible target of $620 or $630.

ETH/USD 4-hour Chart

Ethereum’s monthly overview shows a full tilt towards the buy-side, while its daily and weekly overviews show some signs of neutrality. On the other hand, its 4-hour overview is completely bearish.

ETH/USD 1-day Technicals

Technical Factors (4-hour Chart):
  • The price is slightly above its 50-period EMA while being slightly below its 21-period EMA
  • Price is at its middle Bollinger band
  • RSI is neutral (48.32)
  • Volume is below average
Key levels to the upside          Key levels to the downside

1: $620                                     1: $600

2: $630                                     2: $530 

3: $735                                      3: $510

Ripple

The fourth-largest cryptocurrency by market cap has close to no volatility, as well as very low volume on most exchanges. With the price movement being non-existent, there is not much to say about the current XRP trading. However, whenever the trading range is getting this narrow, a breakout is on the horizon.

XRP has created a flag formation on the 1-day chart, signaling that an increase in volume could bring a breakout to the upside and a possible spike of up to 60%, which would take the coin’s price above $1,00.


XRP/USD 4-hour Chart

XRP’s longer time-frames (weekly and monthly) show complete bullishness, while its 4-hour and daily overviews show some signs of neutrality or even bearishness.

XRP/USD 1-day Technicals

Technical factors (4-hour Chart):
  • The price is at its 50-period EMA, as well as at its 21-period EMA
  • Price is at its middle Bollinger band
  • RSI is neutral (50.46)
  • Volume is well below average
Key levels to the upside          Key levels to the downside

1: $0.666                                   1: $0.6

2: $0.78                                     2: $0.596

3: $0.79                                   3: $0.535

Categories
Crypto Market Analysis

Daily Crypto Review, Dec 07 – ETHE and GBTC Grayscale Funds Reach All-Time High Average Daily Volumes in November

The cryptocurrency sector has spent the weekend recovering from the price descent on Dec 3 and 4. Bitcoin is currently trading for $19,288, representing an increase of 0.16% compared to our last report. Meanwhile, Ethereum’s price has decreased by 1.49% on the day, while XRP managed to lose 0.74%.

 Daily Crypto Sector Heat Map

Omnitude gained 241.76% in the past 24 hours, making it the most prominent daily crypto gainer. It is closely followed by KIMCHI.finance’s 185% and Badger DAO’s 123.92% gain. On the other hand, DAV Coin lost 71.6%, making it the most prominent daily loser. It is followed by Semux’s loss of 66.12% and Bitball Treasure’s loss of 65.05%.

Top 10 24-hour Performers (Click to enlarge)

Bottom 10 24-hour Performers (Click to enlarge)

Bitcoin’s market dominance has barely moved to the downside since we last reported, with its value currently being 62.1%. This value represents a difference of 0.3% to the downside when compared to Friday’s value.

Daily Crypto Market Cap Chart

The crypto sector capitalization has decreased over the weekend. Its current value is $551.68 billion, representing an $18.83 billion decrease when compared to our previous report.

_______________________________________________________________________

What happened in the past 24 hours?

_______________________________________________________________________

_______________________________________________________________________

Technical analysis

_______________________________________________________________________

Bitcoin

Bitcoin has spent the weekend trying to recover from the downturn it had on Dec 3 and 4. The largest cryptocurrency by market cap has formed a triangle formation that is respected throughout the weekend and then broke it to the upside. While the move was short-lived, the overall short-term bullishness has increased.

Some traders see a bull flag instead of the triangle formation, which makes the possibly future even more bullish. Posting any short trades would most likely be more risky than profitable at the moment.

It is also important to note that the Has Ribbons (one of the best accumulation indicators) indicator has posted a buy signal.

BTC/USD 4-hour chart

Bitcoin’s technicals on all time-frames are bullish, with 4-hour and weekly time-frames showing full tilt to the buy-side and daily and monthly time-frames tilting more towards neutrality.

BTC/USD 1-day Technicals

Technical factors (4-hour Chart):
  • Price is above its 50-period EMA and slightly above its 21-period EMA
  • Price is slightly above its middle Bollinger band
  • RSI is neutral (54.36)
  • Volume is below average
Key levels to the upside          Key levels to the downside

1: $19,500                                 1: $19,000

2: $19,666                                 2: $18,790

3: $20,000                                 3: $18,500

Ethereum

Ethereum has spent the weekend slowly pushing towards the upside, reaching just under $600 and bouncing off the resistance level. Its current failure to break $600 is not a big red flag, as Ethereum’s large moves are (lately) mostly caused by Bitcoin’s movement.

Ethereum traders have a great opportunity to catch a safe trade if ETH/USD breaks $600. A stop-loss slightly below $600 and a possible target of $620 or $630 would make quite a viable trade.

ETH/USD 4-hour Chart

Ethereum’s 4-hour, weekly, and monthly overviews show a full tilt towards the buy-side, while its daily overview shows some signs of neutrality.

ETH/USD 1-day Technicals

Technical Factors (4-hour Chart):
  • The price is slightly above its 50-period and at its 21-period EMA
  • Price is at its middle Bollinger band
  • RSI is neutral (50.51)
  • Volume is slightly below average
Key levels to the upside          Key levels to the downside

1: $620                                     1: $600

2: $630                                     2: $510 

3: $735                                      3: $500

Ripple

The fourth-largest cryptocurrency by market cap experienced slightly more volatility over the weekend than during the previous week, with its price hovering between $0.542 and $0.626. The $0.6 level is currently holding quite well as a support line, and XRP shows no signs of dropping below it unless some external factor surfaces.

Trading XRP is, even with the slight increase in volatility, a near-impossible feat at the moment. Trading other (more volatile) cryptocurrencies could be a much better option.

XRP/USD 4-hour Chart

XRP’s 4-hour, weekly, and monthly overviews show complete bullishness, while its daily overview shows some signs of neutrality.

XRP/USD 1-day Technicals

Technical factors (4-hour Chart):
  • The price is at both its 50-period EMA and its 21-period EMA
  • Price is at its middle Bollinger band
  • RSI is neutral (53.49)
  • Volume is slightly below average
Key levels to the upside          Key levels to the downside

1: $0.666                                   1: $0.6

2: $0.78                                     2: $0.596

3: $0.79                                   3: $0.535

Categories
Crypto Market Analysis

BTC/USD Weekly Chart Analysis + Possible Outcomes

In this weekly BTC/USD analysis, we will be taking an in-depth look at the most recent technical formations, as well as look for the possible short-term price outcomes.

Overview

Bitcoin has spent the past week recovering levels it lost in a Nov 25 crash and even managed to push to a new all-time high on some exchanges. Still, the end-goal of Bitcoin above $20,000 was not reached.

Bitcoin’s institutional activity is more than booming, with news coming out left and right about companies investing in crypto, financial institutions preparing to embrace Bitcoin as an asset class, as well as regulators allowing Bitcoin to be held in employees’ company-funded 401k plans. On the other hand, Not being able to push past the $20,000 resistance level due to an incredible amount of sell orders near it has brought Bitcoin bears another day of hoping that the price will go lower.

Technical factors


Bitcoin has continued moving up until reaching an all-time high on some exchanges and then creating a doji candle followed by an inverted hammer candle on a weekly time-frame, indicating a possible bearish outlook as Bitcoin has most likely reached its short-term top. Looking at the shorter time-frames, such as the 4-hour one, we can see that Bitcoin has formed either a triangle formation or (if we include the movement from that started on Nov 27) a bull flag, which goes against the previously mentioned bearish outlook. Any break from the channel Bitcoin is trading in at the moment could mean a strong move towards that side.

The hash ribbons indicator flashed a BUY signal, which is an incredibly important update for long-term investors, as this indicator was the most consistent investment tool when it comes to RoI.

Likely Outcomes

Bitcoin’s sending out mixed signals on different time-frames, indicating indecisiveness from the retail sector. On the other hand, companies and institutions show incredibly bullishness as they are buying up Bitcoin over-the-counter. While a move to the downside is quite possible at the moment, the overall current trend is bullish, and short-selling could possibly harm traders’ portfolios more than they can improve it.

1: If Bitcoin fails to establish itself above $19,100 and breaks the range to the downside (slightly less likely), its most likely target will be $18,450. Due to a large number of buy orders in the zone between $18,190 and $18,450, this is the most likely place for reaccumulation and a push towards the upside after a pullback.

2: If Bitcoin manages to push towards the upside, first breaking $19,100 and then the descending black line (top line of the triangle formation), we can expect the price to attempt another push above $20,000, with the possibility of breaking it this time. If Bitcoin proves to be in a bull flag formation rather than a triangle formation, the profit target stays the same ($19,666 with possibly taking some profits along the way).

Entering any trade with having a target of above $20,000 is quite risky, and it would be better to play it safe and end the trade pre-$20,000 and then re-enter it if the price confidently moves up. The same goes for entering a short trade with sub-$18,450 in mind.

Categories
Crypto Market Analysis

Daily Crypto Review, Dec 4 – Bitcoin Above $19,000; Ether Fighting for $600

The cryptocurrency sector has spent the day trying to regain its recent highs, with Ethereum breaking $600 and Bitcoin breaking $19,000. Bitcoin is currently trading for $19,314, representing an increase of 1.14% compared to our last report. Meanwhile, Ethereum’s price has increased by 2.15% on the day, while XRP managed to lose 0.52%.

 Daily Crypto Sector Heat Map

The past 24 hours have passed without any major winners or losers in the top100 cryptos. Ren gained 5.23% in the past 24 hours, making it the most prominent daily gainer in the top100. It is closely followed by Band Protocol’s 4.44% and VeChain’s 4.08% gain. On the other hand, Decentraland lost 4.98%, making it the most prominent daily loser. It is followed by Uniswap’s loss of 4.79% and Kyber Network’s loss of 4.49%.

Top 10 24-hour Performers (Click to enlarge)

Bottom 10 24-hour Performers (Click to enlarge)

Bitcoin’s market dominance has barely changed since we last reported, with its value currently being 62.4%. This value represents a difference of 0.1% to the upside when compared to yesterday’s value.

Daily Crypto Market Cap Chart

The crypto sector capitalization has decreased just slightly in the past 24 hours. Its current value is $570.51 billion, representing a $0.54 billion decrease compared to our previous report.

_______________________________________________________________________

What happened in the past 24 hours?

_______________________________________________________________________

_______________________________________________________________________

Technical analysis

_______________________________________________________________________

Bitcoin

Bitcoin has spent the day trying to break its immediate resistance (which is sitting at $19,490). However, all attempts throughout the day have been unsuccessful, which prompted Bitcoin to pull back slightly. However, the largest cryptocurrency by market cap has established its presence above $19,000 with confidence once again.

Bitcoin is quite unpredictable at the moment, making safe trades hard to find. Traders should pay attention to BTC volume and enter trades with a high profit/loss ratio to quickly mitigate the risk of things turning from good to bad.

BTC/USD 1-hour chart

Bitcoin’s technicals on all time-frames are bullish, but they all show some signs of neutrality (or even bearishness) alongside the overall bullishness.

BTC/USD 1-day Technicals

Technical factors (4-hour Chart):
  • Price is currently above its 50-period EMA and slightly above its 21-period EMA
  • Price is at its middle Bollinger band
  • RSI is neutral (56.72)
  • Volume is average
Key levels to the upside          Key levels to the downside

1: $19,500                                 1: $19,000

2: $19,666                                 2: $18,790

3: $20,000                                 3: $18,500

Ethereum

Ethereum has spent the day following Bitcoin’s movement, with its price first pushing towards the upside and then pulling back as it was unable to break a certain level (in this case, $620. On the other hand, the second-largest cryptocurrency by market cap has seemingly established its presence above $600, though not with nearly as much conviction as Bitcoin did.

If Ethereum traders followed our advice from yesterday’s analysis, they would have made quite a good profit by longing Ether after it broke $600, with a stop-loss set slightly below this level. While trading Ethereum is still quite possible, the current high correlation with Bitcoin’s movement makes Bitcoin a (possibly) better option to trade, simply due to fewer variables a trader would have to consider.

ETH/USD 1-hour Chart

Ethereum’s daily and monthly overviews are completely bullish, while its 4-hour and weekly time-frames show some form of neutrality next to the overall bullishness.

ETH/USD 1-day Technicals

Technical Factors (4-hour Chart):
  • The price is currently above its 50-period and slightly above its 21-period EMA
  • Price is at its middle Bollinger band
  • RSI is neutral (57.22)
  • Volume is average
Key levels to the upside          Key levels to the downside

1: $620                                     1: $600

2: $630                                     2: $510 

3: $735                                      3: $500

Ripple

The fourth-largest cryptocurrency by market cap has had another extremely slow day, with its price barely fluctuating at all. The low volume and low volatility are continuing throughout the week, with XRP just barely moving to the downside as a response to the minor pullback caused by Bitcoin’s movement.

Trading XRP is a near-impossible feat at the moment, as the cryptocurrency currently shows no volatility and (therefore) no trade opportunities.

XRP/USD 2-hour Chart

XRP’s daily and monthly overviews are completely bullish, while its weekly time-frames show bullish sentiment with a hint of neutrality. Its 4-hour overview, however, is completely bearish.

XRP/USD 1-day Technicals

Technical factors (4-hour Chart):
  • The price is (at the moment of writing) slightly above its 50-period EMA and slightly below its 21-period EMA
  • Price is slightly below its middle Bollinger band
  • RSI is neutral (48.53)
  • Volume is slightly below average
Key levels to the upside          Key levels to the downside

1: $0.666                                   1: $0.6

2: $0.78                                     2: $0.596

3: $0.79                                   3: $0.535

Categories
Crypto Market Analysis

Daily Crypto Review, Dec 3 – PayPal and BlackRock Heads Extremely Bullish on Bitcoin; Crypto Sector Consolidating

The cryptocurrency sector has spent the day stabilizing after a sudden drop. Bitcoin is currently trading for $18,997, representing an increase of 0.48% compared to our last report. Meanwhile, Ethereum’s price decreased 0.64% on the day, while XRP managed to lost 0.01%.

 Daily Crypto Sector Heat Map

Decred gained 39.22% in the past 24 hours, making it the most prominent daily gainer in the top100. It is closely followed by Elrond’s 30.56% and Curve DAO Token’s 10.36% gain. On the other hand, Nexo lost 5.60%, making it the most prominent daily loser. It is followed by Status’s loss of 2.72% and Augur’s loss of 1.66%.

Top 10 24-hour Performers (Click to enlarge)

Bottom 10 24-hour Performers (Click to enlarge)

Bitcoin’s market dominance hasn’t changed since we last reported, with its value currently staying at 62.3%. This value represents a 0% difference when compared to yesterday’s value.

Daily Crypto Market Cap Chart

The crypto sector capitalization has increased significantly in the past 24 hours. Its current value is $571.05 billion, representing a $10.27 billion increase compared to our previous report.

_______________________________________________________________________

What happened in the past 24 hours?

_______________________________________________________________________

_______________________________________________________________________

Technical analysis

_______________________________________________________________________

Bitcoin

Bitcoin has spent the day recovering from yesterday’s pullback and trying to regain $19,000. However, this level has proven to be a solid resistance zone, and it is unsure whether Bitcoin will manage to push over it. On the other hand, the overall sentiment around the largest cryptocurrency by market cap is incredibly bullish, mostly due to the massive investments coming from the institutional side.

Bitcoin is very volatile and unpredictable at the moment, making the trades quite hard to pull off. Traders should pay attention to volume and watch smaller time-frames and enter trades with a high profit/loss ratio to mitigate the risk when things go bad.

BTC/USD 4-hour chart

Bitcoin’s short-term technicals are completely bullish, while its weekly and monthly technicals show some signs of neutrality alongside the overall bullishness.

BTC/USD 1-day Technicals

Technical factors (4-hour Chart):
  • Price is above its 50-period EMA and slightly above its 21-period EMA
  • Price is at its middle Bollinger band
  • RSI is neutral (54.55)
  • Volume is average
Key levels to the upside          Key levels to the downside

1: $19,000                                 1: $18,790

2: $19,500                                 2: $18,500

3: $19,666                                  3: $18,240

Ethereum

Ethereum has spent the day mostly flat and hovering right under the $600 mark. The second-largest cryptocurrency by market cap has continuously failed to break the immediate resistance level but did not back down from it.

Ethereum traders have a good chance of catching a safe trade with a stop-loss slightly below $600 if Ether pushes above $600 (either because of its own price movement or as a response to Bitcoin breaking $19,000 with conviction).

ETH/USD 4-hour Chart

Ethereum’s daily and monthly technicals are completely bullish, while its 4-hour and weekly time-frames show some neutrality next to the overall bullishness.

ETH/USD 1-day Technicals

Technical Factors (4-hour Chart):
  • The price is above its 50-period and at its 21-period EMA
  • Price is at its middle Bollinger band
  • RSI is neutral (54.35)
  • Volume is average
Key levels to the upside          Key levels to the downside

1: $600                                     1: $510

2: $630                                     2: $500 

3: $735                                      3: $490

Ripple

The fourth-largest cryptocurrency by market cap has had another slow day, with its price fluctuating between $0.6 and $0.64. The $0.6 support level seems to be holding quite well, while the $0.625 level got ignored several times, which made us remove it from the key levels section.

Trading XRP is almost impossible as the cryptocurrency currently has no volatility and (therefore) no trade opportunities.

XRP/USD 4-hour Chart

XRP’s daily and monthly technicals are completely bullish, while its 4-hour and weekly time-frames’ show bullish sentiment with a hint of neutrality.

XRP/USD 1-day Technicals

Technical factors (4-hour Chart):
  • The price is slightly above its 50-period EMA and at its 21-period EMA
  • Price is at its middle Bollinger band
  • RSI is neutral (51.08)
  • Volume is slightly below average
Key levels to the upside          Key levels to the downside

1: $0.666                                   1: $0.6

2: $0.78                                     2: $0.596

3: $0.79                                   3: $0.535


Categories
Crypto Market Analysis

Daily Crypto Review, Dec 2 – Traders Sell the News on ETH 2.0 Phase 0 Launch; Crypto Market in the Red

The cryptocurrency sector has dipped as the market entered a “selloff” mode the moment Ethereum’s 2.0 Phase 0 launched. The largest cryptocurrency by market cap is currently trading for $18,843, representing a decrease of 3.83% on the day. Meanwhile, Ethereum lost 2.83% on the day, while XRP managed to lost 6.17%.

 Daily Crypto Sector Heat Map

SushiSwap gained 34.83% in the past 24 hours, making it the most prominent daily gainer in the top100. It is closely followed by Kusama’s gain of 10.74% and Ampleforth’s 9.05% gain. On the other hand, HedgeTrade lost 10.21%, making it the most prominent daily loser. It is followed by Horizen’s loss of 9.44% and Ethereum Classic’s loss of 8.77%.

Top 10 24-hour Performers (Click to enlarge)

Bottom 10 24-hour Performers (Click to enlarge)

Bitcoin’s market dominance has decreased slightly since we last reported, with its value currently staying at 62.3%. This value represents a 0.1% difference to the downside when compared to yesterday’s value.

Daily Crypto Market Cap Chart

The crypto sector capitalization has decreased significantly in the past 24 hours. Its current value is $560.78 billion, representing a $17.09 billion increase compared to our previous report.

_______________________________________________________________________

What happened in the past 24 hours?

_______________________________________________________________________

_______________________________________________________________________

Technical analysis

_______________________________________________________________________

Bitcoin

Bitcoin has spent the day pulling back from its all-time highs and towards the $18,500 level. Its price formed a triangle formation on the 30-minute time-frame right after the price dump (which happened at the exact moment ETH 2.0 Phase 0 launched, as people were selling the news) and then broke it to the downside. Its price is now fighting for the $18,790 level (78.6% Fib retracement).

Bitcoin is quite volatile and unpredictable at the moment, but short trades in either direction could be viable. Traders should pay attention to volume and watch smaller time-frames and catch formations to trade off of them.

BTC/USD 30-minute chart

Bitcoin’s technicals on all time-frames are slightly tilted towards the buy-side. However, they show slight neutrality signs, except for the monthly overview, which is completely bullish.

BTC/USD 1-day Technicals

Technical factors (4-hour Chart):
  • Price is far above its 50-period EMA and at its 21-period EMA
  • Price is at its middle Bollinger band
  • RSI is near the overbought territory (52.95)
  • Volume is average
Key levels to the upside          Key levels to the downside

1: $19,000                                 1: $18,790

2: $19,500                                 2: $18,500

3: $19,666                                  3: $18,240

Ethereum

Ethereum has, just like Bitcoin, pulled back as traders sold the news of ETH 2.0 Phase 0 launching. While its move wasn’t as pronounced, the second-largest cryptocurrency by market cap did lose quite a bit of value, as well as most likely confirmed its position below $600. The double top formation was confirmed, which added to the decisiveness of the drop.

Ethereum traders should pay close attention to Bitcoin’s movement, as it currently dictates the market direction regardless of what news moves the market (news on Bitcoin or any other altcoin).

ETH/USD 4-hour Chart

Ethereum’s daily and monthly technicals are completely bullish and show no signs of neutrality. However, its 4-hour and weekly time-frames’ sentiment is bullish but shows some neutrality.

ETH/USD 1-day Technicals

Technical Factors (4-hour Chart):
  • The price is far above its 50-period and at its 21-period EMA
  • Price is at its middle Bollinger band
  • RSI is near being overbought (55.86)
  • Volume is average
Key levels to the upside          Key levels to the downside

1: $600                                     1: $510

2: $630                                     2: $500 

3: $735                                      3: $490

Ripple

The fourth-largest cryptocurrency by market cap had a pretty slow day, with its price hovering slightly above the $0.6 mark. Its price did feel the push towards the downside that the whole crypto sector experienced, but to a much lesser extent. XRP has found support at its 4-hour 50-period moving average, above which it is currently trading.

Trading XRP is almost certainly an inferior option to trading Bitcoin and Ethereum at the moment, as both the volume and volatility are low.

XRP/USD 4-hour Chart

XRP’s daily and monthly technicals are completely bullish and show no signs of neutrality. However, its 4-hour and weekly time-frames’ sentiment is bullish but shows some neutrality.

XRP/USD 1-day Technicals

Technical factors (4-hour Chart):
  • The price is slightly above its 50-period EMA and slightly below its 21-period EMA
  • Price is slightly below its middle Bollinger band
  • RSI is neutral (49.86)
  • Volume is below average
Key levels to the upside          Key levels to the downside

1: $0.666                                   1: $0.625

2: $0.78                                     2: $0.596

3: $0.79                                   3: $0.535


Categories
Crypto Market Analysis

Daily Crypto Review, Dec 1 – Bitcoin’s New Monthly All-Time High; Ethereum 2.0 Phase 0 Launches Today

The cryptocurrency sector has pushed further up as Bitcoin made a new all-time high for a moment. The largest cryptocurrency by market cap is currently trading for $19,443, representing an increase of 5.03% on the day. Meanwhile, Ethereum gained 3.45% on the day, while XRP managed to gain 3.78%.

 Daily Crypto Sector Heat Map

BitTorrent gained 18.25% in the past 24 hours, making it the most prominent daily gainer in the top100. It is closely followed by Litecoin’s gain of 11.22% and Decentraland’s 7.69% gain. On the other hand, Numeraire lost 4.81%, making it the most prominent daily loser. It is followed by Waves’ loss of 5.78 and Zilliqa’s loss of 3.36%.

Top 10 24-hour Performers (Click to enlarge)

Bottom 10 24-hour Performers (Click to enlarge)

Bitcoin’s market dominance has increased slightly since we last reported, with its value currently staying at 62.4%. This value represents a 0.7% difference to the upside compared to the value it had yesterday.

Daily Crypto Market Cap Chart

The crypto sector capitalization has increased significantly in the past 24 hours. Its current value is $577.86 billion, representing a $24.86billion increase compared to our previous report.

_______________________________________________________________________

What happened in the past 24 hours?

_______________________________________________________________________

_______________________________________________________________________

Technical analysis

_______________________________________________________________________

Bitcoin

Bitcoin has spent the day continuing its push towards the upside, even posting a new all-time high (on most exchanges) for a moment as it reached $19,864 on Bitstamp. However, the 20,000 mark and BitMEX’s $20,093 remain untouched. With the buys on exchanges and derivatives markets and institutional investments, a strong all-time high might be posted extremely soon.

Bitcoin trading is quite hard at the moment simply due to how the cryptocurrency moves. Still, traders can squeeze a profit if they trade along with the main trend and long Bitcoin when the volume increases.

BTC/USD 4-hour Chart

Bitcoin’s technicals on all time-frames are tilted towards the buy-side but show slight neutrality signs, or even slight signs of bearishness.

BTC/USD 1-day Technicals

Technical factors (4-hour Chart):
  • Price is far above both its 50-period EMA and its 21-period EMA
  • Price is near its top Bollinger band
  • RSI is near the overbought territory (69.43)
  • Volume is average
Key levels to the upside          Key levels to the downside

1: $19,500                                 1: $19,000

2: $19,666                                 2: $18,790

3: $20,000                                  3: $18,500

Ethereum

Ethereum has, just like Bitcoin, continued its climb up. However, the move has stopped slightly below its most recent highs, topping at $617.87. The second-largest cryptocurrency by market cap now has two scenarios to play out:

  1. It can create a double top and start moving back towards the supporting levels;
  2. It can continue moving up on fundamentals and break the recent high and the recent trading patterns it created.

Ethereum’s current fundamental outlook is extremely bullish due to its Phase 0 of Ethereum 2.0 launching. This, along with Bitcoin moving towards the upside, has made trading any potential pullbacks quite impossible due to the amount of potential risk such trade would carry.

ETH/USD 4-hour Chart

Ethereum’s 4-hour, daily, and monthly technicals are extremely bullish and show no signs of neutrality. On the other hand, its weekly time-frame’s sentiment is bullish but shows some neutrality.

ETH/USD 1-day Technicals

Technical Factors (4-hour Chart):
  • The price is far above both its 50-period and its 21-period EMA
  • Price is near its top Bollinger band
  • RSI is near being overbought (68.63)
  • Volume is average
Key levels to the upside          Key levels to the downside

1: $600                                     1: $510

2: $630                                     2: $500 

3: $735                                      3: $490

Ripple

The fourth-largest cryptocurrency by market cap has tried moving up, as well, but in a much tamer manner. XRP has established its presence above $0.625 and pushed towards $0.666, which stopped the move. XRP will most likely continue trading in a range-bound by $0.666 to the upside and either $0.625 or $0.596 to the downside

Trading XRP is quite difficult at the moment, and trading Bitcoin or Ethereum is potentially more profitable and slightly more straightforward.

XRP/USD 4-hour Chart

XRP’s technicals on the 4-hour and weekly time-frames are bullish but show some signs of neutrality. On the other hand, its daily and monthly overviews are completely bullish.

XRP/USD 1-day Technicals

Technical factors (4-hour Chart):
  • The price is above its 50-period EMA and slightly above its 21-period EMA
  • Price is between its middle and top Bollinger band
  • RSI is neutral (60.95)
  • Volume is average
Key levels to the upside          Key levels to the downside

1: $0.666                                   1: $0.625

2: $0.78                                     2: $0.596

3: $0.79                                   3: $0.535


Categories
Crypto Market Analysis

Daily Crypto Review, Nov 30 – Ethereum Soars on Great Fundamentals; Bitcoin Bulls Back in the Game

The cryptocurrency sector has spent the weekend regaining what was lost during the crash on Nov 25. Almost every single cryptocurrency in the top100 ended up being in the green. The largest cryptocurrency by market cap is currently trading for $18,369, representing an increase of 4.43% on the day. Meanwhile, Ethereum gained 9.79% on the day, while XRP managed to gain 6.67%.

 Daily Crypto Sector Heat Map

Kusama gained 19.14% in the past 24 hours, making it the most prominent daily gainer in the top100. It is closely followed by Ampleforth’s gain of 16.24% and Zilliqa’s 13.48% gain. On the other hand, Numeraire Coin lost 5.56%, making it the most prominent daily loser. There were no other cryptocurrencies in the top100 that lost over 1% of its value.

Top 10 24-hour Performers (Click to enlarge)

Bottom 10 24-hour Performers (Click to enlarge)

Bitcoin’s market dominance has decreased slightly since we last reported, with its value currently staying at 61.7%. This value represents a 0.5% difference to the downside compared to the value it had on Friday.

Daily Crypto Market Cap Chart

The crypto sector capitalization has increased significantly over the weekend. Its current value is $553.00 billion, representing a $38.14 billion increase compared to our previous report.

_______________________________________________________________________

What happened in the past 24 hours?

_______________________________________________________________________

_______________________________________________________________________

Technical analysis

_______________________________________________________________________

Bitcoin

Bitcoin has spent the weekend recovering from the Nov 25 crash. The price was slowly going up over the weekend, creeping up to and past $18,000 once again. The largest cryptocurrency by market cap is currently between its 61.8% and 78.6% Fib retracement levels, and a break to either side of this range may determine its short-term fate.

Bitcoin’s short-term future will greatly depend on if it breaks its immediate support or resistance level. In both cases, a strong rally towards that side may form, so traders should be prepared to “catch” the trade quickly.

BTC/USD 1-hour Chart

Bitcoin’s daily, weekly, and monthly technicals are tilted towards the buy-side but show slight neutrality signs. On the other hand, its 4-hour technicals are completely bullish.

BTC/USD 1-day Technicals

Technical factors (4-hour Chart):
  • Price is above both its 50-period EMA and its 21-period EMA
  • Price is near its top Bollinger band
  • RSI is neutral (62.26)
  • Volume is average
Key levels to the upside          Key levels to the downside

1: $18,500                                 1: $17,850

2: $18,790                                 2: $17,450

3: $19,000                                  3: $17,000

Ethereum

Ethereum has, just like Bitcoin, been climbing back and trying to reach its recent highs. The second-largest cryptocurrency by market cap is currently fighting to pass the 78.6% Fib retracement level, sitting at $592.5. If this level gets conquered with conviction, we may expect another run past $600.

Ethereum’s current fundamental outlook is very bullish due to its Phase 0 of Ethereum 2.0 launching. This, combined with Bitcoin moving towards the upside, has made trading any potential pullbacks impossible due to how risky it would be.

ETH/USD 4-hour Chart

Ethereum’s 4-hour, daily, and monthly technicals are completely bullish and show no signs of neutrality. On the other hand, its sentiment seen in the weekly time-frame’s is bullish but shows some neutrality.

ETH/USD 1-day Technicals

Technical Factors (4-hour Chart):
  • The price is far above both its 50-period and its 21-period EMA
  • Price is at its top Bollinger band
  • RSI is near being overbought(68.26)
  • Volume is average
Key levels to the upside          Key levels to the downside

1: $600                                     1: $510

2: $630                                     2: $500 

3: $735                                      3: $490

Ripple

The fourth-largest cryptocurrency by market cap has spent the weekend trying to maintain its level after a small rally that took its price from $0.55 to $0.65. XRP seems to be trading in a range, bound by the 38.2% Fib retracement ($0.582) and 61.8% Fib retracement ($0.657).

Trading XRP may not be optimal as trading Bitcoin, or Ethereum is potentially more profitable and slightly more straightforward.

XRP/USD 2-hour Chart

XRP’s technicals on shorter time-frames (4-hour and daily) are extremely bullish, while its weekly and monthly overviews show some signs of neutrality and bearishness (though they are still bullish).

XRP/USD 1-day Technicals

Technical factors (4-hour Chart):
  • The price is above its 50-period EMA and slightly above its 21-period EMA
  • Price is between its middle and top Bollinger band
  • RSI is neutral (58.86)
  • Volume is average
Key levels to the upside          Key levels to the downside

1: $0.657                                   1: $0.625

2: $0.711                                     2: $0.582

3: $0.79                                  3: $0.535


Categories
Crypto Market Analysis

BTC/USD Weekly Chart Analysis + Possible Outcomes

In this weekly BTC/USD analysis, we will be taking a brief look at the most recent events, current chart technical formations, as well as the possible BTC short-term price outcomes.

Overview

Bitcoin has spent the past week experiencing a long-awaited pullback, after which it started consolidating. The largest cryptocurrency by market cap has dropped significantly and reached as low as $16,200 before bears reached exhaustion after failing to break its all-time high. While some analysts are calling for an end of the pullback, most of the data shows otherwise. First off, the current controversy around China seizing 1% of all Bitcoin is contributing towards the overall bearish sentiment. Second, a poll done on crypto investors says that the majority of investors believe that BTC will end up correcting as much as 40%. All this, plus the fact that Bitcoin couldn’t push past $17,260 for a couple of days now, is a testament to the short-term bearish sentiment.

On the other hand, people shouldn’t mistake this for a long-term bearish trend. In fact, Bitcoin has never been more bullish long-term.

Technical factors


Bitcoin has continued moving up and performed exactly what we called last week (a push towards the all-time high). Once again, as expected, the push didn’t break the all-time high and has triggered a strong pullback. Bears have reached exhaustion at just over $16,000 and Bitcoin has started consolidating in a range, bound by $17,260 (both horizontal resistance and a 100-period moving average) to the upside and $16,420 to the downside.

The hash ribbons indicator still shows a buy/accumulate signal as it points out to miner capitulation.

Likely Outcomes

Bitcoin’s movement is a bit less obvious this week when compared to the past weeks. The cryptocurrency has a couple of scenarios it can play out as it leaves the current range-bound trading.

1: If Bitcoin breaks the range to the downside (slightly less likely), its most likely target will be $15,500. Due to the short-term bearish sentiment surrounding Bitcoin at the moment, a short trade doesn’t have to be considered as “trading against the large trend” and may actually be a good profit-making opportunity.

In this case, a clear stop-loss should be set a little above $16,420.

2: The second (just slightly more likely) scenario happens if Bitcoin manages to break the $17,260 mark. In this case, the cryptocurrency can reach many targets, but will most likely pass the $17,600 immediate resistance and push higher. The next zone of resistance after that is the $18,250-$18,450.

Trading Bitcoin’s sideways action in a current range is not advised as the price could break out of it at any time.

Categories
Crypto Market Analysis

Daily Crypto Review, Nov 27 – Satoshi Nakamoto Emails Discovered; Crypto Market Consolidating

The cryptocurrency sector has started its consolidation period after a bloodbath it experienced yesterday. The largest cryptocurrency by market cap is currently trading for $17,164, representing a decrease of 3.07 % on the day. Meanwhile, Ethereum is gaining 0.01% on the day, while XRP managed to gain 2.47%.

 Daily Crypto Sector Heat Map

SushiSwap gained 31.44% in the past 24 hours, making it the most prominent daily gainer in the top100. It is closely followed by Aave’s gain of 15.05% and Nano’s 14.68% gain. On the other hand, Crypto.com Coin lost 10.20%, making it the most prominent daily loser. NEM lost 9.92% while OMG Network lost 9.43%, making them the 2nd and 3rd most prominent daily losers.

Top 10 24-hour Performers (Click to enlarge)

Bottom 10 24-hour Performers (Click to enlarge)

Bitcoin’s market dominance has stayed at the same place as yesterday, with its value currently staying at 62.2%. This value represents a 0% difference when compared to the value it had yesterday.

Daily Crypto Market Cap Chart

The crypto sector capitalization has decreased significantly over the course of the day. Its current value is $511.86 billion, representing a $48.67 billion decrease compared to our previous report.

_______________________________________________________________________

What happened in the past 24 hours?

_______________________________________________________________________

_______________________________________________________________________

Technical analysis

_______________________________________________________________________

Bitcoin

The largest cryptocurrency by market cap has triggered a rally towards the downside after creating a double top, which brought its price as low as $16,215. While some analysts say that the downturn is not over yet, Bitcoin has recovered slightly and is now consolidating just above the $17,000 mark.

While shorting Bitcoin could be a good profit-making opportunity if the downtrend continues, trading against the long-term trend is very risky. However, thinking about hedging against any downturns should be considered.

BTC/USD 1-hour Chart

Bitcoin’s daily and weekly technicals are tilted towards the buy-side and show no signs of neutrality. On the other hand, its monthly technicals show some signs of neutrality, while its 4-hour technicals are completely bearish.

BTC/USD 1-day Technicals

Technical factors (1-hour Chart):
  • Price is far below its 50-period EMA and at its 21-period EMA
  • Price is at its middle Bollinger band
  • RSI is neutral (44.33)
  • Volume is average
Key levels to the upside          Key levels to the downside

1: $17,450                                 1: $17,000

2: $17,850                                 2: $16,800

3: $18500                                   3: $16,350

Ethereum

Ethereum has experienced the same chain of events Bitcoin did in the past day or so. The downtrend ended up bringing Ethereum’s price back to as low as $480 before recovering. However, Ethereum’s ascending channel (yellow dotted) top line has stayed strong and triggered a mini-rally, which then brought the price above the red ascending line as well. Ethereum is now consolidating at around $515.

Ethereum’s current fundamental outlook is very bullish, but (as we said in our previous articles) any sharp move to the downside triggered by Bitcoin will affect Ethereum in a major way as well. This makes trading up hard, as one needs to constantly check Bitcoin’s price as well.

ETH/USD 1-hour Chart

Ethereum’s daily, weekly, and monthly technicals are completely bullish and show no or just slight neutrality signs. On the other hand, its sentiment seen in the 4-hour time-frame’s is completely bearish.

ETH/USD 1-day Technicals

Technical Factors (4-hour Chart):
  • The price is far below its 50-period and at its 21-period EMA
  • Price is at its middle Bollinger band
  • RSI is neutral (44.53)
  • Volume is average
Key levels to the upside          Key levels to the downside

1: $600                                     1: $510

2: $630                                     2: $500 

3: $735                                      3: $490

Ripple

The fourth-largest cryptocurrency by market cap has posted lower highs three times in a row, with its lows testing the $0.625 support level each time the price went down. However, the third time XRP went towards this level, Bitcoin’s push towards the downside triggered XRP bears, which took over the market. The downturn ended at the $0.475 level, which held up quite nicely. XRP is now trading in the middle of a range, bound by $0.475 to the downside and $0.625 to the upside.

Trading XRP may not be optimal at the moment as trading Bitcoin is both potentially more profitable and a bit more straightforward.

XRP/USD 1-hour Chart

XRP’s technicals on all time-frames are bullish, with its daily time-frame being the only one not showing any signs of neutrality. The other time-frames show either slight neutrality or even slight bearishness.

XRP/USD 1-day Technicals

Technical factors (4-hour Chart):
  • The price is slightly below its 50-period EMA and at its 21-period EMA
  • Price is slightly above its middle Bollinger band
  • RSI is neutral (48.78)
  • Volume is slightly above average
Key levels to the upside          Key levels to the downside

1: $0.625                                   1: $0.475

2: $0.79                                     2: $0.443

3: $0.963                                  3: $0.4


Categories
Crypto Market Analysis

Daily Crypto Review, Nov 26 – Bitcoin’s “Flash Crash” Pulls Price Below $18,000; Blood on the Crypto Streets

The cryptocurrency sector has ended the day in the red as Bitcoin failed to stay above $19,000 and even falling below $18,000 as bears took control of the market. The largest cryptocurrency by market cap is currently trading for $17,000, representing a decrease of 10.67%% on the day. Meanwhile, Ethereum is losing 15.34% on the day, while XRP lost 16.88%.

 Daily Crypto Sector Heat Map

Zilliqa 23.75% in the past 24 hours, making it the most prominent daily gainer in the top100. It is closely followed by Horizen’s gain of 18.71% and Elrond’s 11.54% gain. On the other hand, Verge lost 24.86%, making it the most prominent daily loser. Kusama lost 15.78% while Reserve Rights lost 13.81%, making them the 2nd and 3rd most prominent daily losers.


Top 10 24-hour Performers (Click to enlarge)

Bottom 10 24-hour Performers (Click to enlarge)

Bitcoin’s market dominance has increased over the day, with its value currently staying at 62.2%. This value represents a 0.6% difference to the upside compared to the value it had yesterday.

Daily Crypto Market Cap Chart

The crypto sector capitalization has decreased over the course of the day. Its current value is $560.17 billion, representing an $11.36 billion decrease compared to our previous report.

_______________________________________________________________________

What happened in the past 24 hours?

_______________________________________________________________________

_______________________________________________________________________

Technical analysis

_______________________________________________________________________

Bitcoin

The largest cryptocurrency by market cap has created a double top, which triggered a pullback from the recent highs. Not only has the price retraced to the sub-$19,000 level, but it has also broken the $18,500 support level. The price will most likely end up below the $17,850 level, as the market is calling for a pullback for quite some time. However, if the market recovers, we can expect the price to end up between $17,850 and $18,500.

While shorting Bitcoin might be a good profit-making opportunity at the moment, trading against the long-term trend is extremely risky. However, thinking about hedging versus any downturns might be a good option at the moment.

BTC/USD 1-hour Chart

Bitcoin’s 4-hour, daily, and weekly technicals are heavily tilted towards the buy-side and show no signs of neutrality or bearishness. On the other hand, its monthly technicals are showing some signs of neutrality.

BTC/USD 1-day Technicals

Technical factors (1-hour Chart):
  • Price is far below its 50-period EMA and its 21-period EMA
  • Price slightly below its lower Bollinger band
  • RSI is extremely oversold (23.98)
  • Volume is average (one candle spike)
Key levels to the upside          Key levels to the downside

1: $18500                                  1: $17,850

2: $19000                                  2: $17,450

3: $19500                                   3: $17,000

Ethereum

While Ethereum did follow Bitcoin to the downside, both in price direction and severity of the move, the situation doesn’t look that bad. The second-largest cryptocurrency by market cap has started its pullback after failing to stay above $600, culminating in a full-blown dump from $570 to $505. However, the ascending (red) line held up, and ETH reclaimed previous levels and is currently consolidating around $530.

Ethereum’s current outlook is very bullish, but any sharp move to the downside coming from Bitcoin will affect it in a major way. Traders should pay close attention to Bitcoin’s moves if they want to trade Ether.

ETH/USD 1-hour Chart

Ethereum’s technicals are a bit confusing, as its daily and monthly overviews are completely bullish, while its weekly overview shows slight signs of neutrality. Its 4-hour technicals, however, are pointing towards the sell-side.

ETH/USD 1-day Technicals

Technical Factors (4-hour Chart):
  • The price is below both its 50-period and its 21-period EMA
  • Price is below its bottom Bollinger band
  • RSI is extremely oversold (19.47)
  • Volume is above average
Key levels to the upside          Key levels to the downside

1: $600                                     1: $510

2: $630                                     2: $500 

3: $735                                      3: $490

Ripple

The fourth-largest cryptocurrency by market cap has performed similarly to the aforementioned two cryptocurrencies. XRP has posted lower highs three times in a row while testing the $0.625 support level each time. However, the last time XRP went towards this level, bears took over and pushed the price further down. XRP bears have seemingly reached exhaustion, and the cryptocurrency is now consolidating around the $0.575 level.

Trading XRP is not advised as trading Bitcoin is (at the moment) both potentially more profitable and more straightforward.

XRP/USD 1-hour Chart

XRP’s technicals on all time-frames are tilted towards the buy-side, with its daily overview being the most bullish time-frame. Its other time-frames show signs of neutrality or even slight bearishness.

XRP/USD 1-day Technicals

Technical factors (4-hour Chart):
  • The price is far below both its 50-period EMA and its 21-period EMA
  • Price is slightly below its bottom Bollinger band
  • RSI is close to being oversold (31.85)
  • Volume is above average
Key levels to the upside          Key levels to the downside

1: $0.625                                   1: $0.475

2: $0.79                                     2: $0.443

3: $0.963                                  3: $0.4


Categories
Crypto Market Analysis

Daily Crypto Review, Nov 25 – Bitcoin Above $19,000: What’s Next?

The cryptocurrency sector has spent the day pushing towards the upside as Bitcoin rallied and reached past $19,000. The largest cryptocurrency by market cap is currently trading for $19,093, representing an increase of 4.37% on the day. Meanwhile, Ethereum lost 0.55% on the day, while XRP gained 14.94%.

 Daily Crypto Sector Heat Map

Verge 63.06% in the past 24 hours, making it the most prominent daily gainer in the top100. It is closely followed by Stellar’s gain of 59.30% and Status’s 31.14% gain. On the other hand, Bitcoin Gold lost 16.21%, making it the most prominent daily loser. SushiSwap lost 12.05% while Balancer lost 7.89%, making them the 2nd and 3rd most prominent daily losers.

Top 10 24-hour Performers (Click to enlarge)

Bottom 10 24-hour Performers (Click to enlarge)

Bitcoin’s market dominance has increased over the course of the day, with its value is currently staying at 61.06%. This value represents a 1% difference to the upside compared to the value it had yesterday.

Daily Crypto Market Cap Chart

The crypto sector capitalization has increased slightly over the course of the day. Its current value is $571.53 billion, representing an $8.86 billion increase compared to our previous report.

_______________________________________________________________________

What happened in the past 24 hours?

_______________________________________________________________________

_______________________________________________________________________

Technical analysis

_______________________________________________________________________

Bitcoin

The largest cryptocurrency by market cap has had an exciting day as its price reached past the $18,500 mark and pushed towards its all-time highs. Bitcoin managed to get to $19,450 before the momentum started dying off. It is currently consolidating just at the $19,000 mark, fighting to stay above it. This move was enabled by a booming altcoin situation, which led to a money pour-over into Bitcoin.

Any trading to the downside is completely irresponsible now due to how Bitcoin is moving. On the other hand, its movement towards the upside is very hectic, and traders should pay attention to when they enter and exit trades. If Bitcoin establishes its presence above the $19,000 mark with confidence, another push that might break the $20,000 all-time high level is entirely possible.

BTC/USD 2-hour Chart

Bitcoin’s technicals are tilted to the bull-side slightly, with only the weekly time-frame being completely bullish. In contrast, its other time-frames contain a hint of neutrality or even bearishness.

BTC/USD 1-day Technicals

Technical factors (4-hour Chart):
  • Price is above its 50-period EMA and at its 21-period EMA
  • Price slightly above its middle Bollinger band
  • RSI is neutral (55.57)
  • Volume is average
Key levels to the upside          Key levels to the downside

1: $19000                                  1: $18500

2: $19500                                  2: $17,850

3: $19,666                                  3: $17,450

Ethereum

Ethereum’s parabolic move, which brought its price from $480 to $625, has seemingly ended, and Ethereum has entered a consolidation/retracement phase. While it was uncertain whether the second-largest cryptocurrency by market cap will stay above $600, the fight for the level has ended, and ETH moved back below it.

Ethereum has a very strong zone of resistance above $600 and all the way up to $632. On the other hand, it has a decently strong support zone at $575-$580. We can expect Ethereum to move in that range in the short-term unless a new breakout occurs.


ETH/USD 2-hour Chart

Ethereum’s technicals are tilted to the bull-side slightly, with only the monthly time-frame being completely bullish. In contrast, its other time-frames contain slight neutrality or even bearishness.

ETH/USD 1-day Technicals

Technical Factors (4-hour Chart):
  • The price is above its 50-period and slightly below its 21-period EMA
  • Price is near its bottom Bollinger band
  • RSI is neutral (50.82)
  • Volume is above average
Key levels to the upside          Key levels to the downside

1: $600                                     1: $510

2: $630                                     2: $500 

3: $735                                      3: $490

Ripple

The fourth-largest cryptocurrency by market cap’s controversial parabolic rise has died down and actually kept most of its gains. XRP has moved back from its recent highs of $0.78 (and even $0.9 on some exchanges) to a steadier $0.68, which is its current price. We can also see that XRP made a double top at the $0.735 mark, as well as a double bottom at the $0.625 support level.

Trading XRP is more manageable now as the volatility has died down, and the zones of support/resistance have been established. However, trading crypto overall is extremely risky at the moment, and only moves to the upside (and possibly sideways movement) should be traded.

XRP/USD 2-hour Chart

XRP’s 4-hour and daily overviews are completely bullish and show no signs of neutrality whatsoever, while its weekly and monthly overviews show slight neutrality or even a hint of bearishness.

XRP/USD 1-day Technicals

Technical factors (4-hour Chart):
  • The price is far above its 50-period EMA and slightly above its 21-period EMA
  • Price is slightly above its middle Bollinger band
  • RSI is neutral (59.98)
  • Volume is above average
Key levels to the upside          Key levels to the downside

1: $0.79                                     1: $0.625 

2: $0.963                                   2: $0.475

3: $1.01                                    3: $0.443


Categories
Cryptocurrencies

Blockchain Tech Growth and What It Means for You

We are living an important growth of applications based on Blockchain technology, what would be the definition of this technology?

In 1968, young Americans died far from home in a war they did not understand, French students took to the streets contrary to the consumer society… people began to demand liberal self-management mechanisms, far from regulations imposed by leaders, of which no one knew their true intentions… In that ecosystem, attractive ideas began to be forged that, far from the violence of ancient revolutions, defended property and pure capitalism, a capitalism that was managed from the will of individuals and that sought social justice from the conscious distribution of resources.

In the following years the theories that underpinned these ideas were written, the ideas that established the foundations of the collaborative economy as we understand it today. Currently, Blockchain is the technology that makes these ideas possible. Blockchain is the technology that makes individuals possible to interact with each other, without the need for an external regulator imposed by the system. That is, Blockchain does not need governments, ministries, or large corporations to regulate relationships between individuals. Blockchain is an intelligent arbitration system that through a fair consensus system, provides validity and trust to all transactions between individuals.

So the question is no longer what is Blockchain? The question is, if like the youth movement of May ’68 was cannibalized by the consumer market that was attacked, will the current market be able to absorb the Blockchain movement? We have seen that it has a multitude of applications Can you give us some examples of the use that is currently being given to this technology and what it can be given in the future?

Rivers of ink are being written about the things that can be done with Blockchain, but the reality is that getting out of the conceptual definition is not that easy. The real applications for the market are appearing now, and the most immediate possibilities are in financial transactionality, document certification, digital identity, and cybersecurity… Use cases are landing right now: Object traceability… and people, intellectual property, or virtual banks are already a reality.

And what will come? Blockchain can reduce costs in management processes in any company, including public administration. Blockchain securely reduces the time and price of financial transactions and information. Blockchain proposes transparent distribution systems that parameterize the signed contracts obliging compliance, systems that execute orders agreed automatically… The future is magnificent.

Why this blockchain boom? We come from a global economic crisis, a crisis in which bankers, businessmen, and leaders have not turned out very well, some morally, and others, also judicially. A crisis in which we have all suffered, if not in our own experience, if in of a close relative or friend, it has also been a public crisis, televised: televised the scavengers, televised the refugee children dying on the beach, televised trials in which everyone loses their memory, televised politicians, elected by the citizens and guarantors of democracy and the values of society, covering their faces to get into police vans… being aware of what’s going on, and seeing it every day in the media… Isn’t it tempting to cling to the mysticism of a technology that allows anyone to create a bank, that allows benefits to be democratized, that allows you to believe that you can get out of a system that no longer provides moral referents?.

The public networks of Blockchain, cannot be fooled, cannot be hacked, cannot be bribed… How can I not allow myself to dream of a world that works better? Dreaming is legitimate and human, as is hope… That’s why the gap I was referring to earlier, between the conceptual and real Blockchain, because, for many people, Blockchain is still the Grail, or even, for some, an exercise in alchemy. We must balance expectation and reality.

What are cryptocurrencies and what are their current utilities? Cryptocurrencies are the money of the future, digital money where instead of relying on a centralized system is used a “peer-to-peer” system with thousands of anonymous nodes that verify the transaction, thus avoiding 90% of the cost and increasing the speed of operations, with the ability to make transactions in seconds, whatever the recipient and regardless of their location: a few days ago, I was told how a transfer could be made to Hong Kong in 6 minutes and totally secure.

Its use can be purely economic, as if they were euros or any other fiduciary currency, for example, so the Bitcoin or Ether, can have an application as an investment in a company or project, where the currency is valued or devalued according to the total capital that supports the project, its initial offer to launch the currency is called ICO and currently exist around 800 different cryptocurrencies where the predominance of bitcoin over the rest is around 40%. And in other cases, cryptocurrencies can be used for a mere exchange of goods and services, as a digital “barter”.

Why this rise of cryptocurrencies and what is expected in the future of them? The boom is because people don’t want long waiting times, nor do they want to pay high commissions, we are in a society where we want everything already and as cheap as possible. And with Blockchain technology this is possible. In addition, the other great advantage is that they allow the distribution of “dividends” of a company in a very simple and equitable way depending on the number of tokens (cryptocurrencies) that are held of a project. People are also providing them as a future investment because the growth of the market, the trend, is sustained and bullish.

What are the main cryptocurrencies and what differentiates them? The main currencies for me are two, on the one hand, Bitcoin and second Ether, although there are many who will want to come out and growing in volume and quotation. Bitcoin was the first cryptocurrency considered as such, after several failed attempts in the ’90s, Satoshi Nakamoto, in January 2009, announced the creation of Bitcoin and since then has gone from being worth cents to approximately $2,500 worth today, its end is entirely economic and transactional and can easily predict significant growth in the near future, with an estimated $10,000 by the end of next year.

On the other hand, Ether that works on the Ethereum platform emerged as an improvement over the Bitcoin network, where transactions are made faster and are better adapted to run Smart Contracts, which are intelligent contracts that allow the network itself to carry out operations if certain premises are automatically fulfilled.

More and more coins will appear with new projects, I can recommend ReddCoin RDD, a project that integrates a digital currency platform in a transparent way in the main social networks so that the process of both sending and receiving money is very simple and rewarding for everyone. Another emerging currency is LBRY, which has created a free, open, and community-managed Blockchain digital marketplace. But, again, there are 800 digital coins and each one has its own particularity.

Going back to Blockchain technology, what is it based on and how is it built? Although it is a complex technology, I will try to explain it as simply as possible:

Imagine a thousand computers, scattered around the world, each in the home of a normal person, a family, a student… individuals who do not know each other and make independent decisions. Well, let’s imagine, those computers are part of a blockchain network.

And I’m sure you’re wondering: why are they part of the network? Because very simple, apart from believing in it, they also do it for money. For each of those computers, every time you transfer information or digital money, you get a small commission.

Once we have answered why a computer is put at the service of a public Blockchain network, we can now imagine that someone decides to send a transfer in a cryptocurrency to pay for tickets to a theater function. Well, all those computers, they distribute the commission money that costs me that transfer, but in turn, they also validate the transaction.

Let’s take an example of how a blockchain action is validated and what are the advantages of distributing the information: if I send to the thousand computers the information 1, the thousand computers keep the information 1. If someone tried to change the information of a computer and said that the information is 0 and not 1, a complex system of arbitration based on the theory of games would have the remaining 999 computers tell the changed computer “you made a mistake, the information is 1” and the changed computer would give back the correct information.

Returning to our example of ticket purchases, the thousand computers validate that from my account a transfer of an X value has been made to the theater account, if someone wanted to change or hack that information, they would have to “change their mind” to the thousand computers.

Why are more and more banks (and non-banks) using this technology? In my opinion, Blockchain is a wonderful technology, the best-built data certifier, and validator. In addition, as noted above, the deployment of distributed data chains reduces management costs and can optimize process times. With this argument… How can companies and organizations not want to have this technology?

There is a special case, which is the financial institutions. Their situation with Blockchain is very special. On the one hand, they are forced to understand and play on the Blockchain board, because the reality is that anyone can create a virtual bank, the financial startups, the so-called fintech, are creating financial ecosystems independently of the big banks, and regulations such as the PSD2 directive are coming on top of them, which makes the growth of this new competition even more possible… All this encourages them to move forward.

But also, they have very strong regulations that they must comply with, they have spent a lot of money to generate operating systems that, effectively, work, the average age of customers earning money is high enough and far enough from an on-line industrial revolution to worry about now, and its conservative nature, makes them afraid of a technology they fail to fully understand. We’ll see in the future, whether the brake was stronger than the advance or… vice versa.

How could this technology revolutionize personal and institutional relationships? In personal and institutional relationships I am clear about the next step with Blockchain, and it affects two basic characteristics of both personal and commercial relationships: reputation and truthfulness.

As digital identity systems and data validation systems advance, it is going to be very difficult to cheat or lie on the network. I am aware of the European Union’s intention to move forward on the issue of unique digital identity registers so that our identity as citizens transcends the virtual world.

Categories
Crypto Market Analysis

Daily Crypto Review, Nov 24 – XRP’s Push to $0.9 Manipulated? Ether Breaks $600 on Amazing News

The cryptocurrency sector has spent been in the green overall, with Bitcoin consolidating and altcoins booming. The largest cryptocurrency by market cap is currently trading for $18,364, representing a decrease of 0.36% on the day. Meanwhile, Ethereum gained 4.23% on the day, while XRP gained a whopping 54.14%.

 Daily Crypto Sector Heat Map

Stellar 61.98% in the past 24 hours, making it the most prominent daily gainer in the top100. It is closely followed by XRP’s gain of 52.19% and Verge’s 37.77% gain. On the other hand, SushiSwap lost 11.14%, making it the most prominent daily loser. Quant lost 9.44% while Nexo lost 8.27%, making them the 2nd and 3rd most prominent daily losers.

Top 10 24-hour Performers (Click to enlarge)

Bottom 10 24-hour Performers (Click to enlarge)

Bitcoin’s market dominance has reduced drastically over the course of the day, with its value is currently staying at 60.06%. This value represents a 2.6% difference to the downside compared to the value it had yesterday.

Daily Crypto Market Cap Chart

The crypto sector capitalization has increased significantly over the course of the day. Its current value is $562.75 billion, representing a $21.04billion increase compared to our previous report.

_______________________________________________________________________

What happened in the past 24 hours?

_______________________________________________________________________

_______________________________________________________________________

Technical analysis

_______________________________________________________________________

Bitcoin

The largest cryptocurrency by market cap has stayed pretty stable today as it couldn’t break the $18,500 mark. The price has been hovering right under the level for the whole day, and even made a couple of attempts to break it but to no avail. On the other hand, this small zone of resistance and support wasn’t broken to the downside either, as a break below $18,270 could spell a retracement.

This is a prime example of uncertainty due to Bitcoin’s current level (some are taking profits while some are investing). However, trading pullbacks in a bull trend is extremely risky and should be avoided.

BTC/USD 4-hour Chart

Bitcoin’s technicals are divided, with its daily and monthly overviews showing a slight hint of bearishness alongside the bullishness that overwhelms it. In contrast, the 4-hour and weekly overviews are completely bullish.

BTC/USD 1-day Technicals

Technical factors (4-hour Chart):
  • Price is above its 50-period EMA and at its 21-period EMA
  • Price is at its middle Bollinger band
  • RSI is neutral (53.88)
  • Volume is average
Key levels to the upside          Key levels to the downside

1: $18500                                  1: $17,850

2: $19000                                  2: $17,450

3: $19500                                   3: $17,130

Ethereum

With Ethereum’s 2.0 version 0 launch approaching, Ethereum has continued to increase in price. Today’s move was a continuation of the uptrend that started on Nov 0, additionally fueled by the announcement that the deposits required for Ethereum’s 2.0 version 0 to launch have passed the threshold. This news is a big sigh of relief for the ETH devs, as they were wondering if the protocol will reach its goal on time for the Dec 1 launch. This extremely bullish news has pushed Ethereum past $600, which it is now testing.

If Ethereum manages to successfully stay above $600, it will have very little resistance to the upside and basically trade only versus profit-taking sellers.

ETH/USD 1-hour Chart

Ethereum’s 4-hour and monthly time-frames are completely bullish, while its daily and weekly time-frames are slightly more tilted towards the neutral position.

ETH/USD 1-day Technicals

Technical Factors (4-hour Chart):
  • The price is far above its 50-period and slightly above its 21-period EMA
  • Price is between its middle and top Bollinger band
  • RSI is coming out of the overbought territory (59.88)
  • Volume is above average
Key levels to the upside          Key levels to the downside

1: $600                                     1: $510

2: $630                                     2: $500 

3: $735                                      3: $490

Ripple

The fourth-largest cryptocurrency by market cap has exploded to the upside and reached over $0.90 on the US cryptocurrency exchange Coinbase only to crash back down by roughly 30% in mere seconds. This was its highest price since May 2018. The rally was apparently driven by the Coinbase users as XRP did not see the same heights on any other exchange. Bitstamp and Binance saw a high of only $0.79.

Analysts believe that this rally is a culmination of an uptrend triggered in late Oct when an anonymous whale sent an astonishing $50 million worth of XRP at the time to Bitstamp. Ever since then, XRP/USD has been seeing a strong uptrend, up by 128.63% in the past week.

Trading XRP is simply impossible at the moment due to the amount of risk associated with this type of volatility.

XRP/USD 1-hour Chart

XRP’s 4-hour and weekly overviews are completely bullish and show no signs of neutrality, while its daily and monthly overviews show slight neutrality or even slight bearishness.

XRP/USD 1-day Technicals

Technical factors (4-hour Chart):
  • The price is above its 50-period EMA and at its 21-period EMA
  • Price is slightly above its middle Bollinger band
  • RSI is neutral (53.65)
  • Volume is above average
Key levels to the upside          Key levels to the downside

1: $0.79                                     1: $0.625 

2: $0.963                                   2: $0.475

3: $1.01                                    3: $0.443


Categories
Crypto Market Analysis

Daily Crypto Review, Nov 23 – Ethereum Exploding as its 2.0 Update Launch Approaches; Crypto Market in the Green

The cryptocurrency sector has spent the weekend being quite volatile as Bitcoin had a flash crash, which brought its price below $18,000, followed by a rally that brought it back above it. The largest cryptocurrency by market cap is currently trading for $18,461, representing an increase of 0.61% on the day. Meanwhile, Ethereum skyrocketed by gaining 8.13% on the day, while XRP gained 0.09%.

 Daily Crypto Sector Heat Map

Waves 38.43% in the past 24 hours, making it the most prominent daily gainer in the top100. It is closely followed by Horizen’s gain of 31.65% and Numeraire’s 21.56% gain. On the other hand, Terra lost 5.45%, making it the most prominent daily loser. HedgeTrade lost 3.22% while Crypto.com Coin lost 1.65%, making them the 2nd and 3rd most prominent daily losers.

Top 10 24-hour Performers (Click to enlarge)

Bottom 10 24-hour Performers (Click to enlarge)

Bitcoin’s market dominance has reduced drastically over the course of the weekend, with its value is currently staying at 63.2%. This value represents a 2.9% difference to the downside compared to the value it had on Friday.

Daily Crypto Market Cap Chart

The crypto sector capitalization has increased significantly over the course of the weekend. Its current value is $541.71 billion, representing a $34.48 billion increase compared to our previous report.

_______________________________________________________________________

What happened in the past 24 hours?

_______________________________________________________________________

_______________________________________________________________________

Technical analysis

_______________________________________________________________________

Bitcoin

The largest cryptocurrency by market cap has spent the weekend with decently high volatility as its price managed to go from above $18,500 to $17,600 and then back above $18,500 in just one day. While this “flash crash” is behind Bitcoin, the bulls seem to be more and more wary of the new highs, and a retracement before another push towards the upside is quite possible.

Due to many people taking profits and shorting Bitcoin to hedge their portfolios, the largest currency has a hard time going up. However, trading pullbacks in a bull trend is equally as risky. Bitcoin traders would have the most chance of succeeding if they traded only long positions.

BTC/USD 2-hour Chart

Bitcoin’s technicals are semi-divided, with its daily and monthly overviews showing a slight bullish tilt with signs of bears still present. In contrast, the 4-hour and weekly overviews show no signs of bearish presence and are completely bullish.

BTC/USD 1-day Technicals

Technical factors (4-hour Chart):
  • Price is above its 50-period EMA and at its 21-period EMA
  • Price is at its middle Bollinger band
  • RSI is neutral (51.42)
  • Volume is average
Key levels to the upside          Key levels to the downside

1: $18500                                  1: $17,850

2: $19000                                  2: $17,450

3: $19500                                   3: $17,130

Ethereum

Ethereum’s 2.0 version 0 launch is approaching, and Ethereum bulls seem to be back in the game. The second-largest cryptocurrency by market cap broke out of the ascending (red) line and pushed towards the upside, eyeing the $600 resistance level. While the rally was strong, Ethereum bulls started showing exhaustion at $580. With that being said, the move is still not considered over, and there is more opportunity to the upside.

We mentioned on Friday that Ethereum’s downside is quite defined, but that its upside isn’t. With ETH entering territory that was explored only a couple of times, the opportunity for volatility (but also slippage) is increasing.

ETH/USD 4-hour Chart

Ethereum’s 4-hour and daily time-frames are completely bullish, while its longer time-frames (weekly and monthly) are slightly more tilted towards the neutral position.

ETH/USD 1-day Technicals

Technical Factors (4-hour Chart):
  • The price is far above both its 50-period and its 21-period EMA
  • Price is at its top Bollinger band
  • RSI is extremely overbought (72.01)
  • Volume is above average
Key levels to the upside          Key levels to the downside

1: $600                                     1: $510

2: $630                                     2: $500 

3: $735                                      3: $490

Ripple

The fourth-largest cryptocurrency by market cap has, just like Ethereum, had quite an amazing weekend. XRP continued its rally to the upside that began on Nov 20 and reached as high as $0.49 before starting to consolidate. While consolidating, it has seemingly created a triangle formation that should keep its price at bay before ~80% of the formation is done.

While it is quite unknown how XRP will act right now, all chances are that it will stay within the triangle formation’s bounds for some time, at least.

XRP/USD 1-hour Chart

XRP’s daily and weekly overviews are completely bullish and show no signs of neutrality, while its 4-hour and monthly overviews show slight neutrality.

XRP/USD 1-day Technicals

Technical factors (4-hour Chart):
  • The price is above its 50-period EMA and at its 21-period EMA
  • Price is slightly above its middle Bollinger band
  • RSI is neutral (53.65)
  • Volume is above average
Key levels to the upside          Key levels to the downside

1: $0.476                                   1: $0.3328 

2: $0.509                                   2: $0.3244

3: $0.792                                  3: $0.31


Categories
Crypto Market Analysis

BTC/USD Weekly Chart Analysis + Possible Outcomes

In this weekly BTC/USD analysis, we will be taking a brief look at the most recent events, current chart technical formations, as well as the possible BTC short-term price outcomes.

Overview

Bitcoin has spent the week constantly pushing towards the upside, with its price moving from around $16,500 on Monday all the way up to $19,000 at one point on Saturday. This left Bitcoin holders in a dilemma: should they hold or hedge their investments. Most holders are already satisfied with the BTC movement and don’t want to invest at such a high price, while some are hedging or even selling their funds to take a profit. On the other hand, such a large rally has “invited” the retail market to join in, and they are the majority of the buy force, alongside institutional investors that do not care about the current price and just want to invest every time they have funds available.

While many analysts called for a stronger pullback long before the most recent push, all significant bear-related signals were false.

Technical factors


Bitcoin has continued moving up, supported by the 50-period MA, which has proven as great support, as well as by the ascending (pink dotted) line. On top of that, the largest cryptocurrency by market cap has done a great job pushing through its previous highs and making higher highs/higher lows. If we consider the year-to-date Bitcoin balance on exchanges dropping 18% and institutions being more and more involved, we can almost certainly expect a long-term price increase.

The hash ribbons indicator is showing miner capitulation (ever since Oct 29), sending out a major buy/accumulation signal.

Likely Outcomes

Bitcoin has one main scenario, as well as one supporting scenario that is likely to play out.

1: If Bitcoin manages to hold the so-called pivot zone (18,250-$18,450), it is almost certain to bounce and reach the all-time high level, and possibly even pass it. In that case, longing Bitcoin after it confirms its position above the pivot zone is a great trade, as it has defined targets (target 1 = Bitcoin’s ATH; target 2 = ride the bull wave and continuously take profit until volume dies out) as well as a defined stop-loss target (right below the pivot zone).

If the first scenario plays out, it will most likely play out on the Nov 23rd, as this is when the pivot zone is meeting the ascending support line and (most likely) the 50-period moving average.

2: The second (and a bit less likely) scenario happens when Bitcoin fails to hold the pivot zone, in which case we can expect a price drop to $17,260.

A move that will end up below $17,260 is highly unlikely, simply due to the overall sentiment currently surrounding Bitcoin.

Categories
Crypto Market Analysis

Daily Crypto Review, Nov 20 – Bitcoin Conquering $18,000: What’s Next in Store?

The cryptocurrency sector has ended up with the majority of cryptos in the green as Bitcoin continued its rally past $18,000. The largest cryptocurrency by market cap is currently trading for $18,095, representing an increase of 1.31% on the day. Meanwhile, Ethereum gained 1.59% on the day, while XRP gained 2.42%.

 Daily Crypto Sector Heat Map

SushiSwap 31.66% in the past 24 hours, making it the most prominent daily gainer out of the top100 cryptos ranked by market capitalization yet again today. It is closely followed by Waves’ gain of 21.42% and CyberVein’s 17.06% gain. On the other hand, Blockstack lost 8.00%, making it the most prominent daily loser. NEM lost 7.73% while ABBC Coin lost 6.77%, making them the 2nd and 3rd most prominent daily losers.

Top 10 24-hour Performers (Click to enlarge)

Bottom 10 24-hour Performers (Click to enlarge)

Bitcoin’s market dominance has reduced slightly over the course of the day, with its value is currently staying at 66.1%. This value represents a 0.2% difference to the downside when compared to the value it had yesterday.

Daily Crypto Market Cap Chart

The crypto sector capitalization has increased over the course of the day. Its current value is $507.23 billion, representing a $12.16 billion increase compared to our previous report.

_______________________________________________________________________

What happened in the past 24 hours?

_______________________________________________________________________

_______________________________________________________________________

Technical analysis

_______________________________________________________________________

Bitcoin

The largest cryptocurrency by market cap has spent the past 24 hours pushing towards and past the $18,000 level after it has won the fight for $17,850. While the move was quite sudden at one point, it was actually not accompanied by a great increase in volume. This has ultimately caused BTC to end its move slightly above $18,200 and start its consolidation phase.

Due to many people taking profits and shorting to hedge their portfolios, Bitcoin has a hard time going up. However, trading pullbacks is equally as risky. Bitcoin traders would have the most chance of success if they traded only pushes to the upside, accompanied by a decent volume increase.

BTC/USD 1-hour Chart

Bitcoin’s technicals on the 4-hour, daily, and monthly time-frame are all bullish but show some signs of neutral presence. On the other hand, its weekly overview is tilted towards the buy-side and doesn’t show any bearishness.

BTC/USD 1-day Technicals

Technical factors (4-hour Chart):
  • Price is above both its 50-period EMA and its 21-period EMA
  • Price is near its top Bollinger band
  • RSI is neutral (57)
  • Volume is slightly below average
Key levels to the upside          Key levels to the downside

1: $18500                                  1: $17,850

2: $19000                                  2: $17,450

3: $19500                                   3: $17,130

Ethereum

Our yesterday’s call for Ethereum traders was that they should wait for the cryptocurrency to confirm its support level or fall under it, and then trade “with the wave.” Ethereum confirmed its position above the yellow dotted line (top line of the ascending channel) and pushed up instantly. The move brought Ether from $470 all the way to $488 before slowing down and starting to consolidate.

While Ethereum’s downside is quite defined, its upside isn’t. Traders should be wary of Ether’s future pushes to the upside, while they should trade any pullback from the retest of the yellow line.

ETH/USD 1-hour Chart

Ethereum’s 4-hour, daily and monthly time-frames are extremely bullish and show no signs of neutrality or bearishness. On the other hand, its weekly overview is still titled to the bull side but does show significant neutrality.

ETH/USD 1-day Technicals

Technical Factors (4-hour Chart):
  • The price is above both its 50-period and its 21-period EMA
  • Price is near its top Bollinger band
  • RSI is neutral after bouncing from almost being overbought(59.32)
  • Volume is average
Key levels to the upside          Key levels to the downside

1: $490                                     1: $470

2: $500                                     2: $451 

3: $510                                      3: $445

Ripple

The fourth-largest cryptocurrency by market cap has spent the day breaking out of its slow price descent and pushing towards the upside. XRP first changed its price direction at $0.284 and quickly pushed towards the upside, reaching as high as $0.306. However, that price did not hold up, and XRP started trading sideways around the $0.3 mark.

XRP traders should still be safe to trade within the range bound by $0.2855 and $0.31. However, since the range is quite large, traders would be even better if they could spot additional small buy/sell walls in the order books before blindly trading.

XRP/USD 1-hour Chart

XRP’s daily and weekly overviews are completely bullish and show no signs of neutrality, while its 4-hour and monthly overviews show slight neutrality.

XRP/USD 1-day Technicals

Technical factors (4-hour Chart):
  • The price is above its 50-period EMA and at its 21-period EMA
  • Price is near its middle Bollinger band
  • RSI is neutral (53.74)
  • Volume is average
Key levels to the upside          Key levels to the downside

1: $0.31                                     1: $0.28 

2: $0.3244                                 2: $0.27

3: $0.3328                                3: $0.266


Categories
Crypto Market Analysis

Daily Crypto Review, Nov 19 – Ethereum 2.0 Most Likely Not Launching on Time; Crypto Sector Consolidating

The cryptocurrency sector has spent the day trying to consolidate after Bitcoin finished its rally. However, while most cryptocurrencies moved less than 1%, almost every one of them ended up in the red. The largest cryptocurrency by market cap is currently trading for $17,708, representing a decrease of 0.73% on the day. Meanwhile, Ethereum lost 0.49% on the day, while XRP lost 1.53%.

 Daily Crypto Sector Heat Map

OKB gained 17.77% in the past 24 hours, making it the most prominent daily gainer out of the top100 cryptos ranked by market capitalization yet again today. It is closely followed by yearn.finance’s gain of 12.48% and SushiSwap’s 11.73% gain. On the other hand, Band Protocol lost 10.00%, making it the most prominent daily loser. Ampleforth lost 9.81% while Aragon lost 7.26%, making them the 2nd and 3rd most prominent daily losers.

Top 10 24-hour Performers (Click to enlarge)

Bottom 10 24-hour Performers (Click to enlarge)

Bitcoin’s market dominance has stayed at exactly the same place over the course of the day, with its value is currently staying at 66.3%. This value represents no difference when compared to the value it had yesterday.

Daily Crypto Market Cap Chart

The crypto sector capitalization has stayed at the same place over the course of the day. Its current value is $495.07 billion, representing a $3.01 billion decrease compared to our previous report.

_______________________________________________________________________

What happened in the past 24 hours?

_______________________________________________________________________

_______________________________________________________________________

Technical analysis

_______________________________________________________________________

Bitcoin

While it may seem that Bitcoin has had a pretty slow and uneventful day, that is certainly not the case. The largest cryptocurrency by market cap has spent the past 24 hours fighting for the $17,850 level and constantly going over and under it. However, the battle is finished, and BTC remains below $17,850 for the time being.

Many traders and analysts are warning BTC traders of a potential triangle formation forming. They also advise traders to refrain from trading until BTC chooses a clear direction.

BTC/USD 1-hour Chart

Bitcoin’s technicals on the daily, weekly, and monthly time-frame are all bullish but show signs of neutral presence. On the other hand, its 4-hour overview is tilted towards the buy-side and doesn’t show any bearishness.

BTC/USD 1-day Technicals

Technical factors (4-hour Chart):
  • Price is slightly above its 50-period EMA and below its 21-period EMA
  • Price is slightly below its middle Bollinger band
  • RSI is neutral (44.71)
  • Volume is slightly below average
Key levels to the upside          Key levels to the downside

1: $18500                                  1: $17,850

2: $19000                                  2: $17,450

3: $19500                                   3: $17,130

Ethereum

Ethereum has established itself above the top line of the ascending channel (yellow dotted line) and is now trading within a new range, bound by the yellow line as support and a new ascending trend line as resistance. Ethereum’s price seems to be in a correction phase at the moment, so we can expect a retest of the yellow line as well as a possible sharp move afterward.

Ethereum traders should wait for the cryptocurrency to confirm its support level or fall under it, and then trade “with the wave.”

ETH/USD 1-hour Chart

Ethereum’s time-frames are slightly tilted towards the buy-side, with its daily overview showing slight bear presence, while its 4-hour and weekly overviews are showing slight neutrality. On the other hand, its monthly overview is completely bullish.

ETH/USD 1-day Technicals

Technical Factors (4-hour Chart):
  • The price is below both its 50-period and its 21-period EMA
  • Price is between its middle and bottom Bollinger band
  • RSI is neutral (41.77)
  • Volume is slightly below average
Key levels to the upside          Key levels to the downside

1: $490                                     1: $470

2: $500                                     2: $451 

3: $510                                      3: $445

Ripple

The fourth-largest cryptocurrency by market cap had another day of slowly marching towards the downside. However, the extremely low volume may be suggesting that the current price movement is a “calm before the storm,” and that a new big move is coming. Analysts are calling for another push towards the upside. Still, a move down is just as likely with the current state of the sector (the crypto sector is currently in a consolidation/correction phase).

XRP/USD 1-hour Chart

XRP’s daily and weekly overviews are completely bullish and show no signs of neutrality or bearishness. On the other hand, its 4-hour and monthly overviews show slight neutrality.

XRP/USD 1-day Technicals

Technical factors (4-hour Chart):
  • The price is below both its 50-period EMA and its 21-period EMA
  • Price is slightly below its middle Bollinger band
  • RSI is pushing towards being oversold (39.45)
  • Volume is below average
Key levels to the upside          Key levels to the downside

1: $0.31                                     1: $0.28 

2: $0.3244                                 2: $0.27

3: $0.3328                                3: $0.266


Categories
Crypto Market Analysis

Daily Crypto Review, Nov 18 – Bitcoin Encounters Heavy Resistance at $18,500: What Happens Next?

The cryptocurrency sector has spent the day mostly stable and looking at Bitcoin as it kept pushing towards highs unseen after the bull run of late 2017. The largest cryptocurrency by market cap is currently trading for $17.829, representing an increase of 6.64% on the day. Meanwhile, Ethereum gained 2.00% on the day, while XRP lost 1.90%.

 Daily Crypto Sector Heat Map

Nexo gained 14.37% in the past 24 hours, making it the most prominent daily gainer out of the top100 cryptos ranked by market capitalization yet again today. It is closely followed by Bitcoin Gold’s gain of 10.84% and DigiByte’s 9.52% gain. On the other hand, SushiSwap lost 12.92%, making it the most prominent daily loser. Curve DAO Token lost 10.74% while HedgeTrade lost 10.07%, making them the 2nd and 3rd most prominent daily losers.

Top 10 24-hour Performers (Click to enlarge)

Bottom 10 24-hour Performers (Click to enlarge)

Bitcoin’s market dominance has skyrocketed over the course of the day, with its value is currently staying at 66.3%. This value represents a 1.4% difference to the upside compared to the value it had yesterday.

Daily Crypto Market Cap Chart

The crypto sector capitalization has gone up quite a bit over the course of the day. Its current value is $498.06 billion, representing a $20.84 billion increase compared to our previous report.

_______________________________________________________________________

What happened in the past 24 hours?

_______________________________________________________________________

_______________________________________________________________________

Technical analysis

_______________________________________________________________________

Bitcoin

Bitcoin has had a parabolic run to the upside, reaching as high as $18,500 before dropping down. While the price gain was gradual at first, Bitcoin’s final push from $17,600 to $18,500 and then back to nearly $17,000 happened in just a couple of hours. This volatility came to be because BTC encountered heavy resistance at the now-confirmed $18,500 resistance level. Many traders call this move just a temporary pullback before a new high, while a minority is calling a short-term top.

Trading Bitcoin on a bull trend such as this one should only happen in one direction, and that is WITH the trend. Shorting Bitcoin and attempting to catch pullbacks will be far less lucrative due to the size of the move, as well as much riskier.

BTC/USD 1-hour Chart

Bitcoin’s technicals on the 4-hour, daily, and weekly time-frame are all completely bullish and show no signs of bear or neutral presence. On the other hand, its monthly overview is tilted towards the buy-side just slightly and does show some bearishness.

BTC/USD 1-day Technicals

Technical factors (4-hour Chart):
  • Price is far above its 50-period EMA and above its 21-period EMA
  • Price is between its middle and top Bollinger band
  • RSI is stabilizing after leaving the overbought territory (61.38)
  • Volume is descending
Key levels to the upside          Key levels to the downside

1: $18500                                  1: $17,850

2: $19000                                  2: $17,450

3: $19500                                   3: $17,130

Ethereum

Ethereum had had a turbulent 24 hour period, as its price went from fighting for and hovering over the top line of the ascending channel all the way to $495 and then back to $455 before it stabilized at around $475. This move has clearly shown the market another ascending line (red) formed on the ETH/USD chart, which has been tested a couple of times already. This line is Ethereum’s final resistance towards $500.

Ethereum should, as most cryptos at the moment, be traded only to the upside, as trading its pullbacks during a bull market is simply not worth it.

ETH/USD 2-hour Chart

Ethereum’s weekly time-frame shows some neutrality alongside its overall bullish stance, while the other time-frames show complete bullishness.

ETH/USD 1-day Technicals

Technical Factors (4-hour Chart):
  • The price is above both its 50-period and its 21-period EMA
  • Price is slightly above its middle Bollinger band
  • RSI is neutral (55.77)
  • Volume is above average
Key levels to the upside          Key levels to the downside

1: $490                                     1: $470

2: $500                                     2: $451 

3: $510                                      3: $445

Ripple

The fourth-largest cryptocurrency by market cap started off the day by pushing towards the upside and almost reaching its $0.31 resistance level. However, the bears have stepped in and brought XRP’s price down to $0.28 before consolidating in the middle of the range between the two aforementioned levels.

If Bitcoin doesn’t make another sharp move in the short-term, XRP is (yet again) sideways-action crypto. However, if BTC moves, it’s safest to watch Bitcoin and trade along with the bullish moves while discarding the bearish entries.

XRP/USD 4-hour Chart

XRP’s 4-hour, daily, and weekly technicals are tilted towards the buy-side, and while they aren’t showing signs of neutrality, the bullish sentiment isn’t as strong either. The monthly overview does, on the other hand, show clear signs of neutrality.

XRP/USD 1-day Technicals

Technical factors (4-hour Chart):
  • The price is above its 50-period EMA and at its 21-period EMA
  • Price is at its middle Bollinger band
  • RSI is neutral (54.33)
  • Volume is above average
Key levels to the upside          Key levels to the downside

1: $0.31                                     1: $0.28 

2: $0.3244                                 2: $0.27

3: $0.3328                                3: $0.266


Categories
Crypto Market Analysis

Daily Crypto Review, Nov 17 – Bitcoin Crushes $16,500; XRP Explodes to the Upside

The cryptocurrency sector has spent the day trying to reach past its recent highs as Bitcoin pushed past $16,500. The largest cryptocurrency by market cap is currently trading for $16,718, representing an increase of 2.97% on the day. Meanwhile, Ethereum gained 2.34% on the day, while XRP gained an astonishing 10.46%.

 Daily Crypto Sector Heat Map

Curve DAO Token gained 14.27% in the past 24 hours, making it the most prominent daily gainer out of the top100 cryptos ranked by market capitalization yet again today. It is closely followed by yearn.finance’s gain of 12.92% and Litecoin’s 10.99% gain. On the other hand, THORChain lost 7.28%, making it the most prominent daily loser. The Midas Touch Gold lost 6.16% while Uniswap lost 4.22%, making them the 2nd and 3rd most prominent daily losers.

Top 10 24-hour Performers (Click to enlarge)

Bottom 10 24-hour Performers (Click to enlarge)

Bitcoin’s market dominance has decreased slightly over the course of the day, with its value is currently staying at 64.9%. This value represents a 0.1% difference to the downside compared to the value it had yesterday.

Daily Crypto Market Cap Chart

The crypto sector capitalization has gone up very slightly over the course of the day. Its current value is $477.28 billion, representing a $13.89 billion increase compared to our previous report.

_______________________________________________________________________

What happened in the past 24 hours?

_______________________________________________________________________

_______________________________________________________________________

Technical analysis

_______________________________________________________________________

Bitcoin

After confirming its stance above $16,000 after fighting for it over the weekend, the largest cryptocurrency by market capitalization pushed towards $16,500 and attempted to reach new highs. The push was strong as there was no real sell pressure, so Bitcoin reached past $16,500 (and eventually past $16,700) without any real increase in volume. While the $16,500 position has been successfully tested once, the $16,700 level is still not completely won.

Trading Bitcoin on a bull trend such as this one should only happen in one direction: WITH the trend. Shorting Bitcoin and trying to catch pullbacks will be less lucrative due to the size of the move, as well as riskier due to the market sentiment.

BTC/USD 4-hour Chart

Bitcoin’s technicals are tilted towards the buy-side on all four time-frames (4-hour, daily, weekly, and monthly). However, all of them have some form of neutrality, implying that the bullish sentiment is not absolute.

BTC/USD 1-day Technicals

Technical factors (4-hour Chart):
  • Price is far above its 50-period EMA and its 21-period EMA
  • Price is near its top Bollinger band
  • RSI is approaching the overbought territory (65.02)
  • Volume is average
Key levels to the upside          Key levels to the downside

1: $17,000                                 1: $16,700

2: $18000                                  2: $16,500

3: $18500                                   3: $16,000

Ethereum

Ethereum has spent the past two days slowly moving towards the top line of the ascending channel after pulling back to $440. The move was gradual but saw some resistance when it reached the top line. However, Ethereum bulls endured and ultimately broke the level but got instantly stuck at the $470 resistance, which is another wall they have to jump over to remain above this channel.

If Ethereum’s struggles to break the $470 level continue, we may expect a pullback of some sort. With that being said, due to the overall sentiment towards Ethereum (and its 2.0 implementation) as well as the state of the crypto sector, shorting Ethereum should not be a proper trading strategy, even if ETH does pull back.

ETH/USD 4-hour Chart

Ethereum’s 1-day technicals are slightly bullish but are showing signs of neutrality. On the other hand, its 4-hour, weekly, and monthly overviews are completely tilted towards the buy-side.

ETH/USD 1-day Technicals

Technical Factors (4-hour Chart):
  • The price is above both its 50-period and its 21-period EMA
  • Price is slightly above its middle Bollinger band
  • RSI is neutral (57.54)
  • Volume is average
Key levels to the upside          Key levels to the downside

1: $470                                     1: $451

2: $490                                     2: $445 

3: $500                                      3: $420

Ripple

The fourth-largest cryptocurrency by market cap had yet another incredible day, with its price pushing past the $0.27 and even $0.2855 resistance levels. An incredible bull wave brought XRP’s price to $0.3 before it started to pull back slightly. This move has pushed XRP further up towards being the best-performing asset over a 1-week period compared to BTC and ETH, with gains of 18% this week, compared to BTC’s gains of 2.95 and ETH’s gains of 0.76.

Traders can finally look at XRP as a cryptocurrency that isn’t just used for sideways trading, and look for opportunities near new highs.

XRP/USD 4-hour Chart

XRP’s 4-hour, daily, and monthly technicals are slightly tilted towards the buy-side, and all of them are showing more or less signs of neutrality. The weekly overview is, on the other hand, completely bullish.

XRP/USD 1-day Technicals

Technical factors (4-hour Chart):
  • The price is above its 50-period EMA and its 21-period EMA
  • Price is at its top Bollinger band
  • RSI is heavily overbought (76.99)
  • Volume is above average
Key levels to the upside          Key levels to the downside

1: $0.31                                     1: $0.2855 

2: $0.3244                                 2: $0.27

3: $0.3328                                3: $0.266


Categories
Crypto Guides

Will Audius be the Next Spotify?

Introduction

Nowadays, advanced technology has made it possible for everyone to showcase their talent in front of the whole world without hassle. The Internet also provides you with a platform where you can gain fame and recognition within no time. For both these purposes, you just need three basic things: incomparable talent, correct stage, and proper strategy. While skill and strategy rely entirely on you, finding the right platform has become easy with Audius.

Don’t worry if you haven’t heard the name Audius before. We have collected all the information about this new title in the music industry. So you will be able to see how it can change your life. Let’s get into the details.

What Is Audius?

If you are aware of the concept of Ethereum, that runs the cryptocurrency Ether, it will be convenient for you to understand Audius. Ethereum has used its blockchain-based set up to provide this music streaming service to everyone in the world. Audius promotes its motto that states, “We give everyone the freedom to share and listen.”

Basically, Audius is a music streaming platform that runs on blockchain and provides ample opportunities to everyone who wishes to share their music with the world. This means it has eliminated the hassle and process of indulging with major labels and corporations for music production. Therefore, artists can share their music with their intended audience without any middlemen.

How Does Audius Work?

Audius seems to work the same way as Spotify or SoundCloud. A few steps involved in using this platform include:

Buying Tokens: There is a concept of Audius Tokens that both artists and listeners should be aware of. Being a user, you can either spend money to buy these tokens or earn them just by listening to the ads.

Spend and Listen: Once you have tokens in your wallet, you can use them to listen to your favorite music. For each song that you listen to, a fraction of a cent will get cut from the total amount.

That was from the perspective of the listeners. When we talk about the artists, they will get approximately 85% of the entire money earned on their music. This percentage is higher than almost all similar apps that offer a maximum of 70% cut.

The remaining 15% of the amount will be given to the following people:

  • Song host
  • Audius developers
  • Other associated people

What Is The Benefit Of Audius?

The primary benefit of Audius is that artists can conveniently showcase their talent to the world, while listeners can get a chance to explore more diverse music. However, this isn’t the only perk of this platform.

When we talk about the music industry, most artists often get stuck between corporations and big labels. Most of the earnings on music are taken by these middlemen, leaving a minimal cut for the artists. But with the help of Audius, they can get almost 85% of the total revenue generated by their song. Hence, they will get paid well for their efforts and talent.

All in all, Audius is an excellent initiative by Ethereum because it will be beneficial for both artists and listeners. So there won’t be any hassle or complications associated with producing some quality music.

Categories
Crypto Market Analysis

Daily Crypto Review, Nov 16 – Bitcoin to be Censored? Blockseer Mining Pool Enters the Game

The cryptocurrency sector has spent the weekend pretty flat as Bitcoin was experiencing a period of low volatility. The largest cryptocurrency by market cap is currently trading for $16,272, representing an increase of 1.37% on the day. Meanwhile, Ethereum lost 1.19% on the day, while XRP lost 0.69%.

 Daily Crypto Sector Heat Map

SushiSwap gained 13.81% in the past 24 hours, making it the most prominent daily gainer out of the top100 cryptos ranked by market capitalization yet again today. It is closely followed by THORChain’s gain of 9.54% and Curve DAO Token’s 4.80% gain. On the other hand, ABBC Coin lost 45.16%, making it the most prominent daily loser. The Midas Touch Gold lost 8.96% while Ampleforth lost 8.88%, making them the 2nd and 3rd most prominent daily losers.

Top 10 24-hour Performers (Click to enlarge)

Bottom 10 24-hour Performers (Click to enlarge)

Bitcoin’s market dominance has decreased slightly over the weekend, with its value is currently staying at 65%. This value represents a 0.3% difference to the downside compared to the value it had on Friday.

Daily Crypto Market Cap Chart

The crypto sector capitalization has gone up very slightly over the course of the weekend. Its current value is $463.37 billion, representing an $0.51 billion increase compared to our previous report.

_______________________________________________________________________

What happened in the past 24 hours?

_______________________________________________________________________

Blockseer, a US-based DMG Blockchain Solutions’ subsidiary, has recently announced a private beta version of a brand new Bitcoin mining pool. This particular mining pool is, however, quite unique and different. The Blockseer Mining Pool will, unlike any other mining pool, censor transactions from wallets that are blacklisted. They also plan on mandating the miners to undergo KYC procedure, according to marketing materials.

Any new blocks generated by the Blockseer pool will include only filtered transactions, and the filters will be based on the Walletscore’s data.

While some agree that this way of transacting might be the future, the vast majority of public figures say that this is pure censorship and that it goes against the basic principles of Bitcoin as a free cryptocurrency, where a transaction is a transaction, no matter where it comes from.

_______________________________________________________________________

Technical analysis

_______________________________________________________________________

Bitcoin

The largest cryptocurrency by market capitalization has spent the weekend experiencing very low volatility while fighting an incredibly important battle. Bitcoin was fighting to stay above the $16,000 mark after the move to the upside has died down at $16,500 on Nov 13, thus triggering a pullback.

An interesting outlook on Bitcoin is that the now won fight for $16,000 has created a higher low, and Bitcoin might push even higher in the following days. Traders should pay attention to volume increases around the $16,400-$16,500 mark.

BTC/USD 4-hour Chart

Bitcoin’s technicals are tilted slightly to the buy-side on the 4-hour, daily and weekly time-frames. However, all of these time-frames show signs of neutrality. On the other hand, its monthly overview is completely bullish.

BTC/USD 1-day Technicals

Technical factors (4-hour Chart):
  • Price is above its 50-period EMA and at its 21-period EMA
  • Price is near its middle Bollinger band
  • RSI is neutral (58.99)
  • Volume is slightly above average
Key levels to the upside          Key levels to the downside

1: $16,500                                 1: $16,000

2: $16,700                                 2: $15,480

3: $17,000                                  3: $14,640

Ethereum

Ethereum has, just like Bitcoin, spent the weekend fighting to stay above its support level. The second-largest cryptocurrency by market cap, however, did not manage to win its fight. Ether has triggered a pullback after bouncing from the $478 level, which caused its price to first hover around the yellow top ascending channel line until it finally broke it to the downside. The move was stopped at $440, and Ethereum has since recovered and is currently trading just below the yellow line.

Our call on Friday for Ethereum dropping below the line was correct, as ETH did exactly as expected. However, the combination of factors at the moment make Ethereum a not-so-good trade, and traders should perhaps look at other options before choosing to trade it.

ETH/USD 4-hour Chart

Ethereum’s technicals are extremely bullish on its weekly and monthly time-frames and very bullish (but not as much as the aforementioned time-frames) on its daily overview. Its 4-hour overview, however, is tilted heavily towards the sell-side.

ETH/USD 1-day Technicals

Technical Factors (4-hour Chart):
  • The price is slightly above its 50-period and slightly below its 21-period EMA
  • Price is slightly below its middle Bollinger band
  • RSI is neutral (47.32)
  • Volume is average
Key levels to the upside          Key levels to the downside

1: $470                                     1: $451

2: $490                                     2: $445 

3: $500                                      3: $420

Ripple

The fourth-largest cryptocurrency by market cap had an incredible day on Friday, as its price pushed above 2 of its major resistance levels. XRP has managed to, in a span of around 12 hours, push past the $0.26 and $0.266 levels and took the weekend to consolidate above them and create a strong foundation. The $0.266 level was tested as support twice already, successfully both times.

Traders can finally look at XRP as a crypto that moves somewhere else than sideways, and look for opportunities in places other than the range between $0.2454 and $0.26.

XRP/USD 4-hour Chart

XRP’s technicals are slightly tilted towards the buy-side on all time-frames, with more or less neutrality signs. The important change from the last report (and many reports before) is XRP’s monthly overview, which has finally turned bullish.

XRP/USD 1-day Technicals

Technical factors (4-hour Chart):
  • The price is above its 50-period EMA and slightly above at its 21-period EMA
  • Price is between its middle and top Bollinger band
  • RSI is neutral (59.63)
  • Volume is average
Key levels to the upside          Key levels to the downside

1: $0.27                                     1: $0.266

2: $0.2855                                 2: $0.26

3: $0.31                                    3: $0.2454


Categories
Crypto Market Analysis

BTC/USD Weekly Chart Overview + Possible Outcomes

In this weekly BTC/USD analysis, we will be taking a brief look at the most recent events, the current chart technical formations, as well as the possible BTC price outcomes.

Overview

Bitcoin has spent the week building an ascending channel that took its price from the $14,640 level all the way to $16,500. However, the new levels are mostly unexplored (apart from the late 2017 mini-bubble), and people that already invested in Bitcoin are either holding or taking profits, while new investors are wary of entering due to the price reaching this high. This left Bitcoin with a lot of people holding, a minority taking profit, and even a smaller minority wanting to buy it at $16,500 at the moment, which triggered a pullback. This doesn’t mean that $16,500 is an overestimate of Bitcoin’s worth, but rather that the economic uncertainty around the new US presidency, an unstable stock market as well as regulatory bodies honing in on crypto are all factors in the current minor pullback.

Our previous weekly analysis has predicted the price increase to $16,500 as well as the pullback. This doesn’t mean that the bull season has ended or that bears have taken over for good, but rather that BTC entered a healthy correction phase before establishing a new price target.

Technical factors


Bitcoin has continued moving along the ascending channel started on Nov 7 and gaining in value up until the $16,500 resistance level that we called out. This level has triggered a pullback as BTC could not pass the zone of resistance. While the pullback was mostly sideways and slow, a confirmation of a real pullback happening occurred on Nov 14, when Bitcoin dropped out of the ascending channel as well as below the $16,000 psychological level.

While Bitcoin’s sentiment is extremely bullish overall, its short-term overview points to a pullback that will most likely end at the zone of support near the $15,480 level.

The hash ribbons indicator is still showing miner capitulation (ever since Oct 29), sending out a major buy signal.

Likely Outcomes

Bitcoin has one main scenario that is most likely to play out, which is its price continuing down towards the $15,480 area where it will encounter strong support, which will most likely stop it from going further down. If this happens and Bitcoin does bounce off of the $15,480 area, we may expect another push towards the recently-made highs. In this case, traders should have a clear path towards $16,500 again, and they should pay attention to BTC, possibly making a double top at its most recent high rather than surpassing the level.

A move that will end up below $15,480 is highly unlikely, simply due to the overall sentiment currently surrounding Bitcoin. However, as unlikely as it is, anything is possible, and Bitcoin might fall below the support level. In that case, traders can expect a sharp price decrease and a possible push towards the $14,640.

Categories
Crypto Market Analysis

Daily Crypto Review, Nov 13 – Bitcoin Above $16,000: What’s Next?

The cryptocurrency sector has spent the day equally divided between cryptos that ended up in the red and the green. The largest cryptocurrency by market cap pushed past its $16,000 mark and is currently trading for $16,291, representing an increase of 3.26% on the day. Meanwhile, Ethereum lost 0.15% on the day, while XRP gained 0.45%.

 Daily Crypto Sector Heat Map

Blockstack gained 33.78% in the past 24 hours, making it the most prominent daily gainer out of the top100 cryptos ranked by market capitalization yet again today. It is closely followed by Dash’s gain of 13.33% and Decred’s 8.98% gain. On the other hand, ABBC Coin lost 12.08%, making it the most prominent daily loser. Ampleforth lost 11.75% while Aragon lost 10.85%, making them the 2nd and 3rd most prominent daily losers.

Top 10 24-hour Performers (Click to enlarge)

Bottom 10 24-hour Performers (Click to enlarge)

Bitcoin’s market dominance has increased since we last reported, with its value is currently staying at 65.3%. This value represents a 0.8% difference to the upside compared to the value it had yesterday.

Daily Crypto Market Cap Chart

The crypto sector capitalization has gone up over the course of the day. Its current value is $462.86 billion, representing an $8.70 billion increase compared to our previous report.

_______________________________________________________________________

What happened in the past 24 hours?

_______________________________________________________________________

_______________________________________________________________________

Technical analysis

_______________________________________________________________________

Bitcoin

The largest cryptocurrency by market capitalization has tested the $16,000 mark for a long time, failing a couple of times as profit-taking chipped away too much bull power. However, BTC has officially broken the $16,000 resistance today, turning it into support. The move that pushed it past this mark has ended right at the $16,500 resistance, which held up quite well. Many say the reason for the move past $16,000 is that banks and firms are moving their funds into BTC due to uncertainties in the traditional markets (major indexes traded slightly in the red yesterday). An engulfing candle that followed the last green candle of the move, as well as RSI bouncing off of the overbought area, show that a correction is the most likely option at the moment.

Slow and steady increases in volume accompanied each of Bitcoin’s moves. Traders can use this info to enter and exit trades safely.

BTC/USD 4-hour Chart

Bitcoin’s technicals are bullish overall but are split between the 4-hour and weekly time-frames, which are more tilted towards the neutral position, and daily and monthly time-frames, which are completely bullish.

BTC/USD 1-day Technicals

Technical factors (4-hour Chart):
  • Price is well above its 50-period EMA and its 21-period EMA
  • Price is near its top Bollinger band
  • RSI is near the overbought territory (64.03)
  • Volume is slightly above average
Key levels to the upside          Key levels to the downside

1: $16,500                                 1: $16,000

2: $16,700                                 2: $15,480

3: $17,000                                  3: $14,640

Ethereum

Ethereum has continued its upward path, supported by its ascending channel top line. The second-largest cryptocurrency by market cap managed to hold itself above this level, effectively slowly increasing in price due to the slope of the support line. However, it is yet to be seen if ETH can stay above this level for long, and a potential drop below the line is quite possible.

Ethereum traders should look for ETH dropping below the top line of the ascending channel and trade off of that.

ETH/USD 4-hour Chart

Ethereum’s technicals are bullish on all time-frames, with its 4-hour time-frame being more tilted towards the neutral position and longer time-frames being completely bullish.

ETH/USD 1-day Technicals

Technical Factors (4-hour Chart):
  • The price is above its 50-period and slightly above its 21-period EMA
  • Price is slightly above its middle Bollinger band
  • RSI is neutral (53.64)
  • Volume is average
Key levels to the upside          Key levels to the downside

1: $470                                     1: $451

2: $490                                     2: $445 

3: $500                                      3: $420

Ripple

The fourth-largest cryptocurrency by market cap has had a slow day of sideways action within the range it is in for almost a week. XRP has moved slightly towards the middle of the range after it failed to break the $0.26 resistance level, entering a period of low volatility.

Traders shouldn’t really be interested in XRP at the moment due to its low volatility. However, those that want to trade XRP can enter trades with targets and stop-losses that correspond to the current support/resistance levels.

XRP/USD 4-hour Chart

XRP’s technicals on the 4-hour and daily time-frame have changed its stance from bullish/neutral to straight bullish, while its weekly time-frame is still almost completely neutral. Its monthly overview shows strong bearish sentiment.

XRP/USD 1-day Technicals

Technical factors (4-hour Chart):
  • The price is above its 50-period EMA and at its 21-period EMA
  • Price is at its middle Bollinger band
  • RSI is neutral (50.34)
  • Volume is slightly below average
Key levels to the upside          Key levels to the downside

1: $0.26                                     1: $0.2454

2: $0.266                                   2: $0.235

3: $0.27                                    3: $0.227


Categories
Crypto Guides

Heard of Suterusu? One of the most interesting cryptocurrency!

Introduction

Cryptocurrencies have come into the limelight even since Bitcoin hyped in the market. As the demand for cryptocurrency increased, a few new names also joined the list. One of the well-known titles from those is Suterusu. It is a bit different from the usual cryptocurrencies, which makes it more exciting and beneficial for people.

You may or may not have earlier heard about Suterusu. Either way, we are here to help you out. Here, we have brought all the crucial information about Suterusu to help you learn more about it, making the concept clearer to you. So without further ado, let’s begin with the details.

What Is Suterusu?

Security and anonymity is a big concern for almost all blockchain platforms. In order to resolve this, Suterusu has brought in a new concept. It allows these blockchain developers to implement an additional layer of zk-SNARK-based privacy without any hassle. That is why its motto of “launchpad for privacy-preserving interoperable blockchain” gets appropriately fulfilled.

In other words, Suterusu helps bring new privacy to blockchain platforms or apps that match the ZCash level. Moreover, they need not implement this security layer to their protocol level. Therefore, even mainstream blockchains like Ether, Bitcoin, and Decentralized Finance can benefit from this new concept.

How Is Suterusu Different From Other zk-SNARK Implementations?

The other applications of zk-SNARK called for the need for one of the following:

  • Logarithmic proof sizes
  • Trusted setup: Under this, a set of original parameters are created. These are further used to generate a key, which makes and verifies the proofs of future transactions within the network.

These two factors contradict the anonymous cryptocurrency’s transparent and decentralized nature.

On the other hand, Suterusu undertakes zk-SNARK’s updated version to get rid of both of these concerns. This version is called zk-ConSNARK. So, basically, there is no trust set up promoted by Suterusu that destroys the trusted set up entirely and keeps the proof size low. It not only amplifies the throughput but also maintains security and privacy by keeping the transaction participants anonymous.

What Is Suterusu’s Cryptocurrency?

Suterusu runs its own cryptocurrency named the SUTER Token, which has a total of 10 billion supply. It is further divided into percentages made for different sections:

  • Suterusu’s team has over 4.8% of the tokens.
  • 2% of the tokes are specified for the foundation.
  • 16% of the total tokens are for participants of a private sale.
  • Stake miners can go up to 76% tokens.

Like any other cryptocurrency, SUTER is also subjected to an annual supply halve seen every couple of years. Moreover, these tokens have the lowest inflation rate as compared to other anonymous coins in the market.

In case you want to run a validator node for Suterusu, you will need to deposit at least 1 million SUTER Tokens. Based on your mortgage token and voting token, your mining power will be determined. Further, this will decide the total reward you can receive as a validator node.

Conclusion

By maintaining the anonymity factor, Suterusu has a high chance of becoming the next big thing in the cryptocurrency market. Now that you have learned its basics, we recommend you to get into more details and see how to benefit from this rising concept.

Categories
Crypto Market Analysis

Daily Crypto Review, Nov 12 – Bitcoin Formed a Triple Top? Ethereum Accidentally Hard Forks

The cryptocurrency sector has spent the day mostly consolidating, with roughly the same amount of cryptocurrencies ending the day in the green and the red. The largest cryptocurrency by market cap is currently trading for $15,802, representing an increase of 2.68% on the day. Meanwhile, Ethereum gained 0.24% on the day, while XRP gained 0.60%.

 Daily Crypto Sector Heat Map

Blockstack gained 17.15% in the past 24 hours, making it the most prominent daily gainer out of the top100 cryptos ranked by market capitalization. It is closely followed by OMG Network’s gain of 12.03% and ICON’s 11.46% gain. On the other hand, yearn.finance lost 10.37%, making it the most prominent daily loser. Loopring lost 9.34% while Synthetix lost 8.90%, making them the 2nd and 3rd most prominent daily losers.

Top 10 24-hour Performers (Click to enlarge)

Bottom 10 24-hour Performers (Click to enlarge)

Bitcoin’s market dominance has increased slightly since we last reported, with its value is currently staying at 64.5%. This value represents a 0.6% difference to the upside compared to the value it had yesterday.

Daily Crypto Market Cap Chart

The crypto sector capitalization has gone up over the course of the day. Its current value is $454.16 billion, representing an $8.04 billion increase compared to our previous report.

_______________________________________________________________________

What happened in the past 24 hours?

_______________________________________________________________________

Ethereum had quite a bad day, as its consensus reached an unexpected hard fork. This issue is considered the one holding the most weight ever since the DAO debacle from 4 years ago. The developers are still looking into the issue, and things will be fully understood at a later date.

Ethereum essentially hard forked right when its developers introduced a new update to the chain, and those who haven’t upgraded yet (including Blockchair, Infura, and other miners) got stuck in a minority chain for around 30 blocks (2 hours).

_______________________________________________________________________

Technical analysis

_______________________________________________________________________

Bitcoin

The largest cryptocurrency by market capitalization has pushed towards the upside, reaching as far as $15,990 but not being able to break the $16,000 mark. This failure to break its immediate resistance level has caused another (third) top to form, marking a possible short-term trend reversal as a possibility if Bitcoin doesn’t move up quickly.

Traders should trade carefully around this level and be prepared to trade the pullback or the spike. While these “, ride the trend” trades are hard to predict in terms of when they start, they are easy to trade once the entry happens.

BTC/USD 4-hour Chart

Bitcoin’s technicals are bullish on all time-frames. However, its 4-hour and monthly time-frames are completely bullish, while its daily and weekly overviews are showing signs of neutrality or even slight bear presence.

BTC/USD 1-day Technicals

Technical factors (4-hour Chart):
  • Price is above its 50-period EMA and slightly above its 21-period EMA
  • Price is slightly above its middle Bollinger band
  • RSI is near the overbought territory (64.15)
  • Volume is slightly above average
Key levels to the upside          Key levels to the downside

1: $16,000                                 1: $15,480

2: $16,400                                 2: $14,640

3: $16,700                                  3: $14,100

Ethereum

Ethereum has stayed above the top line of its ascending channel but could not break the resistance zone above $470. However, its price didn’t react negatively to the news of the algorithm failure and an unplanned mini hard fork, which is quite a bullish outcome of events.

Ethereum traders should watch out for how the second-largest cryptocurrency by market cap navigates the range between the top line of the ascending channel and its $470 resistance level.

ETH/USD 4-hour Chart

Ethereum’s technicals are bullish on all time-frames, with its 4-hour and monthly time-frames being completely bullish and its daily and weekly overviews showing signs of neutrality or even slight bear presence.

ETH/USD 1-day Technicals

Technical Factors (4-hour Chart):
  • The price is above its 50-period and slightly above its 21-period EMA
  • Price is above its middle Bollinger band
  • RSI is neutral (60.34)
  • Volume is average
Key levels to the upside          Key levels to the downside

1: $470                                     1: $451

2: $490                                     2: $445 

3: $500                                      3: $420

Ripple

The fourth-largest cryptocurrency by market cap has suffered a minor pullback after failing to break its immediate resistance level ($0.26). XRP is still trading within a range bound by $0.2454 to the downside and $0.26 to the upside, while its range is even more narrow lately, as its price is hovering only the top portion of the range.

Traders still have the opportunity to trade XRP’s sideways action without much risk. On the other hand, if the volume does increase drastically, a move towards the upside is much more likely, unless Bitcoin’s potential move down brings every other crypto down with it.

XRP/USD 4-hour Chart

XRP’s technicals on the 4-hour, daily, and weekly time-frame are bullish with slight hints of neutrality. On the other hand, its monthly overview is heavily tilted towards the sell-side.

XRP/USD 1-day Technicals

Technical factors (4-hour Chart):
  • The price above its 50-period EMA and slightly above its 21-period EMA
  • Price is slightly above its middle Bollinger band
  • RSI is neutral (55.12)
  • Volume is average
Key levels to the upside          Key levels to the downside

1: $0.26                                     1: $0.2454

2: $0.266                                   2: $0.235

3: $0.27                                    3: $0.227


Categories
Crypto Market Analysis

Daily Crypto Review, Nov 11 – Mempool Cleared! Bitcoin Fees Plummet

The cryptocurrency sector has spent the day consolidating and preparing for the next move and setting up valid technical formations. The largest cryptocurrency by market cap is currently trading for $15,377, representing an increase of 0.01% on the day. Meanwhile, Ethereum gained 2.08% on the day, while XRP gained 1.14%.

 Daily Crypto Sector Heat Map

Loopring gained 30.64% in the past 24 hours, making it the most prominent daily gainer out of the top100 cryptos ranked by market capitalization. It is closely followed by UMA’s gain of 24.45% and yearn.finance’s 17.59% gain. On the other hand, Decentraland lost 13.96%, making it the most prominent daily loser. Decred lost 9.94% while HedgeTrade lost 8.76%, making them the 2nd and 3rd most prominent daily losers.

Top 10 24-hour Performers (Click to enlarge)

Bottom 10 24-hour Performers (Click to enlarge)

Bitcoin’s market dominance has decreased slightly since we last reported, with its value is currently staying at 63.9%. This value represents a 0.3% difference to the downside compared to the value it had yesterday.

Daily Crypto Market Cap Chart

The crypto sector capitalization has gone up slightly over the course of the day. Its current value is $446.12 billion, representing a $4.38 billion increase compared to our previous report.

_______________________________________________________________________

What happened in the past 24 hours?

_______________________________________________________________________

Bitcoin’s transaction fees have plummeted as its mempool got cleared, reaching its smallest size since the middle of Oct. This means that hundreds, if not thousands of unconfirmed transactions, got included in the recent blocks, leaving the blockchain clear and unclogged. The mempool clearing has been attributed to a 42% increase in hash rate, which happened just a couple of days ago as Chinese miners completed their migration from the Sechuan region.

At the moment, the median transaction fee is 3 sat/byte, or roughly $0.11.

_______________________________________________________________________

Technical analysis

_______________________________________________________________________

Bitcoin

The largest cryptocurrency by market capitalization has spent the day trading in a narrow range between $15,100 and $15,500, trying to pass the $15,480 level with confidence. However, as this did not happen, we are seeing a possible lower high forming. The flat RSI and volume dropping signal a “calm before the storm,” which means that traders should prepare for a sharp move soon.

Traders should wait for Bitcoin to choose its short-term direction and trade only if Bitcoin confidently goes above $15,480 or below $15,420 with significant volume.

BTC/USD 4-hour Chart

Bitcoin’s technicals are bullish on all time-frames. However, its shorter time-frames are showing signs of neutrality, or even slight bearish presence, while its monthly overview is completely bullish.

BTC/USD 1-day Technicals

Technical factors (4-hour Chart):
  • Price is above its 50-period EMA and right at its 21-period EMA
  • Price is at its middle Bollinger band
  • RSI is neutral (54.44)
  • Volume is average
Key levels to the upside          Key levels to the downside

1: $15,480                                 1: $15,420

2: $16,400                                 2: $14,640

3: $16,700                                  3: $14,100

Ethereum

Ethereum has, unlike Bitcoin, had a great day as its price propelled past the top line of the ascended channel. The price increase is mainly attributed to great news regarding its 2.0 update adoption, as its deposit contracts top 22.5 million only one week after launch.

However, while the price increase is certainly a great thing, Ethereum is currently entering a strong resistance zone (above $460), which may cause problems for the ETH bulls.

Traders should pay close attention to how (and if) Ethereum pulls back or continues upwards. If Bitcoin doesn’t make any moves, it’s safe to assume that Ethereum will pullback in the short future.

ETH/USD 4-hour Chart

Ethereum’s technicals show “extreme buy” daily, weekly, and monthly time-frames, while its 4-hour overview is slightly more neutral.

ETH/USD 1-day Technicals

Technical Factors (4-hour Chart):
  • The price is above both its 50-period and its 21-period EMA
  • Price is at its top Bollinger band
  • RSI is neutral (60.73)
  • Volume is average
Key levels to the upside          Key levels to the downside

1: $470                                     1: $451

2: $490                                     2: $445 

3: $500                                      3: $420

Ripple

The fourth-largest cryptocurrency by market cap has continued trading within a range, bound by $0.2454 to the downside and $0.26 to the upside. XRP has spent the day slowly increasing its price, but the one attempt it had of pushing past $0.26 got shut down quickly.

Traders are safe to assume that XRP will trade within the same range and that they can trade the sideways action. On the other hand, if the volume increases drastically, a move towards the upside is much more likely than one towards the downside (unless fueled by Bitcoin’s move).

XRP/USD 4-hour Chart

XRP’s technicals on the 4-hour and weekly time-frame are slightly bullish with slight hints of neutrality, while its daily overview is bullish. On the other hand, its monthly overview is tilted towards the sell-side.

XRP/USD 1-day Technicals

Technical factors (4-hour Chart):
  • The price above its 50-period EMA and slightly above its 21-period EMA
  • Price is slightly above its middle Bollinger band
  • RSI is neutral (52.36)
  • Volume is average
Key levels to the upside          Key levels to the downside

1: $0.26                                     1: $0.2454

2: $0.266                                   2: $0.235

3: $0.27                                    3: $0.227


Categories
Crypto Guides

Brief Introduction To Flexa And SPEDN Crypto Payment Apps

Introduction

Cryptocurrencies are becoming bigger and bigger with each passing year. While they were an unknown topic a decade back, they have now become a prominent income source for many. But have you imagined if these cryptocurrencies overtake the physical currencies entirely? Well, Flexa has made this possible by bringing in the use of crypto payments in the retail world.

This means the cryptocurrency usage won’t be limited to investment purposes, and retailers will benefit from it. Flex has now begun its work with a mobile application named SPEDN. There is nothing to worry about if you haven’t heard about Flex and SPEDN before because we will provide you with all the necessary details on these two.

What Are Flexa And SPEDN?

As stated above, Flexa is a mobile payment startup that has been working to develop a unique cryptocurrency payment network for retailers. Its primary motive includes the following factors:

  • Reduce frauds
  • Eliminate processing costs
  • Build better relationships between buyers and sellers
  • Preserve privacy

Flexa offers one of its kind platform for payments that is entirely decentralized, making commerce more efficient and accessible. In straightforward terms, it can be stated that Flexa works to cut out the unnecessary hassle that is often incorporated into the payment processes of retailers. Thus, reducing the overall complexity and costs of conventional payment systems.

The startup is doing so with its first app called SPEDN. The application will be available for both Android and iOS platforms. It will serve as a digital wallet that uses cryptocurrency as the payment method. So you can use it for direct payments in retail stores.

Which Cryptocurrencies Are Supported By SPEDN?

The very first factor people notice in a digital wallet is the type of currencies supported by it. And it is the same for SPEDN. It is vital to know whether this platform provides you with the flexibility to use your preferred cryptocurrency for the purpose.

Currently, it supports the following cryptocurrencies:

  • Bitcoin
  • Bitcoin Cash
  • Ethereum
  • Gemini

However, Flexa has assured the users that they will soon be able to use a variety of coins on SPEDN as they are working towards the development.

How To Use The SPEDN App?

Using the SPEDN application is as simple as using any other digital wallet. You just have to follow four simple steps:

  • Deposit Money: You first need to have enough cryptocurrency in the app to function further. For this, you can choose the amount that has to be deposited, and SPEDN will provide you with a deposit address.
  • Shop: Once you have enough cryptocurrency in the wallet, you can shop for whatever you want from any specific retail store.
  • Get Barcode: You will then have to select the store name from the app, and you will receive a unique barcode.
  • Scan: The shop’s cashier will then scan the code, and the payment will get debited automatically.

Currently, it may be challenging for you to spot retail stores that accept cryptocurrency payments. But once this platform becomes popular and people become aware of its benefits, you will be able to use it like any other digital wallet.

Conclusion

Flexa is working to change the entire retail shopping experience for you. Plus, they are making the transactions more beneficial for the shopkeepers. SPEDN is its first app to fulfill the initiative. However, this is just the beginning, and people expect Flexa to bring up more ideas to make the platform even more convenient.

Categories
Cryptocurrencies

Omni Wallet review 2020: How Safe is Omni Wallet?

On the web wallet website, this crypto storage vault is described as a web wallet dedicated to bridging the gap between “security, usability, and multi-currency support.” It is an open-source web wallet developed by OmniLayer Technology Company in 2013.  Originally referred to as Mastercoin, the Bitcoin-based protocol rebranded to Omni in 2016. Since then, Omniwallet’s development team has committed to the continued improvement of this multi-currency wallet’s features and functionalities that the team considers a work in progress.

On the Omniwallet website, this crypto vault is described as a protocol layer that is built on the Bitcoin blockchain. It is a custodial wallet that stores digital assets in highly secure company servers but also allows you to create personalized servers to host your private keys.

In this Omniwallet review, we want to determine if the wallet lives up to its security and usability promise. And to achieve this, we will detail its key features, the safety measures it has put in place, provide you with a step by step guide on how to use Omninwallet, and tell you everything you need to know about this hot wallet.

Omni Wallet key features:

Multicurrency support: Though it is built on the Bitcoin blockchain, Omniwallet is considered a multicurrency wallet that supports both Bitcoin and Omnilayer native tokens.

Built-in exchange: OmniLayer runs a decentralized crypto exchange that it has integrated on the Omniwlalet. It is fast in processing crypto transactions, maintains competitive transaction fees, and introduces wallet users to a wide range of cryptocurrencies, tokens, and stable coins.

Web-based: Omniwallet is purely web-based and compatible with virtually all popular browsers. Therefore, you don’t have to download or install crypto apps to access the wallet or interact with its services.

Own hosting: Omniwallet stores all the data, especially the private keys, in the highly secure OmniLayer servers. You nevertheless are free to create personalized servers like Amazon AWS that you can then use to host your private keys.

Omni Wallet security features:

Password: Like virtually all other cryptocurrency vaults, Omniwallet is secured with a wallet that you set when creating a user account. You will need it, alongside the wallet ID, to access the Omnilayer servers and interact with your private keys.

Open-sourced: According to Omniwlalet, everything about their wallet “is open source from the ground up.” Anyone can, therefore, view and critique their source code that is currently accessible on both the company website and GitHub repository.

Multifactor authentication: You can add a second and even a third layer of protection around your wallet using compatible platforms like Google Authenticator or email address to receive special codes that you can use to log in to the wallet.

Integrates Bitcoin armory: Bitcoin Armory is a specialized online Bitcoin wallet that stores your private keys in offline cold storage. Bitcoin armory also allows you to transact offline and only come online to broadcast the transaction.

Client-side encryption: The fact that Omniwlalet stores private keys on your behalf implies a lot of communication between the wallet and company servers. Client-side encryption here implies that communications between your Omni wallet and Omnilayer servers, as well as third-party systems, are encrypted before they leave your browser.

Hierarchically deterministic: By ensuring that the process of generating new wallet addresses is hierarchically deterministic, Omniwallet helps you mask your online crypto transactions by hiding your real wallet address, effectively throwing off crypto trackers.

Watch-only mode: When logging into your Omniwallet from an unsecured browser or compromised internet connections, you can opt to log in to its watch-only mode. This allows you to view crypto balances and crypto history but makes it impossible to view the private keys, alter the wallet settings, or transfer cryptos out.

How to activate/ setup the Omni Wallet

Step 1: Open the Omniwlalet.org website and click on the “Create Wallet” tab

Step 2: Create a unique password for the wallet and enter a valid email address

Step 3: You will receive your unique wallet ID in your email. You will need it together with the password to log in to your user account.

Step 4: Log in to the Omniwallet. Click on the three bars on the top left corner of the user dashboard, and under wallet options, select Backup to generate the backup for your wallet.

Step 5: You will be prompted to enter the wallet password for verification, after which you can download the wallet backup. Copy it to a USB stick or PC and store it safely offline.

Step 6: Your Omniwallet is now active and ready for use

How to add/ receive Crypto into Omni Wallet:

Step 1: Log in to your Omniwallet and click on the My Wallet tab.

Step 2: Use the My Address tab to see all the wallets hosted on the wallet.

Step 3:  Select the coin you want to receive to reveal the wallet address and QR code

Step 4: Copy either and forward them to the individuals sending you cryptocurrencies.

How to send crypto from Omni Wallet:

Step 1: Log in to your Omniwallet and click on the My Wallet tab.

Step 2: Use the My Address tab to see all the cryptocurrencies hosted on the wallet

Step 3: Click on the “Send” button at the far right of the user dashboard.

Step 4: On the “Send from” section, select the wallet address from whence to send the cryptos, then enter the recipient’s wallet address and the amount to send

Step 5: Confirm that the transaction details are correct and hit send.

Omni Wallet ease of use:

The process of creating a user account on Omniwallet is easy and straightforward. The wallet also maintains one of the cleanest, intuitive, and beginner-friendly user interfaces. The fact that it is a web wallet also means that it is easily accessible from virtually any browser and on the move.

The process of sending and receiving cryptocurrencies in and out of the wallet or backing up its contents is also easy and straightforward.

Omni Wallet supported currencies:

Omniwlalet will only support three cryptocurrencies: Bitcoin, Omni token, and Test Omni Token.

Omni Wallet cost and fees:

Omniwallet is free. However, you will be required to pay a small and highly variable transaction fee every time you send cryptos out to another wallet or exchange.

Omni Wallet customer support:

On the Omniwallet website is the FAQ section that hosts how-to guides for the wallet. It also highlights some of the common challenges faced by Omniwallet users and how to overcome them.

You will also find the ‘Contact Us’ page that provides users with the support email and hosts the wallet’s knowledge base. For technical queries, consider direct messaging Omniwallet’s customer support team on Facebook or Twitter.

What are the pros and cons of using the Omni Wallet?

Pros:

  • It is ultralight and doesn’t require you to download a node or app.
  • It is highly transparent as it embraces an open-sourced design.
  • It embraces such advanced crypto security features as client-side encryption and Bitcoin Armory.

Cons:

  • It stores private keys on your behalf.
  • It will only support a limited number of crypto.

Comparing Omni Wallet with other Custodial crypto wallets

Omni Wallet vs. eToro wallet

Omni and EeToro are similar because they both are custodial wallets, storing private keys and other sensitive data on your behalf. They have also integrated similar functional and security features, such as a decentralized exchange. They are also free and maintain very competitive transaction fees.

However, while Omniwallet is a Bitcoin-only crypto storage vault, eToro is more versatile and supports 100+ cryptos and tokens. Similarly, Omniwlallet’s customer support team may be considered a little lackluster and sluggish than the highly responsive team maintained by eToro.

Verdict: Is Omni Wallet safe?

The most significant blow to Omniwlalet’s claim of maintaining one of the most secure crypto wallets is that it is a web-wallet exposed to the inherent threats facing hot wallets. It has tried to address this challenge by introducing client-side encryption, self-hosted servers, and even the ultra-secure Bitcoin Armory.

Categories
Crypto Market Analysis

Daily Crypto Review, Nov 10 – Bitcoin Miners Migrated: BTC Hash Rate Up 42%

The cryptocurrency sector has spent the day mostly consolidating and preparing for the next move and setting up technical formations. The largest cryptocurrency by market cap is currently trading for $15,288, representing a decrease of 1.14% on the day. Meanwhile, Ethereum lost 1.70% on the day, while XRP lost 0.8%.

 Daily Crypto Sector Heat Map

Civic gained an astonishing 101.35% in the past 24 hours, making it the most prominent daily gainer out of the top100 cryptos ranked by market capitalization. It is closely followed by Golem’s gain of 29.25% and Decentraland’s 22.26% gain. On the other hand, Loopring lost 9.76%, making it the most prominent daily loser. Synthetix lost 7.39% while Energy Web Token lost 7.35%, making them the 2nd and 3rd most prominent daily losers.

Top 10 24-hour Performers (Click to enlarge)

Bottom 10 24-hour Performers (Click to enlarge)

Bitcoin’s market dominance has decreased slightly since we last reported, with its value is currently staying at 64.2%. This value represents a 0.1% difference to the downside compared to the value it had yesterday.

Daily Crypto Market Cap Chart

The crypto sector capitalization has gone down slightly over the course of the day. Its current value is $441.50 billion, representing a $4.29 billion decrease compared to our previous report.

_______________________________________________________________________

What happened in the past 24 hours?

_______________________________________________________________________

The past 24 hours were characterized by a slow price movement of the crypto sector. However, a lot of important news reached the public’s eye. Bitcoin Miners finished up on Sichuan’s migration, triggering a hash rate spike of 42% in the past 2 days. Ethereum has been performing great, and news of its 2.0 version is all over the place, with the most recent one being that the number of addresses surpassing 32 ETH (the amount required to be a validator) is at an all-time high. On the other hand, Bitcoin SV brought bad news to the sector, as its multi-sig feature got compromised, causing enormous losses for its users.

_______________________________________________________________________

Technical analysis

_______________________________________________________________________

Bitcoin

The largest cryptocurrency by market capitalization is trading in a very uncertain zone at the moment. Its price has most likely created a double top formation, indicating a possible pullback in the short-term. This prediction is even more convincing as we can see that Bitcoin can’t get past the $15,480 resistance after trying for over 12 hours. However, the overall sentiment around the cryptocurrency is extremely bullish, and its downside is protected by the ascending (yellow) line.

With that being said, traders should wait for Bitcoin to choose its direction and trade only if Bitcoin spikes above $15,480 or below $15,420 with significant volume.

BTC/USD 4-hour Chart

Bitcoin’s technicals are bullish on all time-frames. The only difference compared to yesterday was that every single time-frame is completely bullish and with almost no neutrality present (as opposed to yesterday, when neutral sentiment could be seen on some overviews).

BTC/USD 1-day Technicals

Technical factors (4-hour Chart):
  • Price is above its 50-period EMA and right at its 21-period EMA
  • Price is at its middle Bollinger band
  • RSI is neutral (53.60)
  • Volume is average
Key levels to the upside          Key levels to the downside

1: $16,400                                 1: $15,480

2: $16,665                                 2: $14,640

3: $17,260                                  3: $14,100

Ethereum

Ethereum has been playing around the upper line of the ascending channel (yellow dotted line) and constantly going above and under it. At the moment, its price is under the line, and any attempts of getting past it have been extinguished quickly. This most likely means that Ethereum failed to establish itself above the $451 level, which could trigger a correction towards the 50-period moving average, and ultimately the bottom channel line.

Traders should pay close attention to volume, as they will not have a lot of time to join in on the trade towards the downside. Placing a stop-loss right above the ascending channel top line should be a “safe bet.”

ETH/USD 4-hour Chart

Ethereum’s technicals are tilted heavily towards the buy-side on its 4-hour and monthly overview, while the neutral sentiment is heavily present on its daily and weekly charts.

ETH/USD 1-day Technicals

Technical Factors (4-hour Chart):
  • The price is above its 50-period and slightly above its 21-period EMA
  • Price is at its middle Bollinger band
  • RSI is neutral (55.58)
  • Volume is slightly elevated
Key levels to the upside          Key levels to the downside

1: $451                                     1: $445

2: $470                                     2: $420 

3: $490                                      3: $415

Ripple

The fourth-largest cryptocurrency by market cap continued its consolidation phase right above the $0.2454 level, which is considered a major pivot point in XRP’s trading in the recent past. XRP created a double bottom at this level, possibly indicating a push towards the $0.26 in the short term.

Traders should still be safe to assume that XRP will trade within the range and that they can trade the sideways action. However, if the volume increases drastically, a move towards the upside is much more likely (if not fueled by Bitcoin’s move).

XRP/USD 4-hour Chart

XRP’s technicals on the 4-hour, daily, and weekly time-frame are all tilted towards the buy-side. However, neutral sentiment can be seen in all of them. On the other hand, its monthly overview also has the same neutrality amount but is tilted towards the sell-side.

XRP/USD 1-day Technicals

Technical factors (4-hour Chart):
  • The price slightly above its 50-period EMA and at its 21-period EMA
  • Price is slightly below its middle Bollinger band
  • RSI is neutral (49.69)
  • Volume is average
Key levels to the upside          Key levels to the downside

1: $0.26                                     1: $0.2454

2: $0.266                                   2: $0.235

3: $0.27                                    3: $0.227


Categories
Crypto Market Analysis

Daily Crypto Review, Nov 9 – Bitcoin at $15,500; What Will Biden’s Win Bring to the Crypto Sector?

The cryptocurrency sector has spent the weekend trying to recover and regain previous highs after most cryptocurrencies briefly dropped in price due to the election uncertainty. The most recent spike was triggered by the end of the US presidential elections, which caused mass uncertainty in the markets, as well as by now-President Biden hiring pro-crypto Gary Gensler as a member of his team. The largest cryptocurrency by market cap is currently trading for $15,433, representing an increase of 2.73% on the day. Meanwhile, Ethereum gained 2.94% on the day, while XRP gained 0.34%.

 Daily Crypto Sector Heat Map

Aave gained 20.05% in the past 24 hours, making it the most prominent daily gainer out of the top100 cryptos ranked by market capitalization. It is closely followed by THORChain’s gain of 17.75% and NEAR Protocol’s 17.57% gain. On the other hand, Celo lost 7.03%, making it the most prominent daily loser. The rest of the cryptocurrencies barely suffered any losses in the past 24 hours.

Top 10 24-hour Performers (Click to enlarge)

Bottom 10 24-hour Performers (Click to enlarge)

Bitcoin’s market dominance has decreased slightly since we last reported, with its value is currently staying at 64.3%. This value represents a 1% difference to the downside compared to the value it had on Friday.

Daily Crypto Market Cap Chart

The crypto sector capitalization has gone up slightly over the weekend. Its current value is $446.21 billion, representing a $4.85 billion increase compared to our previous report.

_______________________________________________________________________

What happened in the past 24 hours?

_______________________________________________________________________

_______________________________________________________________________

Technical analysis

_______________________________________________________________________

Bitcoin

The largest cryptocurrency by market capitalization has entered a state of uncertainty due to how close the US presidential election process was, and even had a brief drop due to less crypto-friendly Joe Biden winning. However, a new announcement regarding Biden hiring crypto-friendly advisors, as well as general stabilization of the political sphere, has triggered a spike in both stocks and Bitcoin.

Bitcoin has, after a brief drop below the yellow ascending line, come back above it, but only slightly as the move to the upside was stopped by the $15,420-$15,480 level.

Traders should wait for Bitcoin to “decide” whether it will go above $15,480 or below $15,420 and trade off of that.

BTC/USD 4-hour Chart

Bitcoin’s technicals are bullish on all time-frames, with smaller time-frames showing a bit of neutrality and longer time-frames being completely bullish.

BTC/USD 1-day Technicals

Technical factors (4-hour Chart):
  • Price is above both its 50-period EMA and its 21-period EMA
  • Price is at its middle Bollinger band
  • RSI is neutral (60.66)
  • Volume is slightly elevated
Key levels to the upside          Key levels to the downside

1: $15,480                                 1: $14,640

2: $16,665                                 2: $14,100

3: $17,260                                  3: $13,900

Ethereum

Ethereum has had an amazing weekend, with its price skyrocketing past the top line of the ascending channel. While most analysts thought that the second-largest cryptocurrency by market cap couldn’t get back above this line after the Nov 7 drop, Ethereum has proven them wrong and went above $450.

However, the immediate area above $450 is a zone of strong resistance, and Ethereum traders have to watch out how they enter trades here. The safest pick when it comes to trading Ethereum right now would be “riding the wave” towards the upside when ETH decides to spike.


ETH/USD 4-hour Chart

Ethereum’s technicals are almost completely neutral on the 4-hour and daily time-frames, while its longer time-frames are heavily tilted towards the buy-side.

ETH/USD 1-day Technicals

Technical Factors (4-hour Chart):
  • The price is above both its 50-period and its 21-period EMA
  • Price slightly above its middle Bollinger band
  • RSI is neutral (62.07)
  • Volume is elevated
Key levels to the upside          Key levels to the downside

1: $451                                     1: $445

2: $470                                     2: $420 

3: $490                                      3: $415

Ripple

The fourth-largest cryptocurrency by market cap had ended its ascension on Nov 7, when most cryptocurrencies dropped heavily in price. However, while most cryptos managed to get back near its previous highs, XRP failed to do so. It is currently trading in a wide range between $0.2454 and $0.26, after stopping its upward move at the ~$0.256 level.

Traders can consider trading XRP’s sideways movement as the volume is now reduced, and the possibility of a strong move is low. However, if such a move does happen, it could be easily predicted due to XRP’s current position.

XRP/USD 4-hour Chart

XRP’s technicals on the 4-hour, daily, and weekly slightly bullish, with some hints of neutrality. Its monthly overview, however, is still tilted towards the sell-side.

XRP/USD 1-day Technicals

Technical factors (4-hour Chart):
  • The price slightly above its 50-period EMA and at its 21-period EMA
  • Price is slightly below its middle Bollinger band
  • RSI is neutral (53.59)
  • Volume is average
Key levels to the upside          Key levels to the downside

1: $0.26                                     1: $0.2454

2: $0.266                                   2: $0.235

3: $0.27                                    3: $0.227