
The cryptocurrency sector experienced an overall major gain as Bitcoin reached its new all-time high. Bitcoin is currently trading for $22.095, representing an increase of 13.82% compared to yesterday’s value. Meanwhile, Ethereum’s price has increased by 9.69% on the day, while XRP managed to gain a whopping 23.35%.
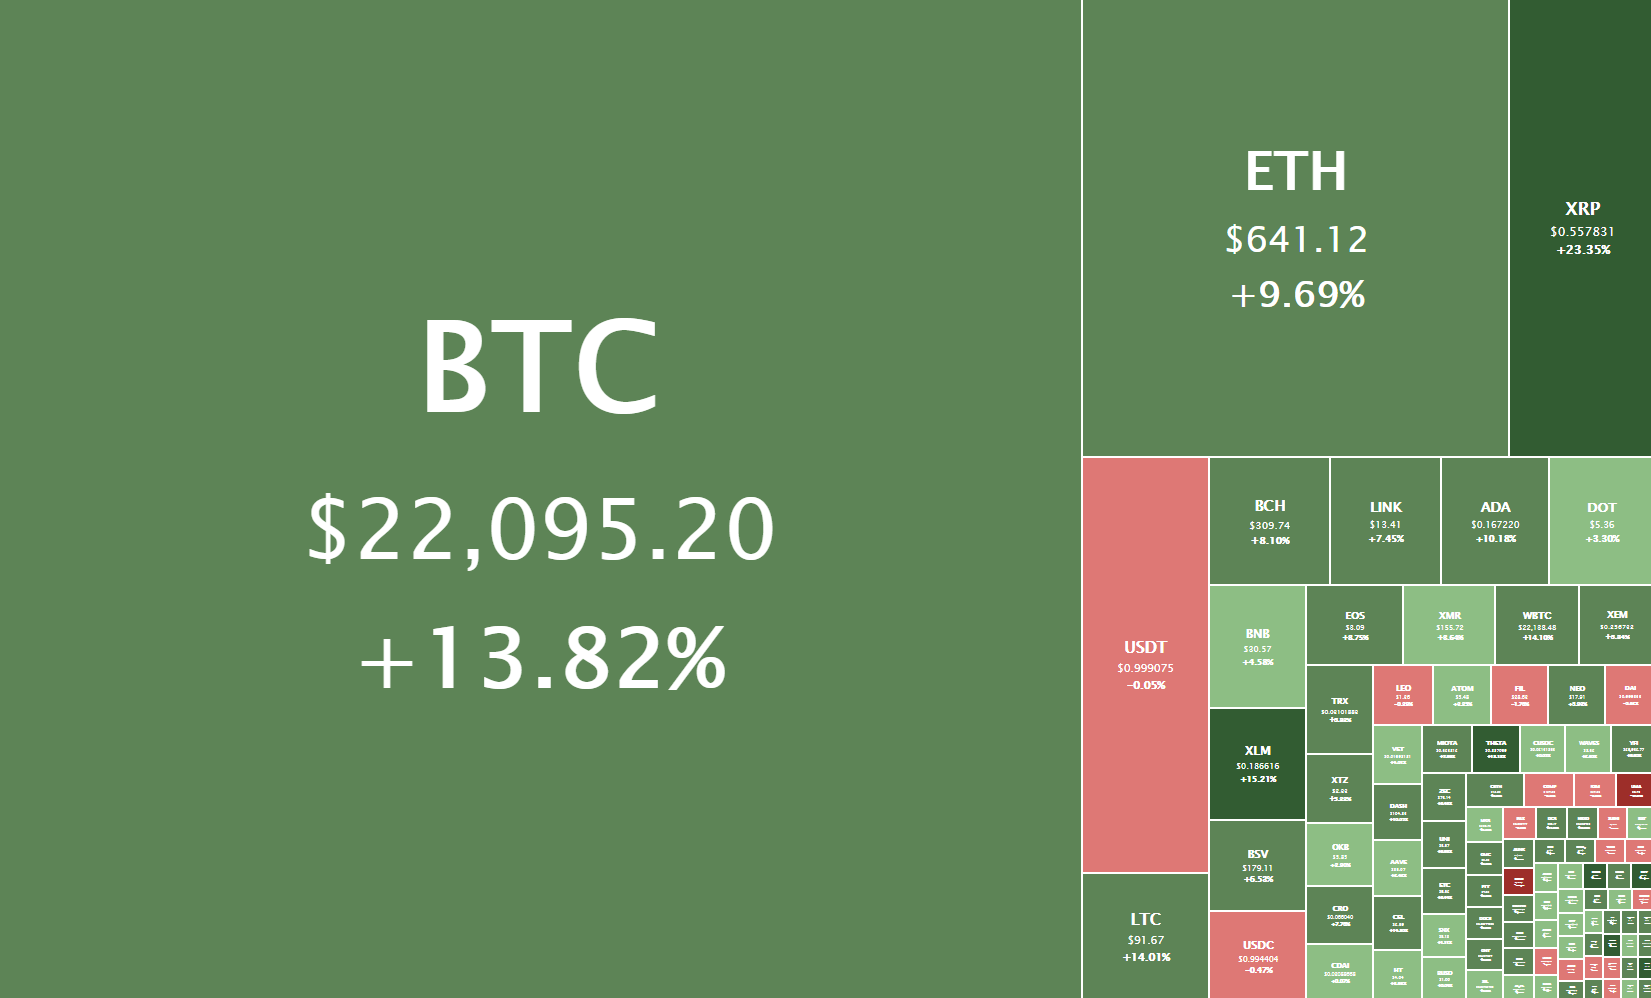
Daily Crypto Sector Heat Map
Puriever gained 238.59% in the past 24 hours, making it the most prominent daily crypto gainer by far. It is followed by Combine.finance’s 159.58% and Amun Bitcoin 3x Daily Shorts’ 146.94% gain. On the other hand, BigGame lost 82.62%, making it the most prominent daily loser. It is followed by GNY’s loss of 75,95% and Hush’s loss of 61.30%.

Top 10 24-hour Performers (Click to enlarge)
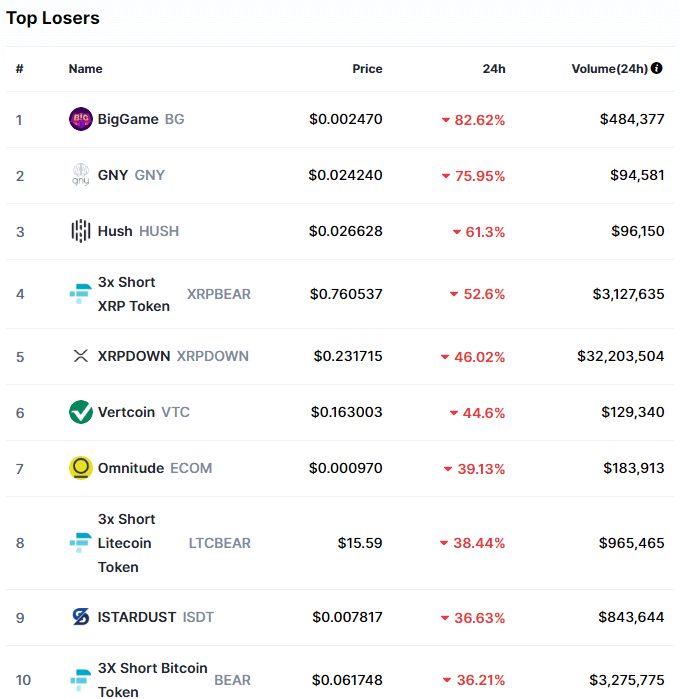
Bottom 10 24-hour Performers (Click to enlarge)
Bitcoin’s market dominance has moved up over a whole percent since our last report, with its value currently being 65%. This value represents a 1.1% difference to the upside than the value it had when we last reported.
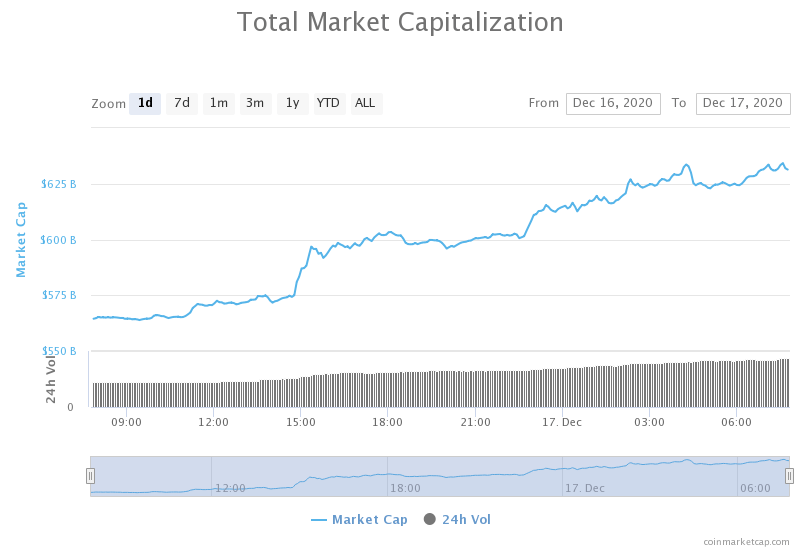
Daily Crypto Market Cap Chart
The cryptocurrency sector capitalization has increased drastically since we last reported, with its current value being $634.94 billion. This represents a whopping $70.94 billion increase when compared to our previous report.
_______________________________________________________________________
What happened in the past 24 hours?
_______________________________________________________________________
- American Express invests in crypto trading startup FalconX (The Block)
- Coinbase shakes up its board of directors with Marc Andreessen, former CFO of Cisco, stepping up (The Block)
- British Investment Fund Ruffer Buys $744 Million in Bitcoin (Cryptobriefing)
- Germany Legalizes Blockchain-Based Securities (Cryptobriefing)
- Lil Yachty’s First Crypto Collectible Sells for $16,050 (Cryptobriefing)
- While Bitcoin topped when the CME released BTC futures, Ethereum futures are bullish (Cryptoslate)
- Guggenheim CIO Says Bitcoin ‘Should Be Worth’ $400,000 (Coindesk)
- The Big Banks Riding Bitcoin’s Bull Run (Coindesk)
- Ether hits 2020 high as Bitcoin breaks $22K (Cointelegraph)
- ‘Bitwise 10’ crypto index trades at a whopping 369% premium in record-breaking debut (Cointelegraph)
_______________________________________________________________________
Technical analysis
_______________________________________________________________________
Bitcoin

Bitcoin has had quite an amazing day, as its price skyrocketed to new all-time highs. The largest cryptocurrency by market cap reached price discovery mode as its price topped at $22,400. While there are no set resistance levels at the moment, we can use Fib retracement extensions to determine where they could form.
At the moment, the Fib extensions sitting at $21,350 and $22,055 are the best contenders to act as support levels to Bitcoin’s eventual downturn.
BTC/USD 4-hour chart
Bitcoin’s daily and weekly overview are fully bullish, while its 4-hour and monthly time-frames show slight neutrality on top of the overall bullishness.
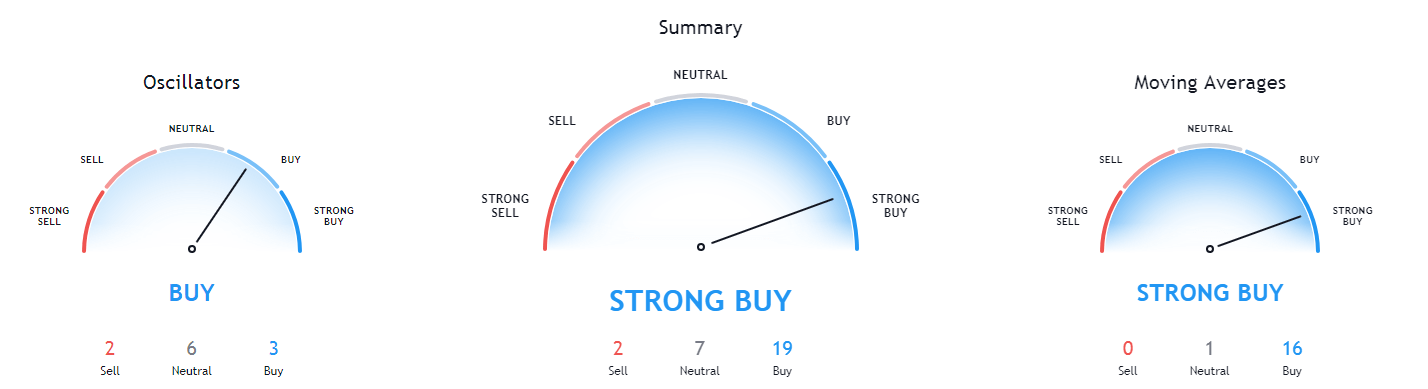
BTC/USD 1-day Technicals
Technical factors (4-hour Chart):
- Price is far above both its 50-period and its 21-period EMA
- Price slightly above its top Bollinger band
- RSI is heavily overbought (86.76)
- Volume is far higher than its average levels
Key levels to the upside Key levels to the downside
1: $24,315 1: $22,054
2: $24,700 2: $21,350
3: $25,511 3: $19,918
Ethereum

Ethereum followed the extremely bullish sentiment caused by Bitcoin’s push, reaching a price of $625 before hitting a sell wall. The second-largest cryptocurrency by market cap has held these levels, and is currently consolidating above the $632 level.
An important thing to note is that, while Bitcoin has reached its ATH, Ethereum is very far from it. Ethereum might be a good value investment simply due to its potential to possibly reach towards higher levels on account of pushing towards its ATH.
ETH/USD 4-hour Chart
While Ethereum shows overall bullish sentiment on all time-frames, every time-frame except the monthly time-frame shows slight neutrality.

ETH/USD 1-day Technicals
Technical Factors (4-hour Chart):
- Price is far above both its 50-period and its 21-period EMAs
- Price is at its top Bollinger band
- RSI is heavily overbought (78.20)
- Volume is much higher than its weekly average
Key levels to the upside Key levels to the downside
1: $675 1: $636.5
2: $738.5 2: $632
3: $817.5 3: $600
Ripple
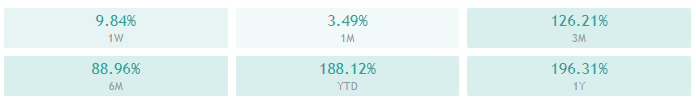
Unlike most days where XRP is having larger moves to the downside and smaller moves to the upside compared to BTC and ETH, the roles are reversed this time. The fourth-largest cryptocurrency by market cap has gained almost 25% on the day as its price bounced off of the lower line of the descending channel, and pushed towards the upside, reaching as high as $0.583 before starting its consolidation.
XRP is now trading within a range, bound by the $0.57 resistance and $0.543 support levels.
XRP/USD 4-hour Chart
XRP has changed its sentiment to overall bullishness, with its monthly time-frame showing full tilt towards the buy-side, and the rest of the time-frames showing some neutrality or hints of bearishness remaining.
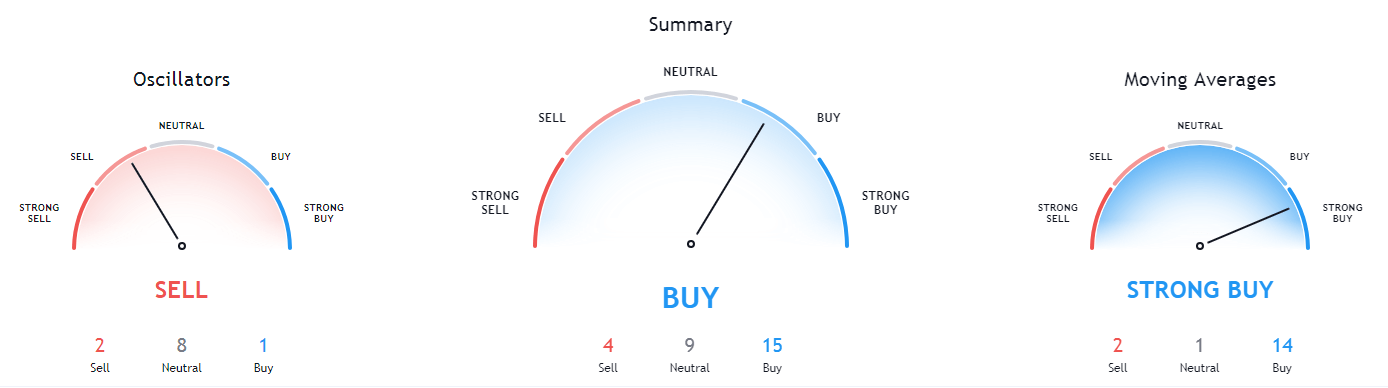
XRP/USD 1-day Technicals
Technical factors (4-hour Chart):
- Its price is currently above both its 50-period EMA and its 21-period EMA
- Price slightly below its top Bollinger band
- RSI is nearing the overbought territory (61.30)
- Volume is well above its average level
Key levels to the upside Key levels to the downside
1: $0.57 1: $0.543
2: $0.597 2: $0.5
3: $0.63 3: $0.475
Related posts
 Daily Crypto Review, Oct 21 – Bitcoin Above $12,000; Bull Market in Full Swing
 Daily Crypto Review, Oct 23 – PayPal Enabling Crypto Not as Good as it Sounds; Ethereum Pushes Towards $420
 Daily Crypto Review, Oct 29 – Bitcoin Back At $13,000: What’s Next? Trading Ideas and Market Overview
 Daily Crypto Review, Nov 10 – Bitcoin Miners Migrated: BTC Hash Rate Up 42%