
The cryptocurrency sector was mostly in the red until Bitcoin took the day to push past $12,000, after which some cryptos started following it towards the upside. Bitcoin is currently trading for $12.234, representing an increase of 4.21% on the day. Meanwhile, Ethereum gained 0.40% on the day, while XRP lost 0.31%.

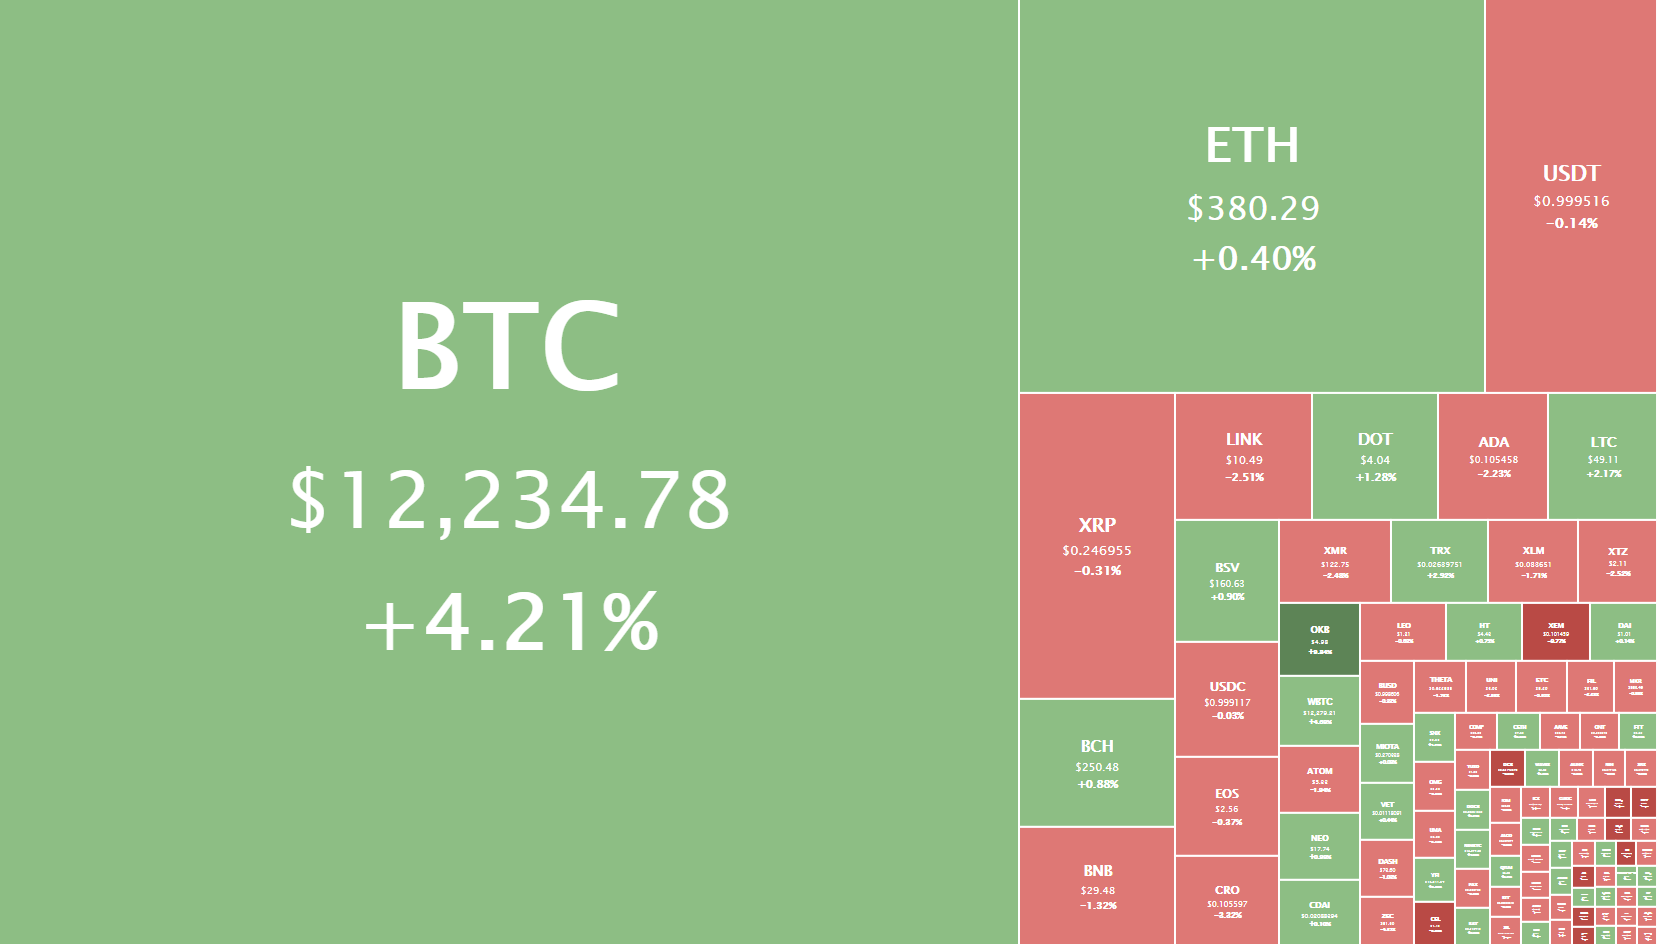
Daily Crypto Sector Heat Map
If we look at the top 100 cryptocurrencies, we can see that Nano gained 6.94% in the past 24 hours, making it the top daily gainer. Aave (5.59%) and OKB (5.41%) also did great. On the other hand, NXM lost 13.92%, making it the most prominent daily loser. It is followed by Reserve Rights’ loss of 13.85% and Arweave’s loss of 12.59%.

Top 10 24-hour Performers (Click to enlarge)
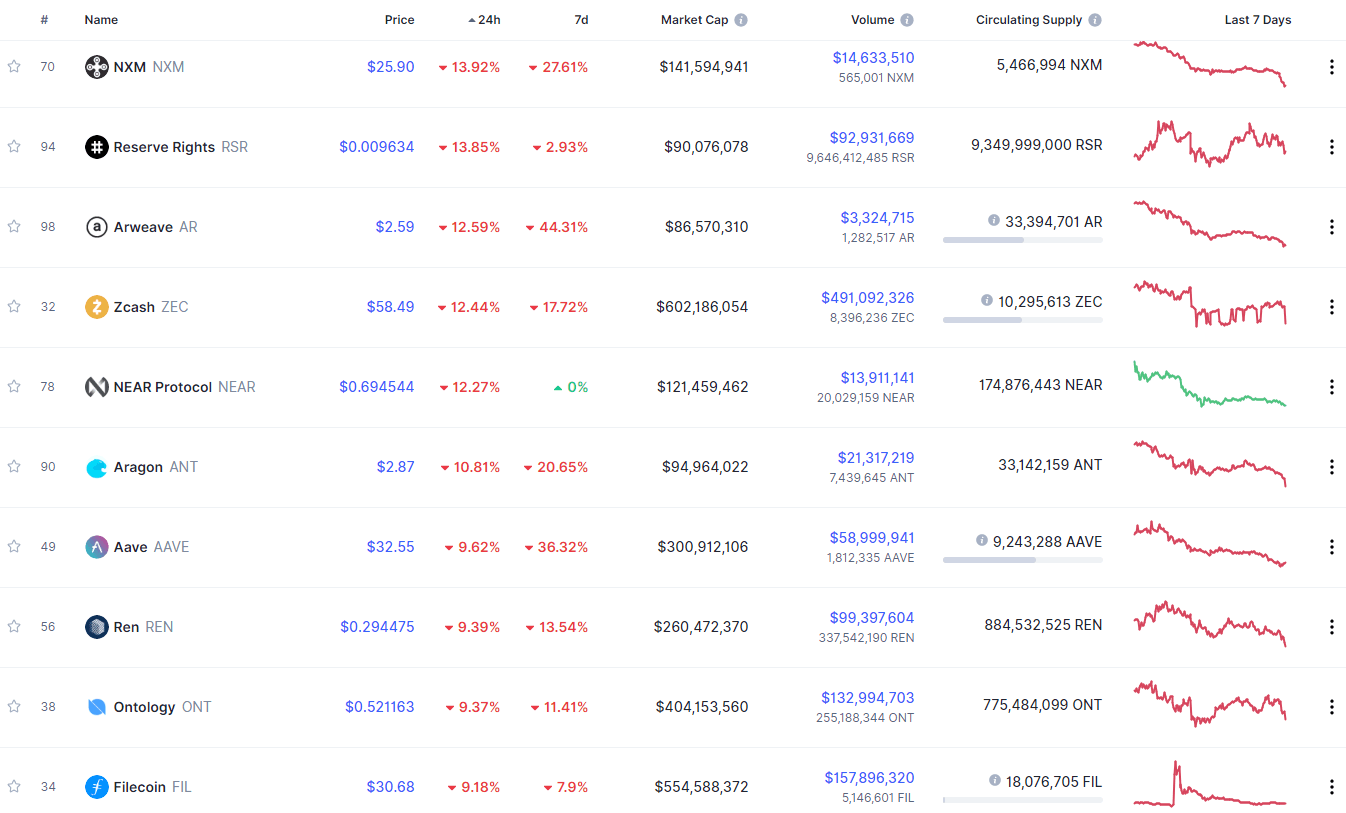
Bottom 10 24-hour Performers (Click to enlarge)
Bitcoin’s market dominance level has increased slightly since when we last reported, with its value is currently 60.5%. This value represents a 1% difference to the upside when compared to when we last reported.
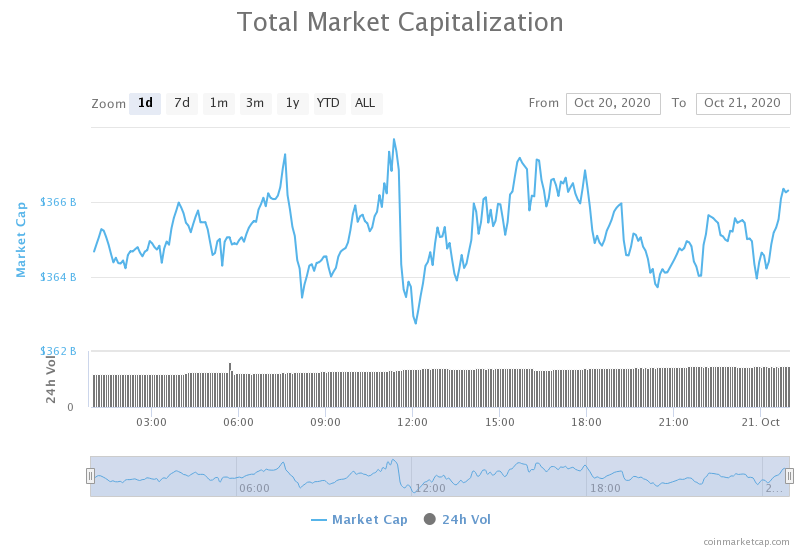
Daily Crypto Market Cap Chart
The crypto sector capitalization has stayed at the same spot since we last reported. Its current value is $366.26 billion, representing an increase of $0.79 billion compared to our previous report.
_______________________________________________________________________
What happened in the past 24 hours?
_______________________________________________________________________
- $5 million penalty proposed between SEC and Kik to end ICO lawsuit (The Block)
- Bitcoin’s ETF chances are improving as global crypto regulation increases (Cryptoslate)
- Founder of DeFi’s Yearn.finance (YFI) just launched another Ethereum experiment (Cryptoslate)
- Bitcoin ETP volumes grew in October amidst institutional demand (Cryptoslate)
- Uniswap network fees remain “attractive” despite plunging UNI price (Cryptoslate)
- Chainlink’s Latest Downtrend Eases as Whales Buy Up Discount Tokens (Cryptobriefing)
- Dash Joins Ethereum’s DeFi, Letting Users Earn Both Node Rewards and Yield (Cryptobriefing)
- CBDCs Mean Evolution, Not Revolution (Coindesk)
- Validators Drop Off Ethereum 2.0 Testnets as Mainnet Release Looms (Coindesk)
- OKEx users express frustration over suspended withdrawals (Cointelegraph)
_______________________________________________________________________
Technical analysis
_______________________________________________________________________
Bitcoin
The largest cryptocurrency by market capitalization is pushing past its psychological and actual major resistance of $12,000 right at this moment. The move started slow, with one candle testing the waters above $12,000 before backing out, before bulls went head-on and pushed the move quickly to far above this level. At the moment, Bitcoin has stopped its push at just above $12,250.
Traders should pay attention to hot Bitcoin finishes this move and trade either the pullback or the next wave up.
BTC/USD 1-day Chart
Bitcoin’s technical overview is strongly tilted towards the buy-side, with lower time-frames showing some signs of neutrality, while longer time-frames are completely bullish.
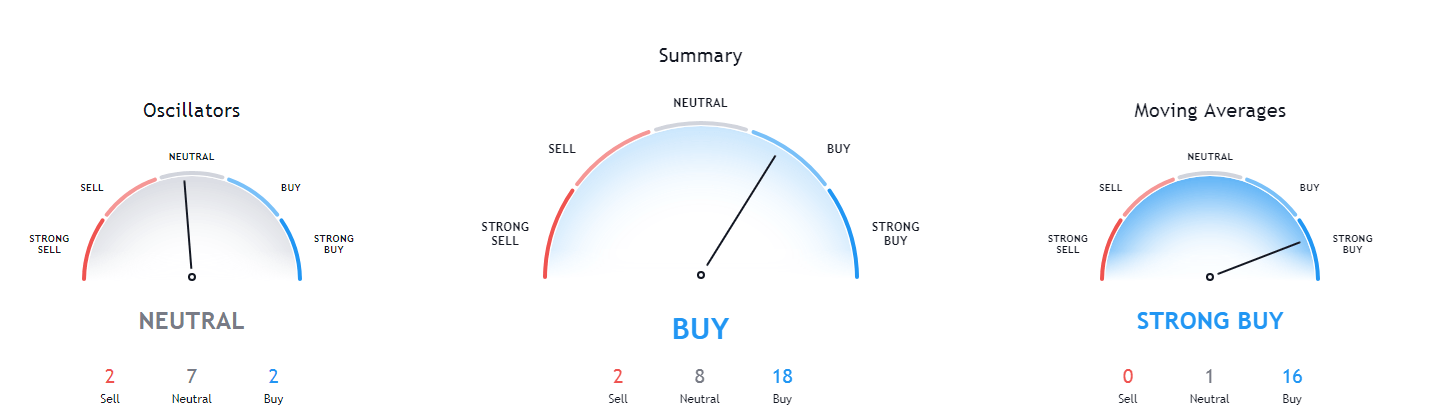
BTC/USD 1-day Technicals
Technical factors (4-hour Chart):
- Price is far above its 50-period EMA and at its 21-period EMA
- Price above its top Bollinger band
- RSI is extremely overbought (80.30)
- Volume is elevated
Key levels to the upside Key levels to the downside
1: $12,330 1: $12,000
2: $12,500 2: $11,850
3: $12,870 3: $11,735
Ethereum
Ethereum’s price was pretty much stagnant until Bitcoin broke $12,000, which is when the second-largest cryptocurrency by market cap started pushing up as well. The price has slowly pushed past $371 and then explosively past $378, which is where it is at the moment.
Traders should pay attention to how ETH tries to establish itself above $378, and trade off of it.
ETH/USD 4-hour Chart
Ethereum’s 4-hour technicals are showing a tilt towards the sell-side, while its 1-day overview is still bullish. When taking a look at its longer time-frames, we can see heavy neutrality, but still overall bulishness.
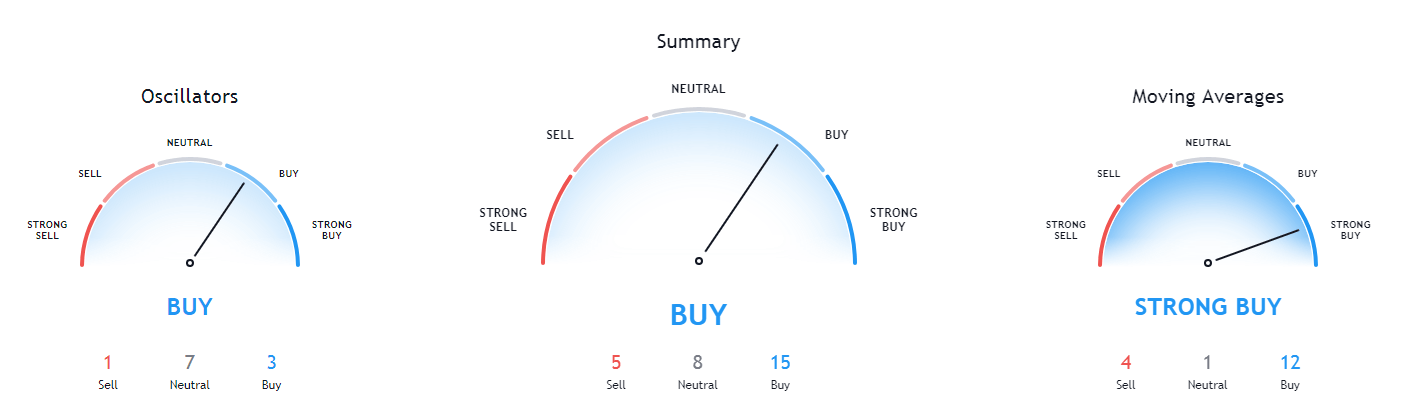
ETH/USD 1-day Technicals
Technical Factors (4-hour Chart):
- The price is above its 50-period and its 21-period EMA
- Price is near the top Bollinger band
- RSI is neutral (56.02)
- Volume is elevated
Key levels to the upside Key levels to the downside
1: $400 1: $378
2: $415 2: $371
3: $420 3: $360
Ripple

The fourth-largest cryptocurrency by market cap used the momentum Bitcoin’s move has created to push past its $0.2454 resistance once again after falling below it the day before. While this is a great thing, XRP couldn’t pass its previous resistance level of $0.25, which caused it to retest the support level. If it drops below $0.2454 again, bears may gather in a larger number and XRP might push down towards $0.235
XRP/USD 4-hour Chart
XRP’s technicals are quite mixed up, with its 4-hour and weekly overviews showing signs of bullish sentiment, while its daily and monthly overviews are tilted towards the sell-side.
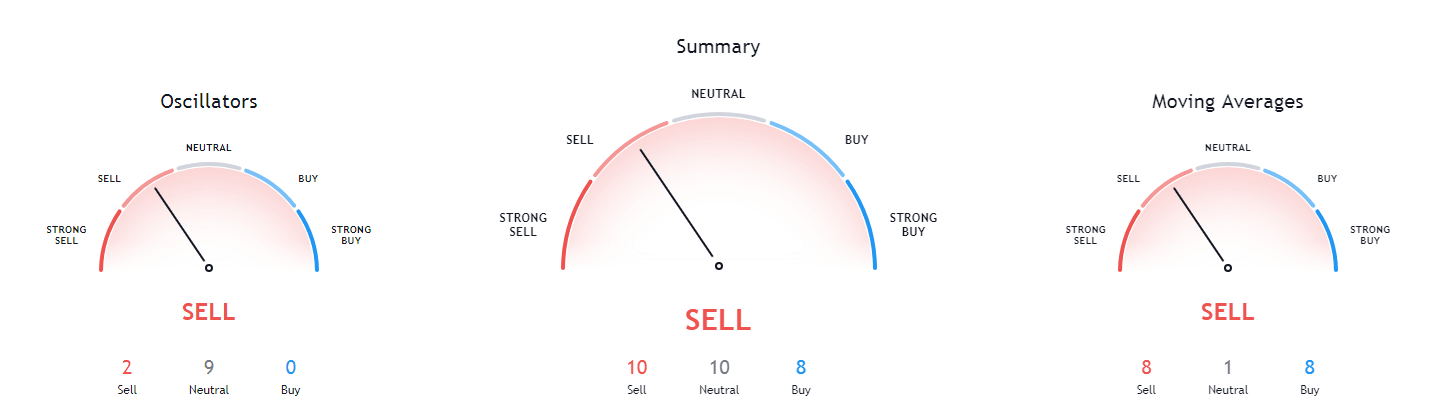
XRP/USD 1-day Technicals
Technical factors (4-hour Chart):
- The price is at its 50-period EMA and above its21-period EMA
- Price is near its top Bollinger band
- RSI is neutral (53.64)
- Volume is below average
Key levels to the upside Key levels to the downside
1: $0.26 1: $0.2454
2: $0.266 2: $0.235
3: $0.2855 3: $0.227
Related posts
 Daily Crypto Review, Feb 25 – Crypto market continuing its move down; First crypto bank in the US?
 Daily Crypto Review, Mar 2 – Cryptos regaining pre-weekend prices; Watch out for crypto-stealing Trojans
 Daily Crypto Review, Mar 6 – Bitcoin above $9,000; Steem performing a network takeover
 Daily Crypto Review, Mar 9 – Blood on the streets, BTC under $8,000