Dear traders,
We are moving signals from website to telegram channel. If you enjoyed our signals and want to continue to receive ing them, please subscribe to our telegram channel:

The German Prelim GDP q/q, French Flash GDP q/q, and Spanish Flash GDP q/q report will remain in highlights today on the news front. Later Revised UoM Consumer Sentiment and Pending Home Sales m/m can drive market movements today.
Economic Events to Watch Today
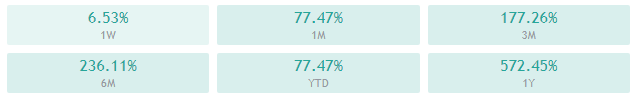
EUR/USD – Daily Analysis
The EUR/USD closed at 1.21220 after placing a high of 1.21422 and a low of 1.20806. The EUR/USD pair remained higher on Thursday amid the broad-based U.S. dollar weakness and the positive macroeconomic data from the European side. Behind the gradual upward momentum in EUR/USD pair was the U.S. dollar’s weakness driven by the improvement in the market’s appetite for risk. The U.S. Dollar Index that measures the greenback’s value against major currencies dropped by 0.3% and weighed on the U.S. dollar, supporting the upward momentum in EUR/USD pair on Thursday.
On the data front, from the U.S. side, at 18:30 GMT, the Advance GDP for the quarter declined to 4.0% against the forecasted 4.2% and weighed on the U.S. dollar that capped further gains in EUR/USD pair. The Unemployment Claims from last week were declined to 847K against the forecasted 880K and supported the U.S. dollar that also limited the upward momentum in EUR/USD pair. The Goods Trade Balance from December declined to -82.58B from the forecasted -83.4B and supported U.S. dollar. For December, the Prelim Wholesale Inventories also fell to 0.1% against the forecasted 0.5% and supported the U.S. dollar.
At 18:32 GMT, the Advance GDP Price Index for the quarter declined to 2.0% against the forecasted 2.2% and weighed on the U.S. dollar hat added further gains in EUR/USD pair. At 20:00 GMT, the C.B. Leading Index for December came in line with a 0.3% forecast. In December from the U.S., the New Home Sales declined to 842K against the forecasted 860K and weighed on U.S. dollar to and pushed the EUR.USD pair are even higher.
From the European side, the German Prelim CPI in January raised to 0.8% against the expected 0.4% and supported Euro that ultimately pushed EUR/USD pair higher. At 13:00 GMT, the Spanish Unemployment Rate dropped to 16.1% against the expected 16.7% and supported Euro to add further gains in EUR/USD pair on Thursday.
Moreover, Wall Street suffered its biggest one-day percentage decline in three months overnight, with declines accelerated in the wake of the U.S. Federal Reserve’s policy statement. The Fed signaled a worrying slowdown in the pace of recovery of the world’s top economy and sworn continued support until a full economic rebound was in place. This also weighed on the U.S. dollar and supported an upward momentum in EUR/USD pair.
Daily Technical Levels
Support Resistance
1.2054 1.2167
1.1999 1.2225
1.1940 1.2280
Pivot point: 1.2112
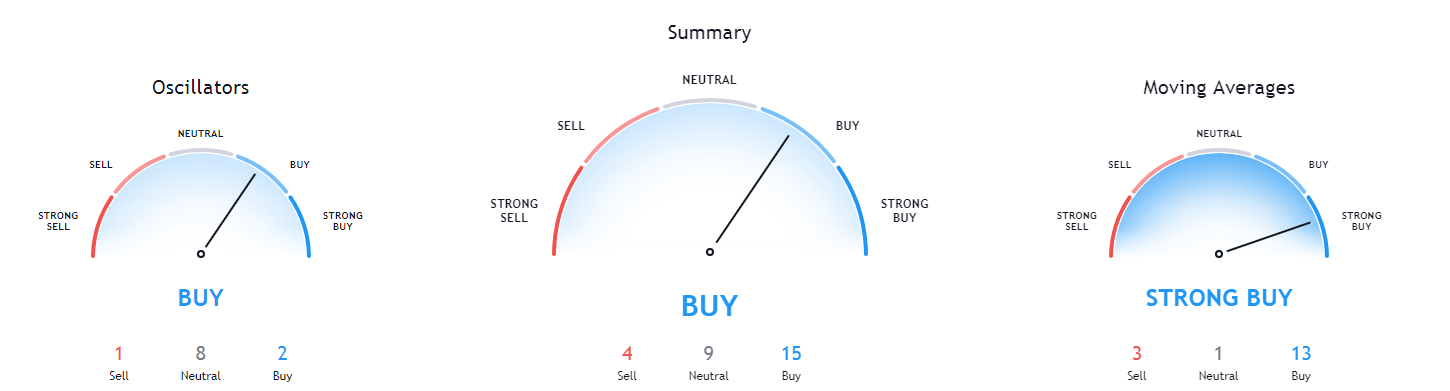
EUR/USD– Trading Tip
The direct currency pair EUR/USD is trading with a bearish bias at 1.2090, facing immediate resistance at 1.2132 level. The EUR/USD is again forming three black crows on the hourly chart, dispensing the selling trend in the EURUSD pair. On the downside, the pair is expected to go after the 1.2090 and 1.2055 level. The 50 periods EMA are signaling the selling trend in Euro today. Violation of 1.2050 will determine long term trend.
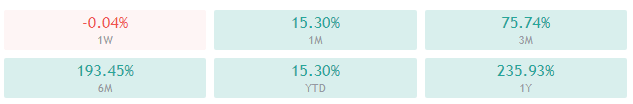
GBP/USD – Daily Analysis
The GBP/USD closed at 1.37267 after placing a high of 1.37458 and a low of 1.36299. The U.S. dollar’s fresh weakness and the rise in British Pound against other major currencies lifted the currency pair GBP/USD on Thursday. Prime Minister Boris Johnson announced no schools until 8-March and laid out a lengthy exit strategy from the lockdown this week. However, a detailed plan will be out on the week of February 22. This showed that Johnson may have learned from past promises and was now going wrong on the side of caution. Because people were expecting an earlier exit from the restrictions and this announcement killed their expectations.
In December, Johnson rejected calls for a lockdown and refused to cancel Christmas, only to back down several days later. However, the U.K. has been vaccinating its population rapidly, which should have led to the lifting restrictions not extending them. Despite all these lockdown developments in the U.K., the British Pound remained amongst the top three best performing G10 currencies on Thursday and supported the upward momentum in GBP/USD pair.
On the data front, from the U.S. side, at 18:30 GMT, the Advance GDP for the quarter fell to 4.0% against the anticipated 4.2% and weighed on the U.S. dollar that added more gains in GBP/USD pair. The Unemployment Claims from last week dipped to 847K against the anticipated 880K, supported the U.S. dollar, and capped further GBP/USD pair gains. The Goods Trade Balance fell to -82.58B from the anticipated -83.4B and supported the U.S. dollar from December. The Prelim Wholesale Inventories for December also fell to 0.1% against the anticipated 0.5% and supported the U.S. dollar.
At 18:32 GMT, the Advance GDP Price Index for the quarter fell to 2.0% against the anticipated 2.2% and weighed on the U.S. dollar that pushed the currency pair GBP/USD higher. At 20:00 GMT, the C.B. Leading Index for December came in line with the anticipation of 0.3%. The New Home Sales in December from the U.S. fell to 842K against the anticipated 860K and weighed on the U.S. dollar and supported the rising prices of the GBP/USD pair.
The declining GDP numbers from the world’s largest economy in the last quarter of 2020 added weight on the local currency U.S. dollar and supported the GBP/USD pair’s rising prices on Thursday. Furthermore, the market’s risk sentiment was somehow supported by the rally in precious metals markets triggered by speculation that retail traders who had been focusing on pumping stocks like GameStop were now turning their focus to silver. The rising risk sentiment in the market also helped the risk perceived GBP/USD pair rise on Thursday.
Daily Technical Levels
Support Resistance
1.3643 1.3746
1.3600 1.3804
1.3541 1.3848
Pivot point: 1.3702
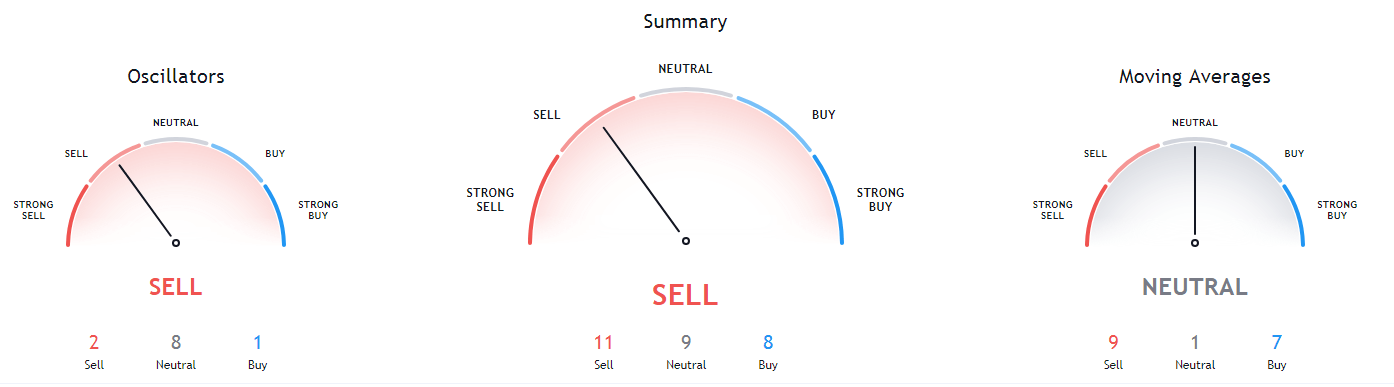
GBP/USD– Trading Tip
A day before, the GBP/USD pair traded bullish after violating the narrow trading range of 1.3680 – 1.3670. It placed a high of around 1.3753 level, and it later reversed back to trade between the same trading range of 1.3696 – 1.3646. The GBP/USD may find support around the 1.3647 level, and violation of this level can extend selling bias until 1.3610. Approaching the 2-hour timeframe, the GBP/USD is holding below 10 and 20 periods EMA, and it may extend the selling trend today. Let’s consider taking a sell trade until 1.3645 and 1.361 level.
USD/JPY – Daily Analysis
The USD/JPY pair was closed at 104.259 after placing a high of 104.460 and a low of 104.053. The currency pair USD/JPY extended its gains on Thursday amid the pickup in risk appetite in the market that drove weakness in both the U.S. dollar and Japanese Yen versus most of their major G10 counterparts due to their safe-haven status.
However, nominal U.S. yields rose on Thursday, with U.S. Treasury yields on the 10-year note up more than 4bps at 1.06%. It drove an increase in U.S./Japanese rate differentials that favor Japanese Yen flows into the U.S. dollar, supporting the currency pair USD/JPY. On the data front, at 04:50 GMT, the Retail Sales from Japan in December dropped to -0.3% against the expected -0.4% and supported Japanese Yen, and capped further upside in the USD/JPY pair.
From the U.S. side, at 18:30 GMT, the Advance GDP for the quarter decreased to 4.0% against the projected 4.2% and weighed on the U.S. dollar and limited further upside momentum in the USD/JPY pair. Last week, the Unemployment Claims decreased to 847K against the projected 880K and supported the U.S. dollar that added further gains in the USD/JPY pair. The Goods Trade Balance from December decreased to -82.58B from the projected -83.4B and supported the U.S. dollar and pushed the currency pair USD/JPY higher.
For December, the Prelim Wholesale Inventories also decreased to 0.1% against the projected 0.5% and supported the U.S. dollar that extended gains in the USD/JPY pair. At 18:32 GMT, the Advance GDP Price Index for the quarter decreased to 2.0% against the projected 2.2% and weighed on the U.S. dollar and capped further upside in the USD/JPY pair. At 20:00 GMT, the C.B. Leading Index for December came in line with the projection of 0.3%. In December from the U.S., the New Home Sales decreased to 842K against the projected 860K and weighed on the U.S. dollar and capped further gains in the USD/JPY pair.
Risk appetite in the market took a meaningful turn on Thursday, with U.S. equities erasing losses incurred on Wednesday leading up to the FOMC monetary policy decision event. The ultra-dovish tone of the Federal Reserve was actually seen as positive for the risk appetite as Wednesday’s risk-off was a result of overvaluation fears as well as because of the short-selling hedge funds being forced to liquidate profitable large-cap stock long positions as speculative retail trade-driven mania continued in the likes of GameStop. Furthermore, another reason behind the rising USD/JPY pair prices was that the U.S. stimulus package proposed by Joe Biden did not receive approval from Republicans as of yet. This also supported the U.S. dollar that ultimately added gains in the USD/JPY pair.
Daily Technical Levels
Support Resistance
103.71 104.34
103.33 104.58
103.09 104.96
Pivot point: 103.96
USD/JPY – Trading Tips
On Friday, the USD/JPY pair is trading with a bullish bias at 104.475, and it has violated the resistance level of 104.385. It’s likely to lead the USD/JPY pair until the 104.745 level. On the lower side, the USD/JPY may find support at the 104.300 level. The USD/JPY pair is likely to stay bullish as MACD and EMA suggest bullish bias in the USD/JPY pair on the four hourly timeframes. We can expect USDJPY to bounce off upon 104.300 to continue buying trend today. Good luck!