On the news front, the eyes will remain on the U.K. Monetary Policy reports due during the late European hours. BOE isn’t expected to change the rates, and it may keep them at 0.10%. However, it will be essential to see MPC Official Bank Rate Votes. Besides, the European Final CPI data will remain in focus today. During the U.S. session, the Unemployment Claims and Philly Fed Manufacturing Index will be the main highlight to drive further market movement.
Economic Events to Watch Today
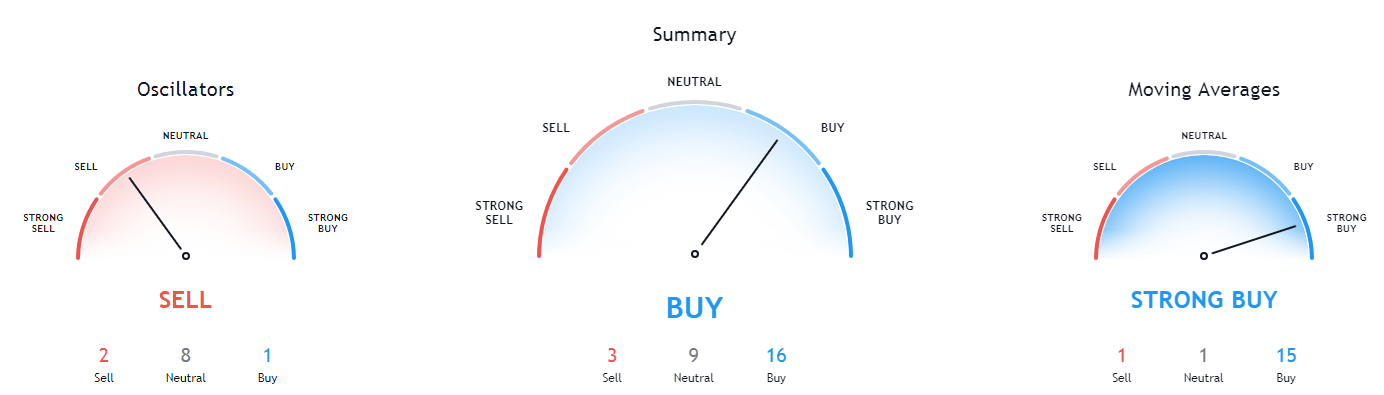
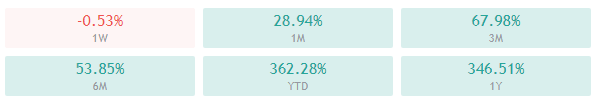
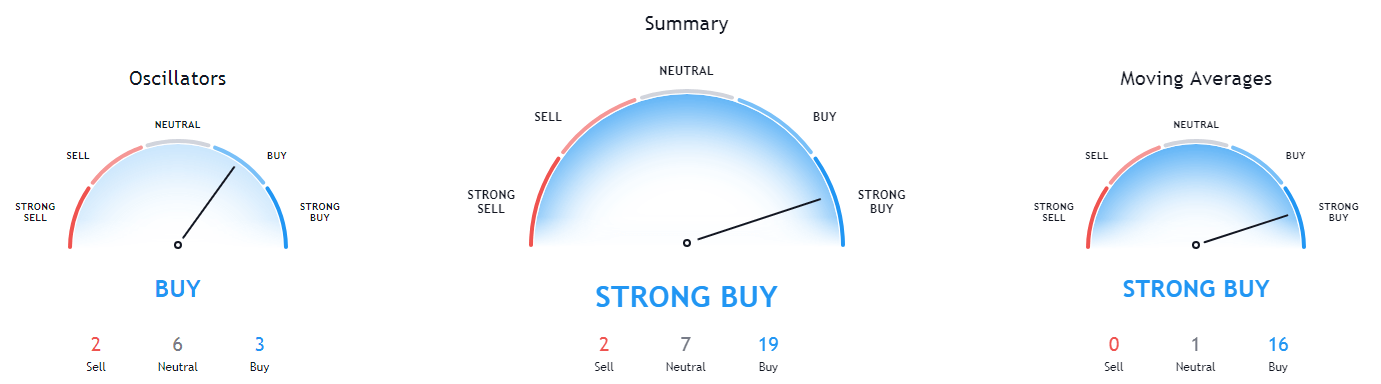
EUR/USD – Daily Analysis
The EUR/USD pair was closed at 1.21988 after placing a high of 1.22121 and a low of 1.21450. EUR/USD pair extended its gains and rose for 3rd consecutive day on Wednesday to reach its highest since April 2018.
EUR/USD pair broke above 1.22 level mainly because of the strong PMIs on Wednesday and the U.S. dollar weakness. On the data front, at 13:15 GMT, the French Flash Services PMI for December raised to 49.2 against the expected 39.9 and supported Euro. The French Flash Manufacturing PMI in December also raised to 51.1 against the estimated 50.0 and supported Euro.
At 13:30 GMT, the German Flash Manufacturing PMI in December surged to 58.6 against the forecasted 56.4 and supported Euro. The German Flash Services PMI also advanced to 47.7 against the expected 44.1 and supported Euro. At 14:00 GMT, the Flash manufacturing PMI from Eurozone raised to 55.5 against the forecasted 53.0 and supported Euro. The Flash Services PMI in December from the whole bloc also raised to 47.3 from the expected 41.9 and supported Euro. At 15:00 GMT, the Trade Balance from Eurozone for October came in greater than expected 22.1B as 25,9B and supported Euro.
The manufacturing and services sector in Eurozone advanced and showed growth in December that supported the single currency Euro and added in the daily gains of the EUR/USD pair. From the U.S. side, at 18:30 GMT, the Core Retail Sales for November declined to -0.9% against the projected 0.1% and weighed on the U.S. dollar and supported EUR/USD gains. For November, the Retail Sales also declined to -1.1% against the projected -0.3% and weighed on the U.S. dollar and added in the EUR/USD pair. AT 19:45 GMT, the Flash manufacturing PMI for December rose to56.5 against the projected 55.9 and supported the U.S. dollar, and capped further gains in EUR/USD pair.
The Flash Services PMI for December declined to 55.3 against the projected 55.7 and weighed on the U.S. dollar and supported momentum upward in EUR/USD pair. At 20:00 GMT, the Business Inventories for October rose to 0.7% against the projected 0.6%and weighed on the U.S. dollar. The NAHB Housing Market Index also declined to 86 against the projected 88 and weighed on the U.S. dollar, and added additional EUR/USD pair gains.
Apart from strong PMI figures, the latest news that Moderna’s vaccine was also up to getting emergency use authorization from the US FDA by the end of this week. This vaccine will be the second vaccine after Pfizer’s drug was approved last week and is currently being used on people. This news added in the risk sentiment and supported the risk perceived EUR/USD pair.
Furthermore, the Brexit hopes also raised on Wednesday and supported the single currency Euro after E.U.’s chief negotiator explained that she could not say if there will be a trade deal with Britain, but there had been progressing. The next few days would be critical. These developments also added to the upward trend of the EUR/USD pair on Wednesday.
Moreover, the Federal Reserve concluded its two-day meeting on Wednesday and decided to keep its interest rates at the same level until the inflation reaches its target. However, it decided to extend its Q.E. program that weighed on the U.S. dollar and supported the EUR/USD pair’s upward trend.
Daily Technical Levels
Support Resistance
1.2126 1.2175
1.2077 1.2197
1.2099 1.2224
Pivot point: 1.2148
EUR/USD– Trading Tip
The EUR/USD bullish bias continues to dominate the market as it’s trading at 1.2225. On the higher side, the EUR/USD may target the 1.2250 level and 1.2282 resistance areas. The direct currency pair may find support at 1.2175, which is extended by a double top resistance, which now is working as a support. The MACD and RSI are supporting bullish bias along with the 50 periods EMA. We can expect a continuation of a bullish trend in the EUR/USD today.
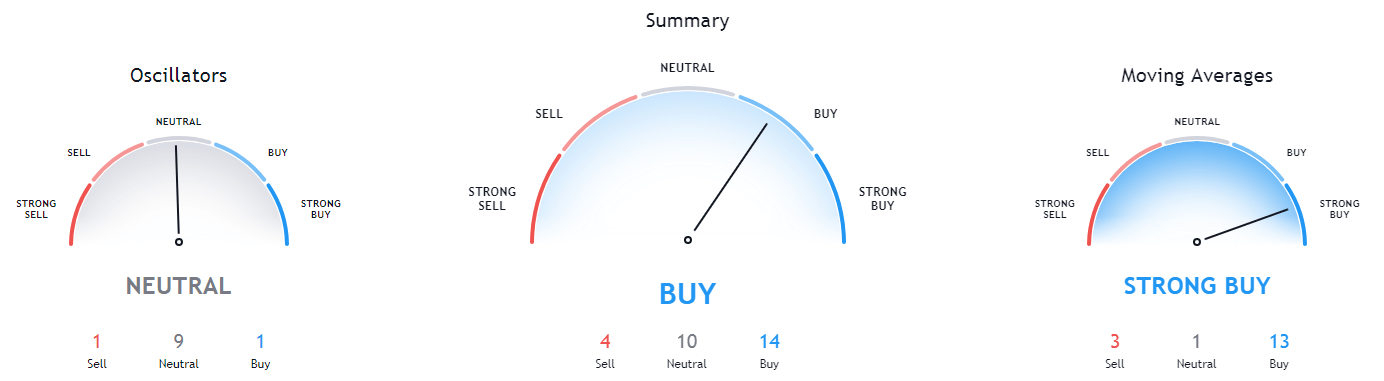
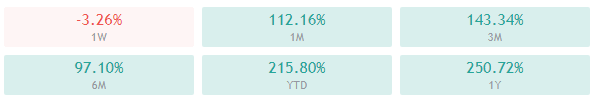
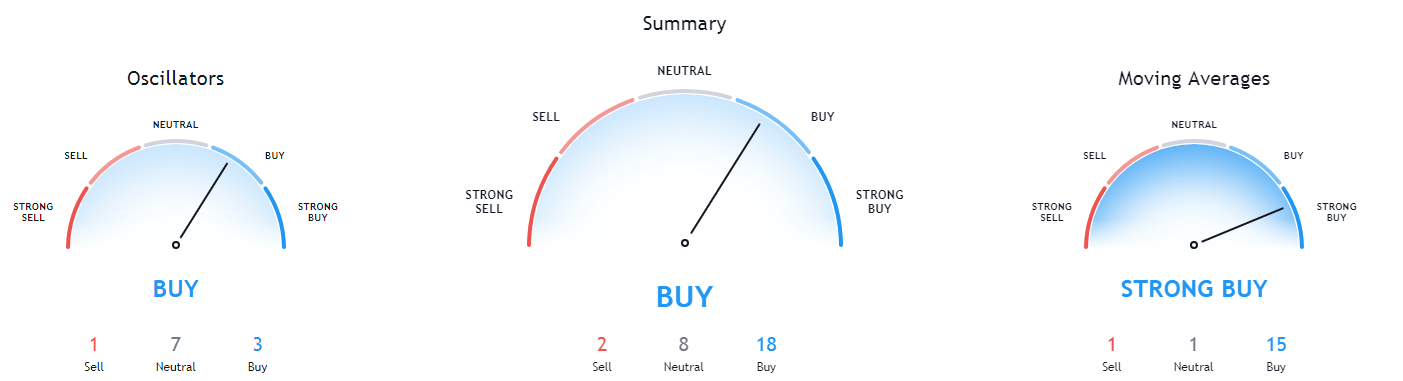
GBP/USD – Daily Analysis
The GBP/USD pair was closed at 1.35083 after placing a high of 1.35543 and a low of 1.34340. GBP/USD pair extended its gains on Wednesday and rose to its highest level since May 2018. The British Pound pared gains on Wednesday against the U.S. dollar as reports suggested that U.K. and E.U. were close to a breakthrough on a key sticking point amid the ongoing talks. The President of European Commission Ursula von der Leyen said that there was a narrow path to an agreement on a post-Brexit trade deal with the U.K.
The U.K. acknowledged that some progress had been made but continued to suggest a no-deal was most likely outcome as significant differences remain. Reports suggested that progress has been made over the level playing rules, but differences remain over the fisheries issue, as fishing quotas remain a challenge in negotiations.
However, the U.K. has softened its tone on fisheries in a bid to get a deal over the line. Britain ditched the demands for fishing vessels operating under the U.K. flag to be majority British-owned in the post Brexit era. Whereas PM Boris Johnson remained harsh in his speech on Wednesday and said that the E.U. should realize that the U.K. has a right to take control over its land and waters like every other country.
The hopes for the Brexit trade deal increased as the recent progress on talks came as both sides were coming under increasing pressure to secure a deal before the transition period on December 31. These hopes kept the British Pound supported and GBP/USD pair higher.
On the data front, at 12:00 GMT, the Consumer Price Index from the U.K. for November fell short of expectations of 0.6% and came in as 0.3% that weighed on the British Pound. In November, the Core CPI also fell to 1.1% against the expectations of 1.4% and weighed on Sterling. The RPI of the year from the U.K. for November also declined to 0.9% against the forecasted 1.3% and weighed heavily on GBP. At 12:02 GMT, the PPI Input from the U.K. declined to 0.2% from the expected 0.4% in November and weighed on the British Pound. The PPI Output, however, remained flat with the expectations of 0.2%. At 14:30 GMT, the Flash manufacturing PMI in December from Great Britain raised to 57.3 against the projected 55.9 and supported British Pound and added GBP/USD pair gains. The Flash Services PMI, however, declined to 49.9 against the forecasted 50.5 in December and weighed on Sterling. The Housing Price Index for October advanced to 5.4% against the estimated 5.1% and supported British Pound.
Most of the data came in against the British Pound; however, the currency pair GBP/USD remains on the upside over the latest Brexit optimism.
From the U.S. side, at 18:30 GMT, the Core Retail Sales for November fell to -0.9% against the anticipated 0.1% and weighed on the U.S. dollar and supported GBP/USD pair. The Retail Sales for November also fell to -1.1% against the anticipated -0.3% and weighed on the U.S. dollar and added gains in GBP/USD pair.
At 19:45 GMT, the Flash manufacturing PMI for December surged to56.5 against the anticipated 55.9 and supported the U.S. dollar. The Flash Services PMI for December fell to 55.3 against the anticipated 55.7 and weighed on the U.S. dollar. At 20:00 GMT, the Business Inventories for October surged to 0.7% against the anticipated 0.6%and weighed on the U.S. dollar. The NAHB Housing Market Index also fell to 86 against the anticipated 88 and weighed on the U.S. dollar and added further gains in GBP/USD pair.
Daily Technical Levels
Support Resistance
1.3338 1.3258
1.3213 1.3595
1.3147 1.3719
Pivot point: 1.3404
GBP/USD– Trading Tip
Since the Cable is also a direct currency pair and the dollar is getting weaker, we can expect a continuation of an upward trend in the GBP/USD pair. The GBP/USD pair may find resistance at 1.3600 and 1.3706 level, while the support level stays at 1.3470 marks. The MACD and EMA are supporting the bullish trend in the Cable. On the 4 hour timeframe, the GBP/USD pair has formed an upward channel, which may keep pushing the Sterling further higher today. The buying trend can be seen over 1.3470 level until 1.3600 and 1.3706 level.
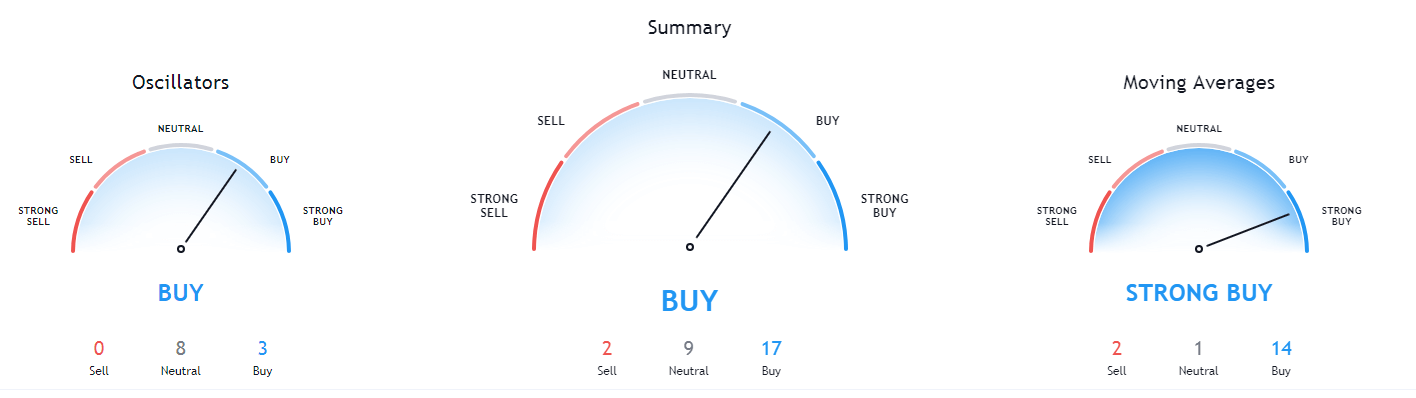
USD/JPY – Daily Analysis
The USD/JPY pair was closed at 103.419 after placing a high of 103.915 and a low of 103.259. The USD/JPY pair extended its losses on Wednesday and reached its lowest since November 9. The USD/JPY pair dropped on Wednesday amid the U.S. dollar weakness due to rising stimulus hopes and growing vaccine optimism. The U.S. lawmakers made progress toward a coronavirus relief package that added weight on the U.S. dollar and dragged the USD/JPY pair on the downside. The U.S. Dollar Index that tracks the greenback against a basket of six other currencies was down on Wednesday to 0.1% at 90.317.
The bipartisan group had originally proposed a $908 billion stimulus bill, but it has now been split into two bills. The first bill includes a $748 billion proposal, including aid for vaccine distribution and unemployment benefits. This bill has gained traction and is expected to pass by Congress by the end of the week. The second bill that is worth $160 billion for local and state government support along with the temporary coronavirus liability protection that appears to be having more difficulty in gathering the necessary support from Congress.
On the data front, at 04:50 GMT, the Trade Balance from Japan for November surged to 0.57T against the forecasted 0.54T and supported the Japanese Yen that added further losses in the USD/JPY pair. At 05:30 GMT, the Flash Manufacturing PMI from Japan in December also raised to 49.7 against the forecasted 48.9 and supported the Japanese Yen that added additional losses in USD/JPY pair.
Meanwhile, the Federal Reserve kept its interest rates unchanged on Wednesday and said that they would remain the same until the inflation reaches 2-3%. However, Federal Reserve also announces to purchase at least $120 Billion of U.S. treasuries and mortgage-backed securities each month until employment gets better. This way to support the U.S. economy by increasing bond purchases also weighed on the U.S. dollar and dragged the USD/JPY pair on the downside.
From the U.S. side, at 02:00 GMT, the TIC Long-Term Purchases dropped to 51.9B against the forecasted 75.5 B and weighed on the U.S. dollar, and supported the downside movement in the USD/JPY pair. At 18:30 GMT, the Core Retail Sales for November decreased to -0.9% against the estimated 0.1% and weighed on the U.S. dollar and weighed on the USD/JPY pair. The Retail Sales for November also decreased to -1.1% against the estimated -0.3% and weighed on the U.S. dollar. AT 19:45 GMT, the Flash manufacturing PMI for December advanced to56.5 against the estimated 55.9 and supported the U.S. dollar.
The Flash Services PMI for December decreased to 55.3 against the estimated 55.7 and weighed on the U.S. dollar and dragged the USD/JPY pair on the downside. At 20:00 GMT, the Business Inventories for October advanced to 0.7% against the estimated 0.6%and weighed on the U.S. dollar. The NAHB Housing Market Index also decreased to 86 against the estimated 88 and weighed on the U.S. dollar and added further losses in the USD/JPY pair.
Another factor included in the losses of the USD/JPY pair was the increasing risk sentiment of the market from another coronavirus vaccine. Moderna has also applied for emergency use authorization of its vaccine from the U.S. regulatory FDA that is expected to approve within a week. Moderna will become the second company to get authorization from the U.S. regulator after Pfizer got approval last week and is currently being roll-out. This latest news added in the risk sentiment and weighed on the safe-haven Japanese Yen that ultimately weighed on the USD/JPY pair.
Daily Technical Levels
Support Resistance
103.47 104.02
103.25 104.37
102.91 104.58
Pivot point: 103.81
USD/JPY – Trading Tips
The USD/JPY extends it’s selling trend as the pair trades at 103.250. The safe-haven currency pair is trading below an immediate support level of 103.250, and the closing of candles below this level will confirm the bearish breakout. If this happens, we may have an opportunity to short the USD/JPY pair today. Bearish bias seems solid as the MACD is forming histograms below 0, and the 50 periods EMA is holding around 103.860 level, suggesting strong odds of selling. On the lower side, the USD/JPY pair may find next support at the 102.900 level. Let’s consider taking a selling trade below 103.650 today. Good luck!