In this weekly BTC/USD analysis, we will be taking a brief look at the most recent events, current chart technical formations, as well as the possible BTC short-term price outcomes.
Overview
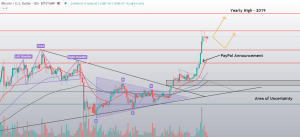
Bitcoin has spent the week constantly pushing towards the upside, with its price moving from around $16,500 on Monday all the way up to $19,000 at one point on Saturday. This left Bitcoin holders in a dilemma: should they hold or hedge their investments. Most holders are already satisfied with the BTC movement and don’t want to invest at such a high price, while some are hedging or even selling their funds to take a profit. On the other hand, such a large rally has “invited” the retail market to join in, and they are the majority of the buy force, alongside institutional investors that do not care about the current price and just want to invest every time they have funds available.
While many analysts called for a stronger pullback long before the most recent push, all significant bear-related signals were false.
Technical factors
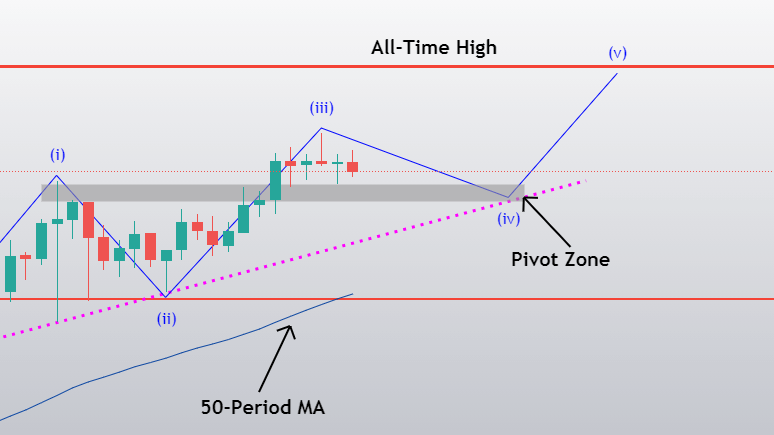
Bitcoin has continued moving up, supported by the 50-period MA, which has proven as great support, as well as by the ascending (pink dotted) line. On top of that, the largest cryptocurrency by market cap has done a great job pushing through its previous highs and making higher highs/higher lows. If we consider the year-to-date Bitcoin balance on exchanges dropping 18% and institutions being more and more involved, we can almost certainly expect a long-term price increase.
The hash ribbons indicator is showing miner capitulation (ever since Oct 29), sending out a major buy/accumulation signal.
Likely Outcomes
Bitcoin has one main scenario, as well as one supporting scenario that is likely to play out.
1: If Bitcoin manages to hold the so-called pivot zone (18,250-$18,450), it is almost certain to bounce and reach the all-time high level, and possibly even pass it. In that case, longing Bitcoin after it confirms its position above the pivot zone is a great trade, as it has defined targets (target 1 = Bitcoin’s ATH; target 2 = ride the bull wave and continuously take profit until volume dies out) as well as a defined stop-loss target (right below the pivot zone).
If the first scenario plays out, it will most likely play out on the Nov 23rd, as this is when the pivot zone is meeting the ascending support line and (most likely) the 50-period moving average.
2: The second (and a bit less likely) scenario happens when Bitcoin fails to hold the pivot zone, in which case we can expect a price drop to $17,260.
A move that will end up below $17,260 is highly unlikely, simply due to the overall sentiment currently surrounding Bitcoin.