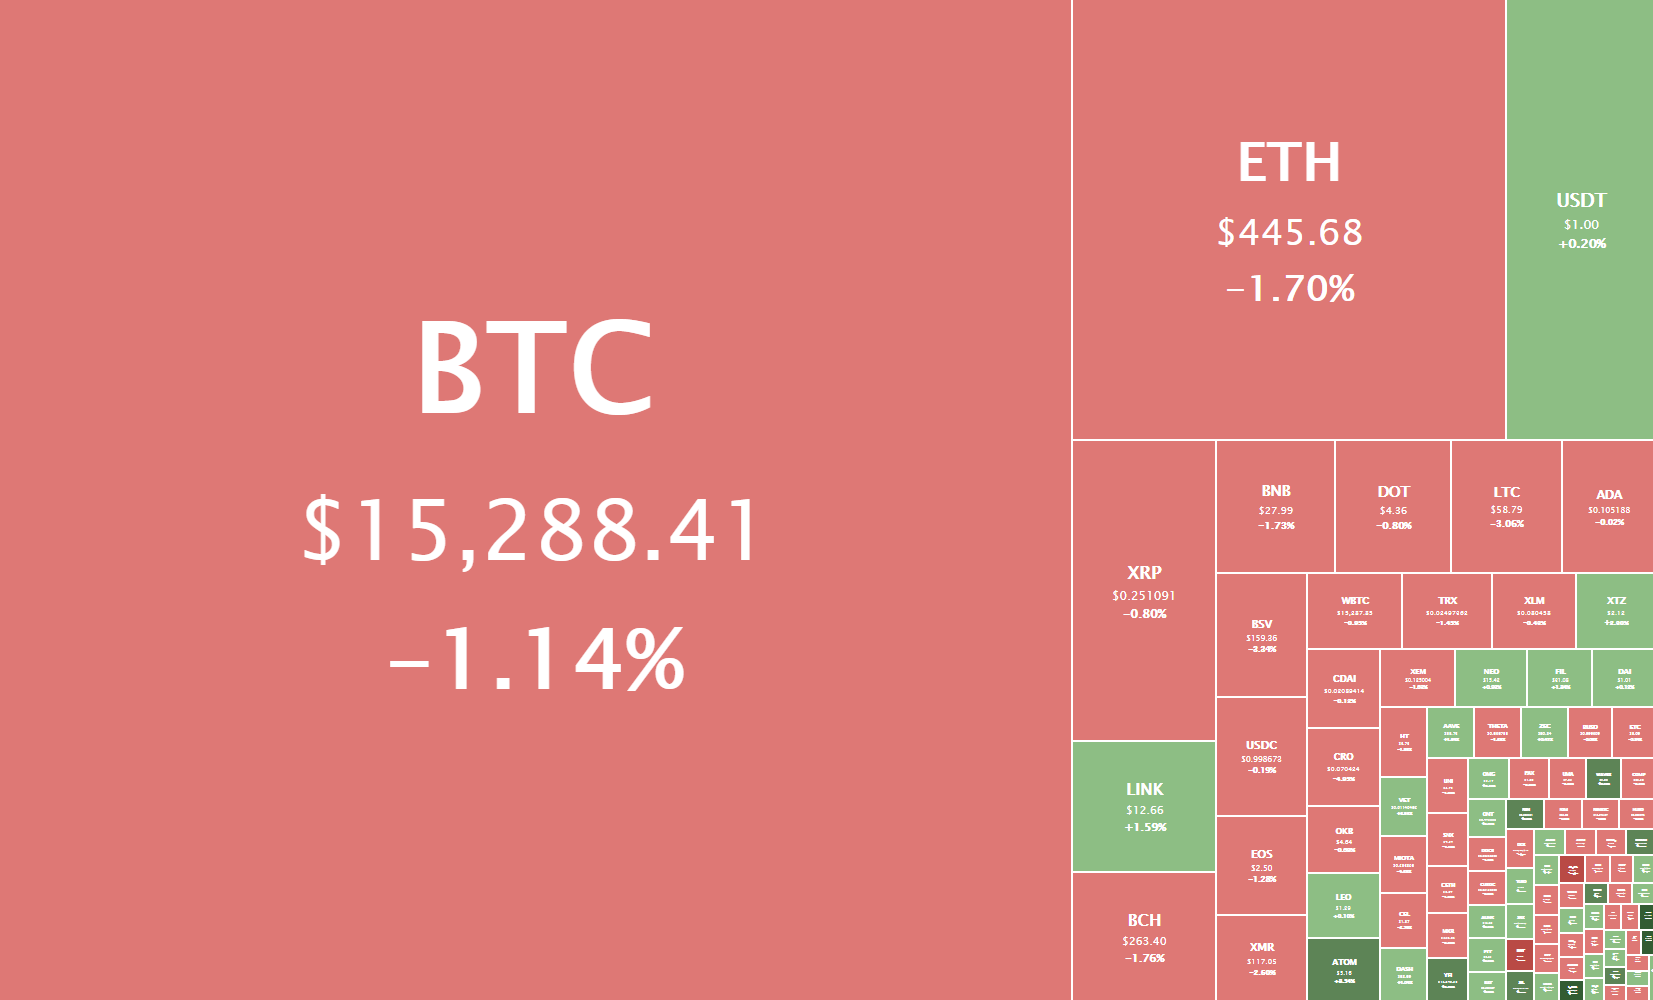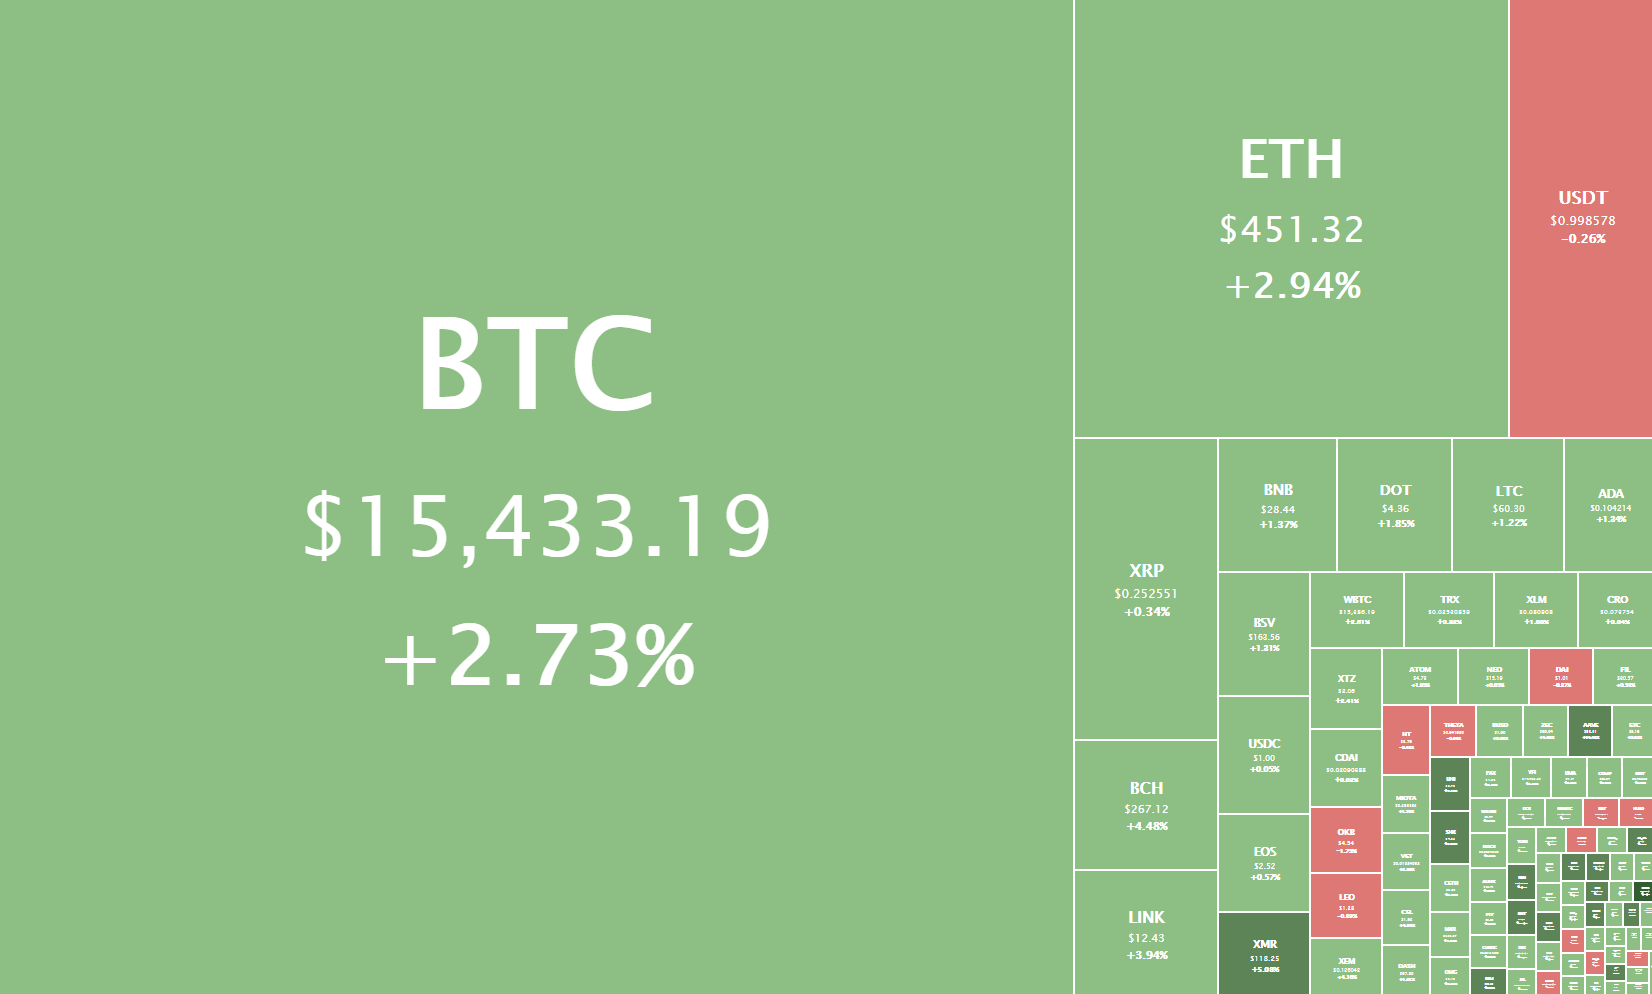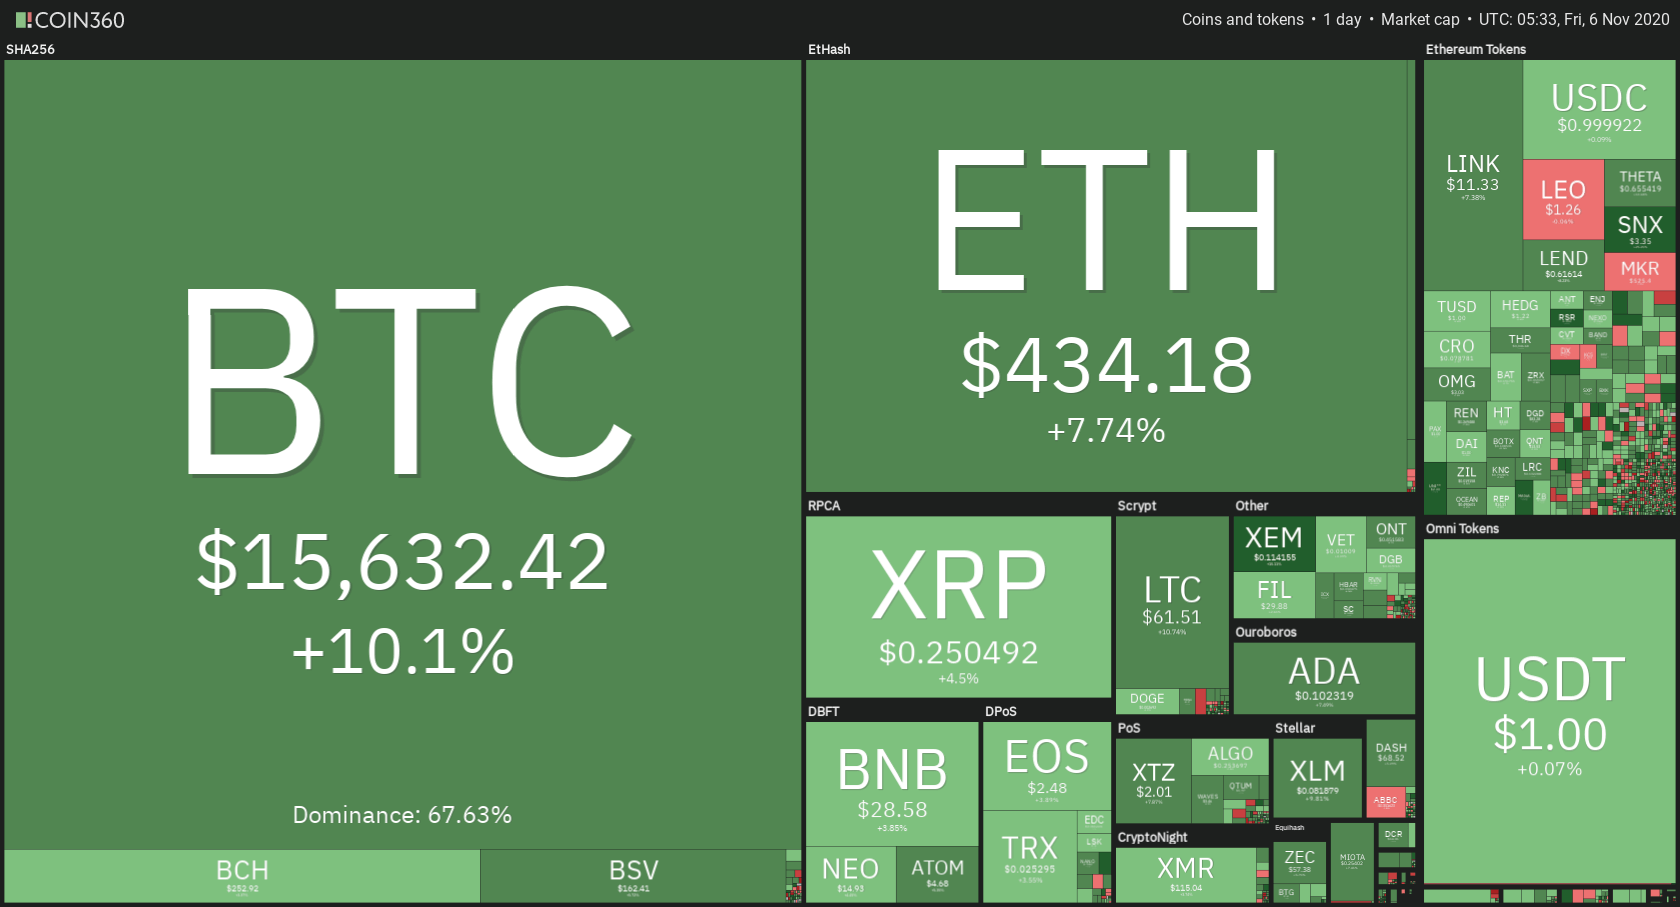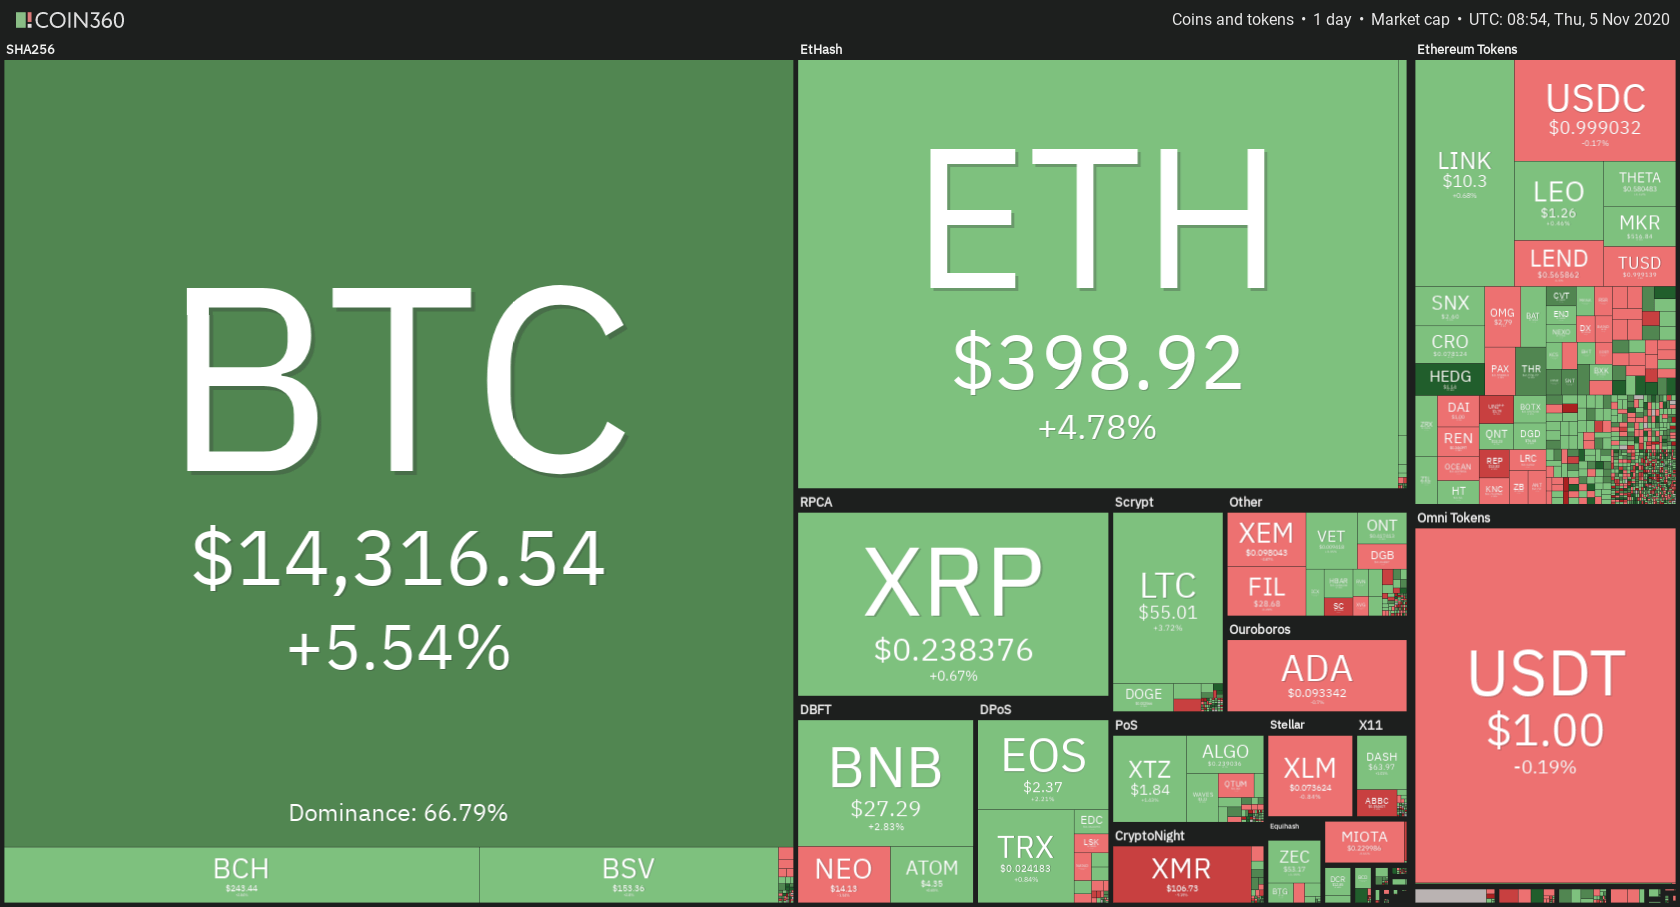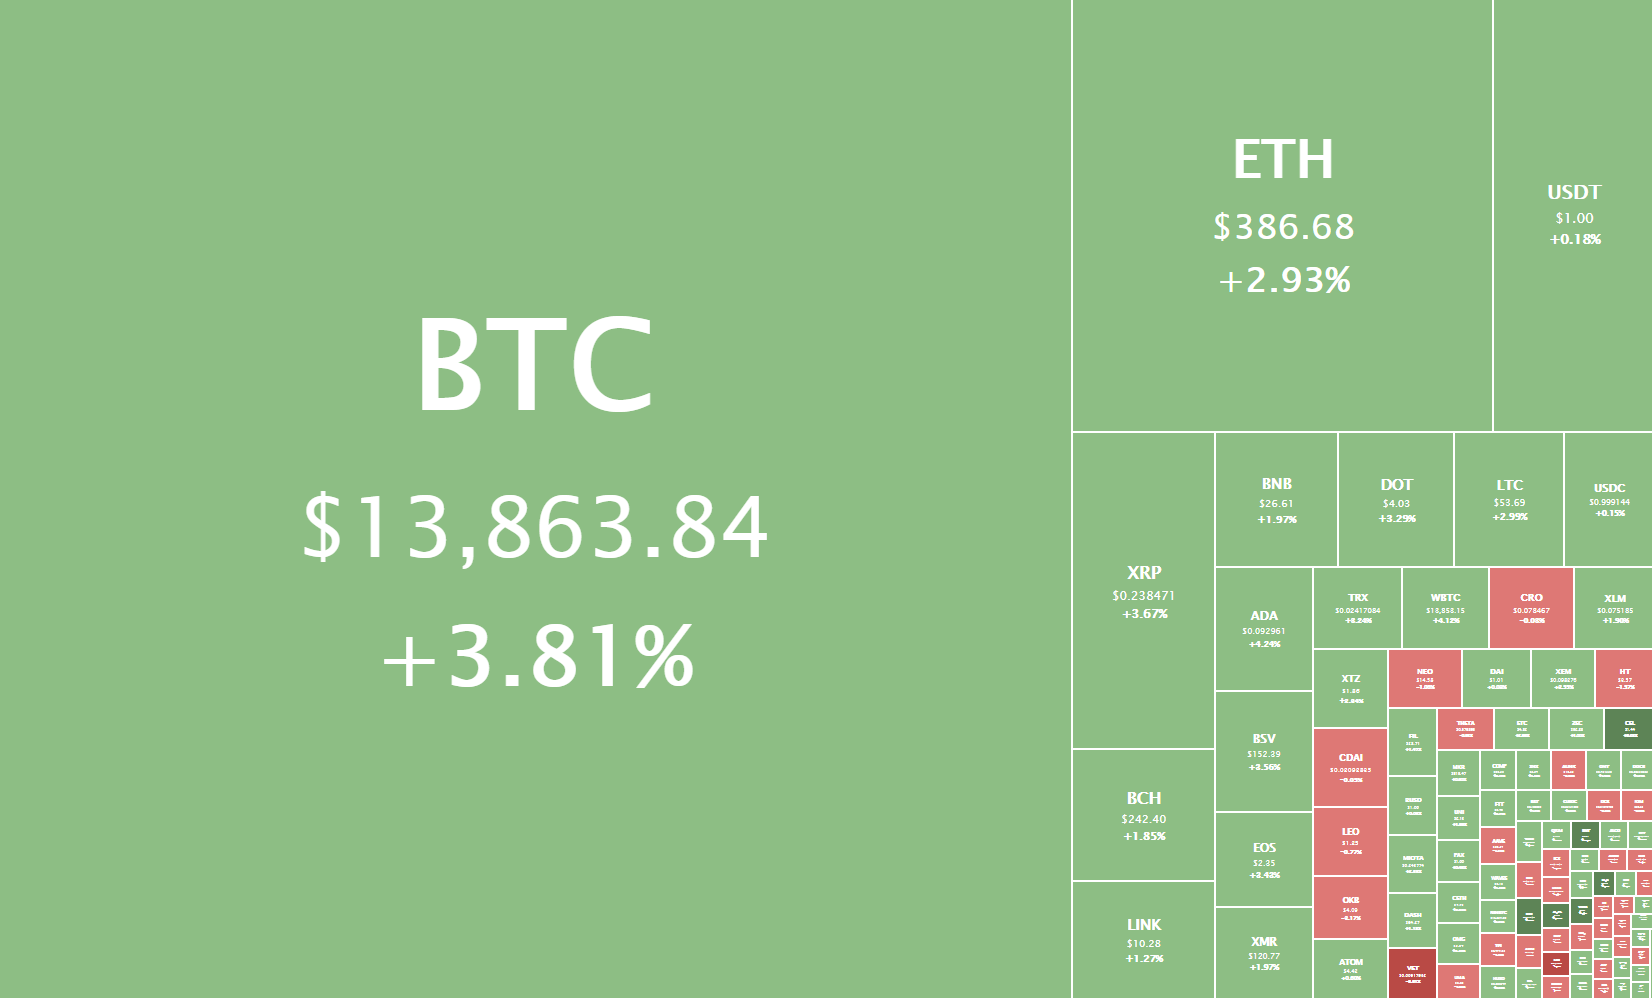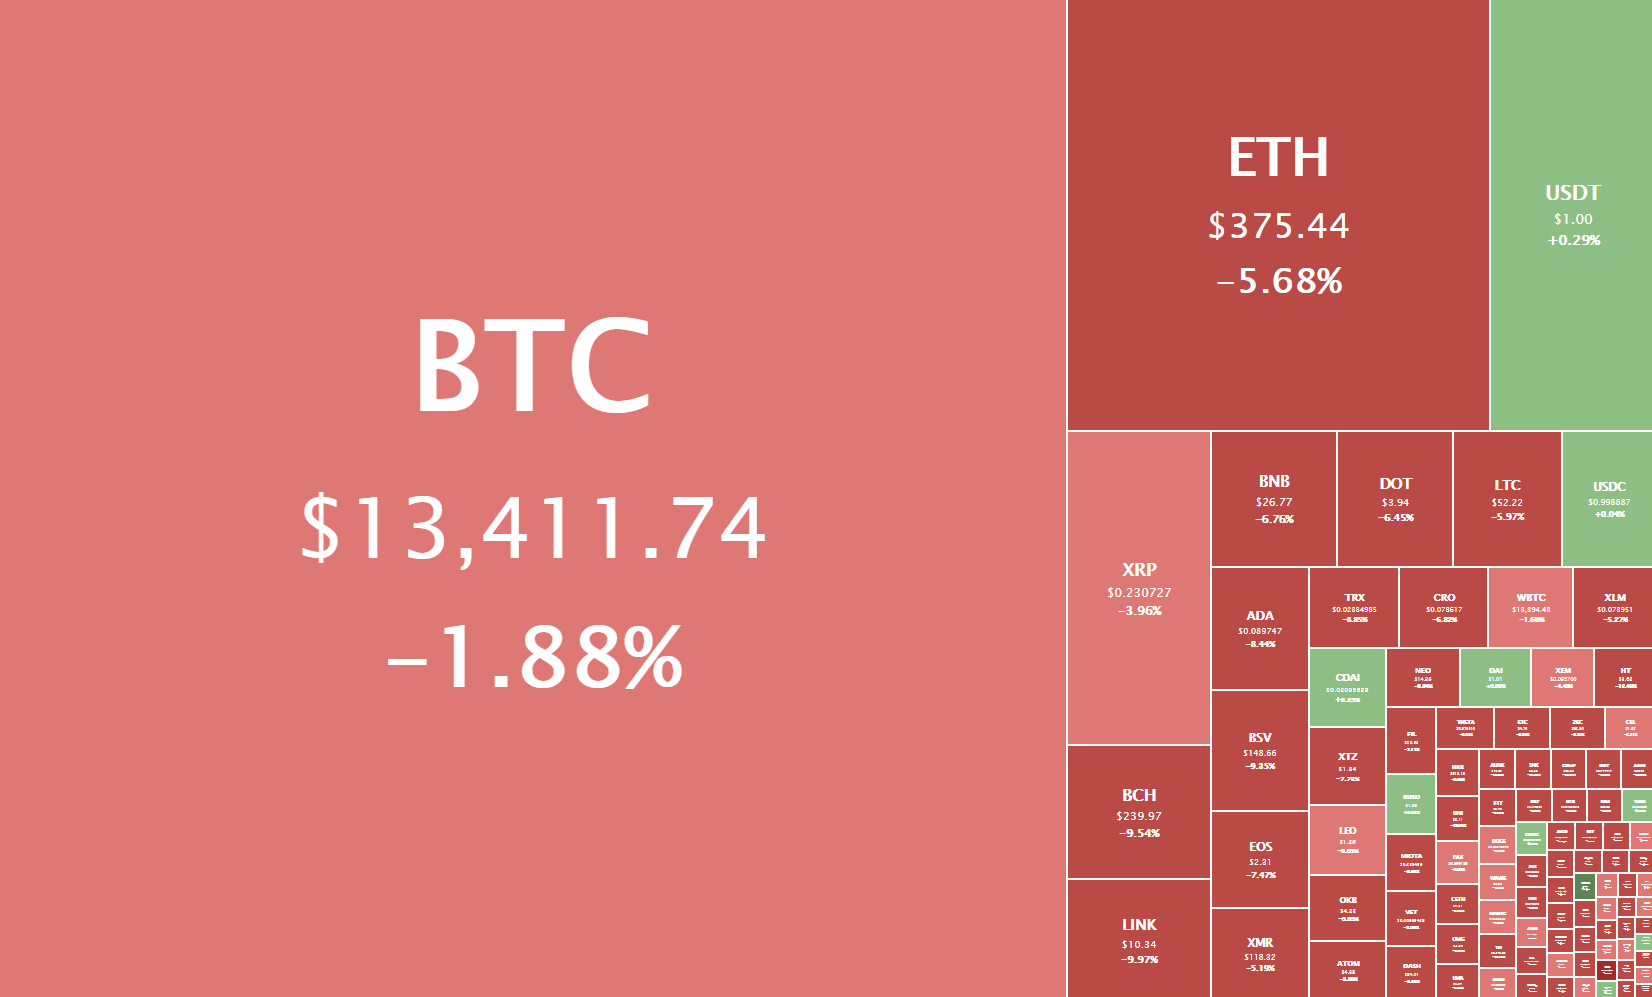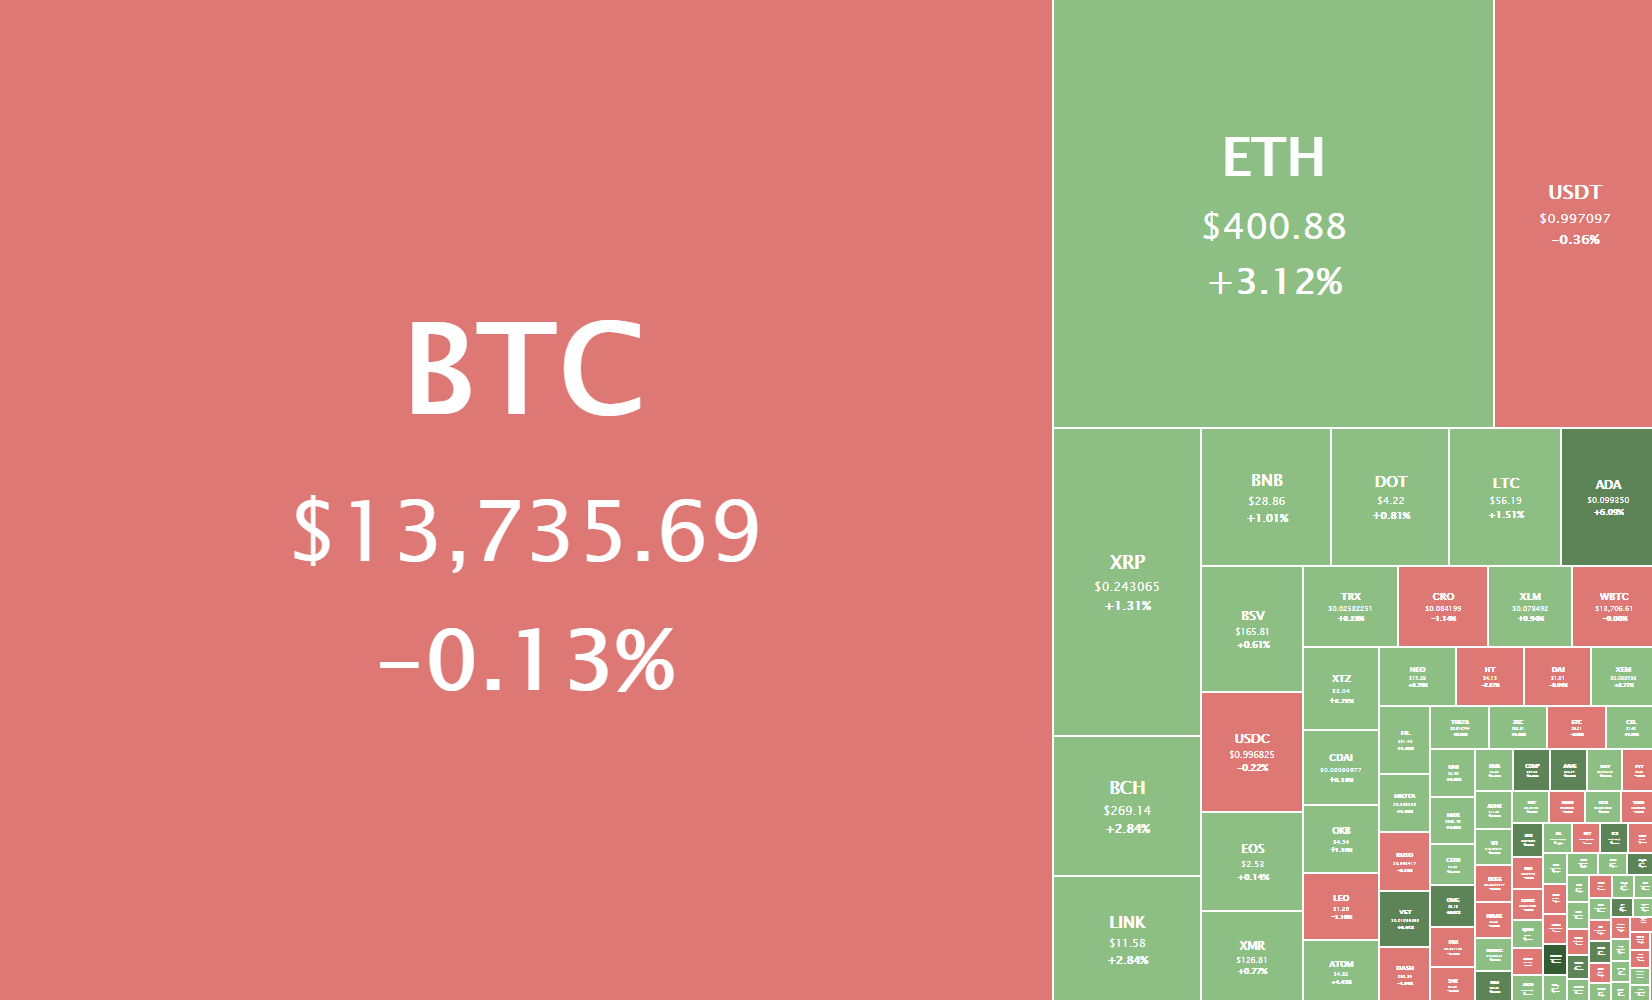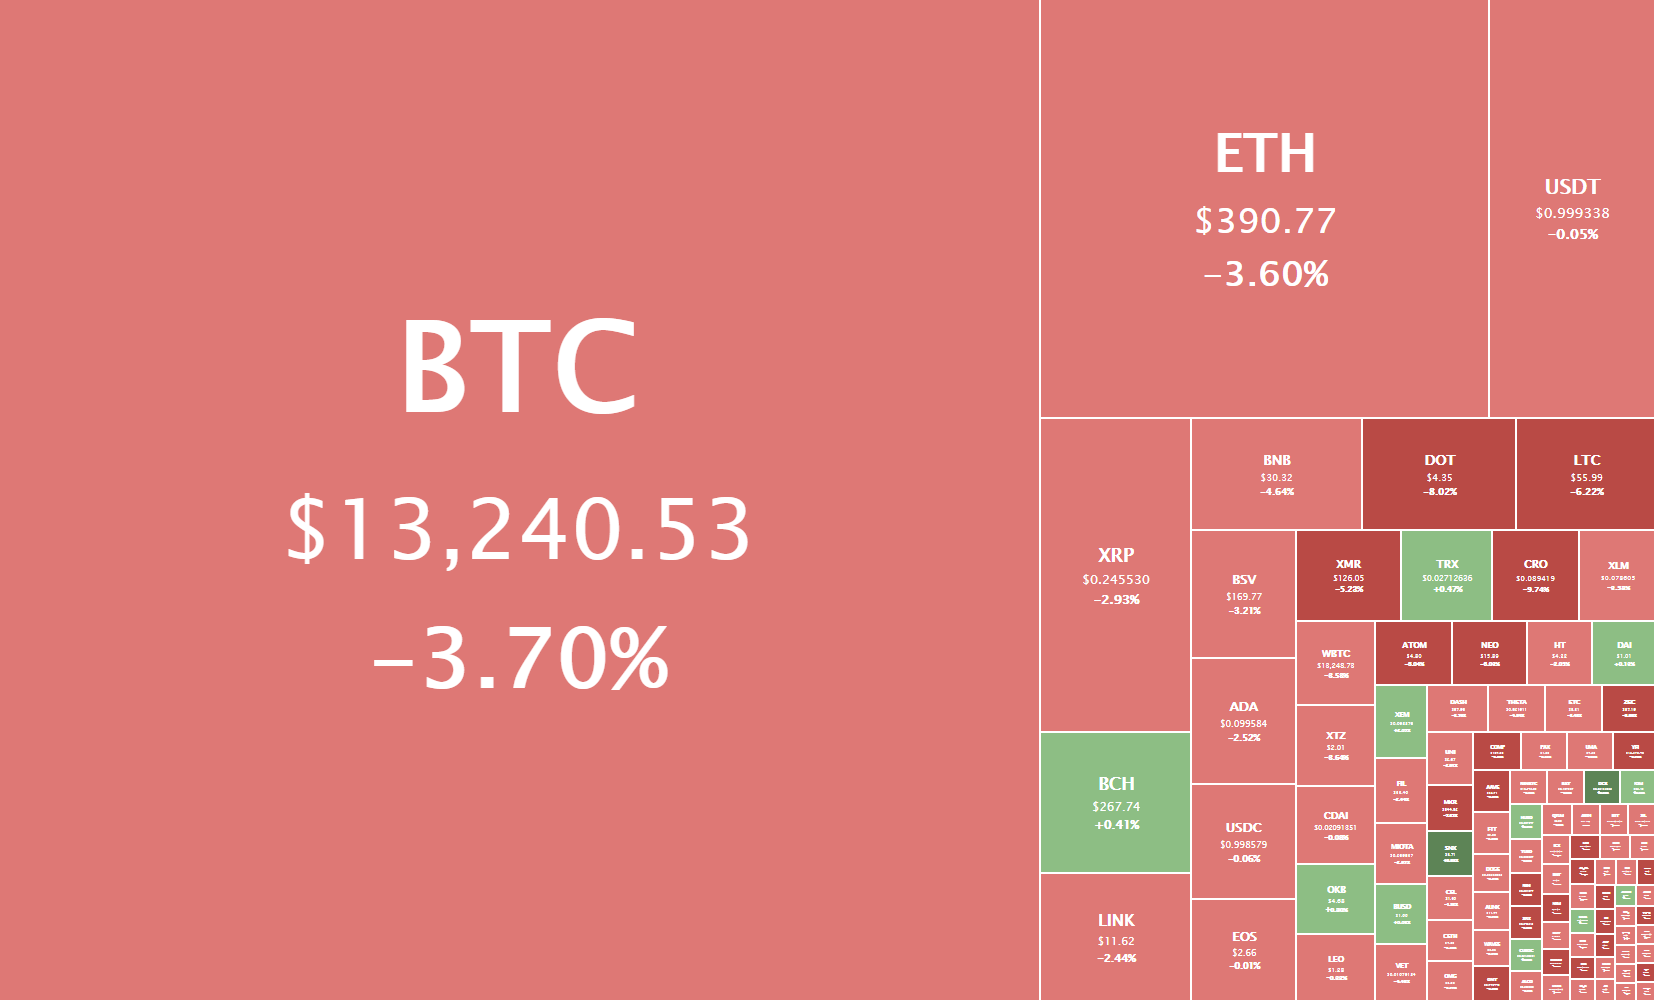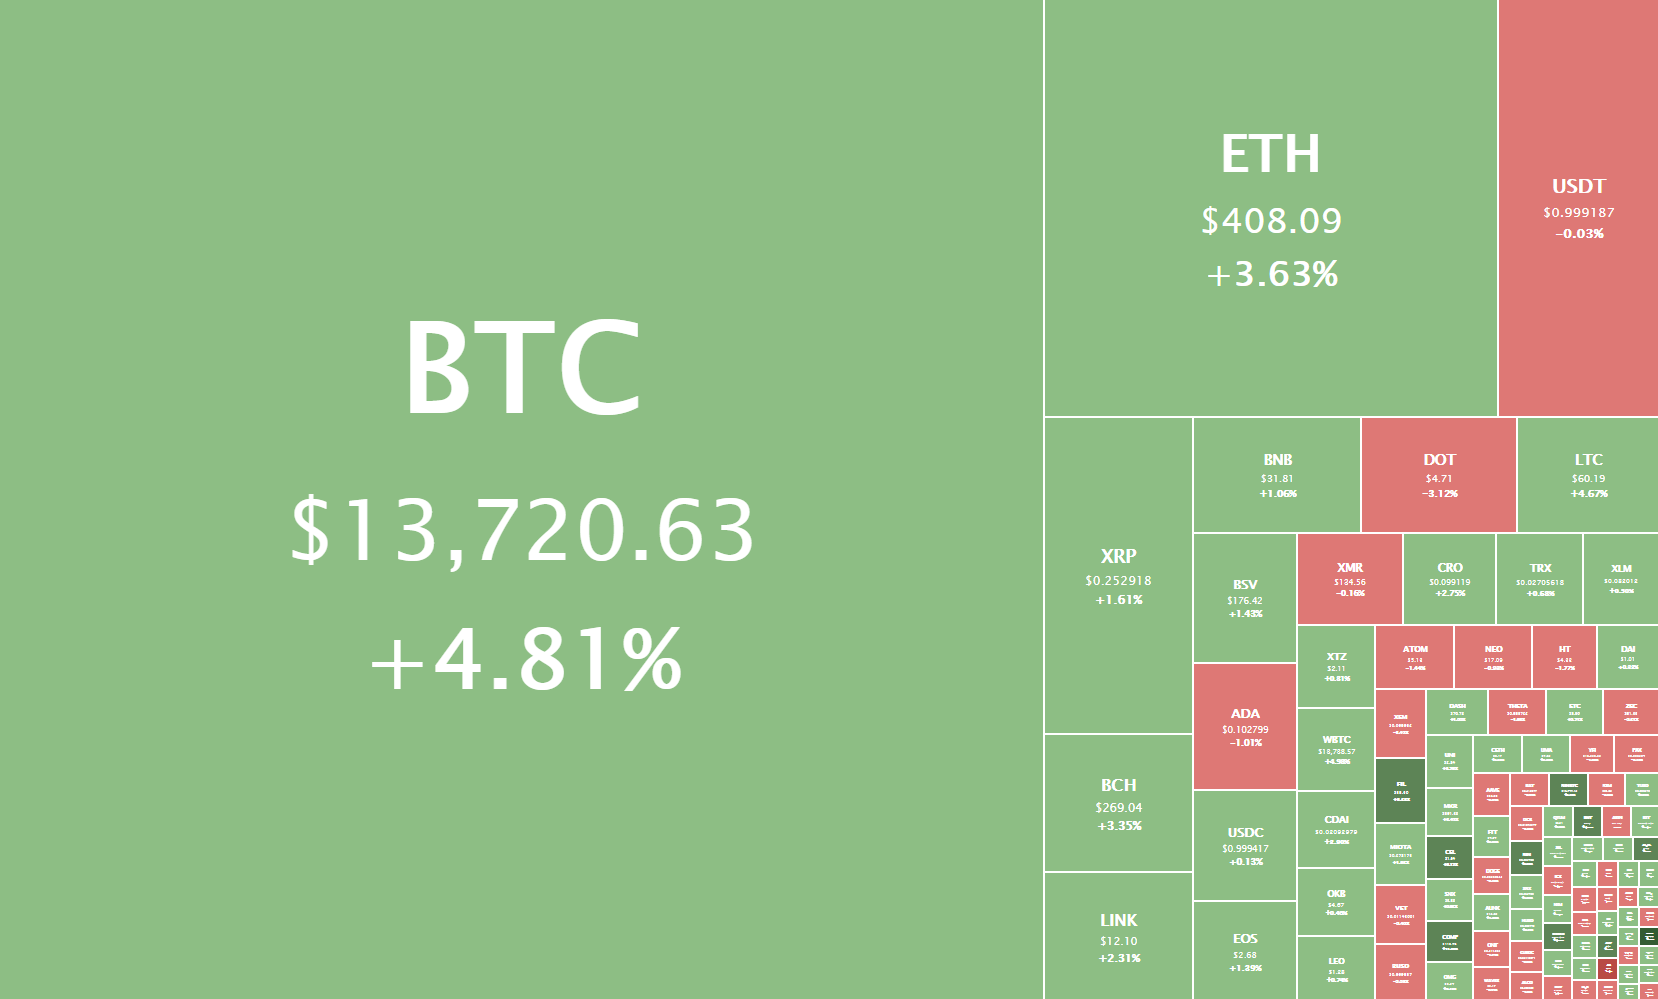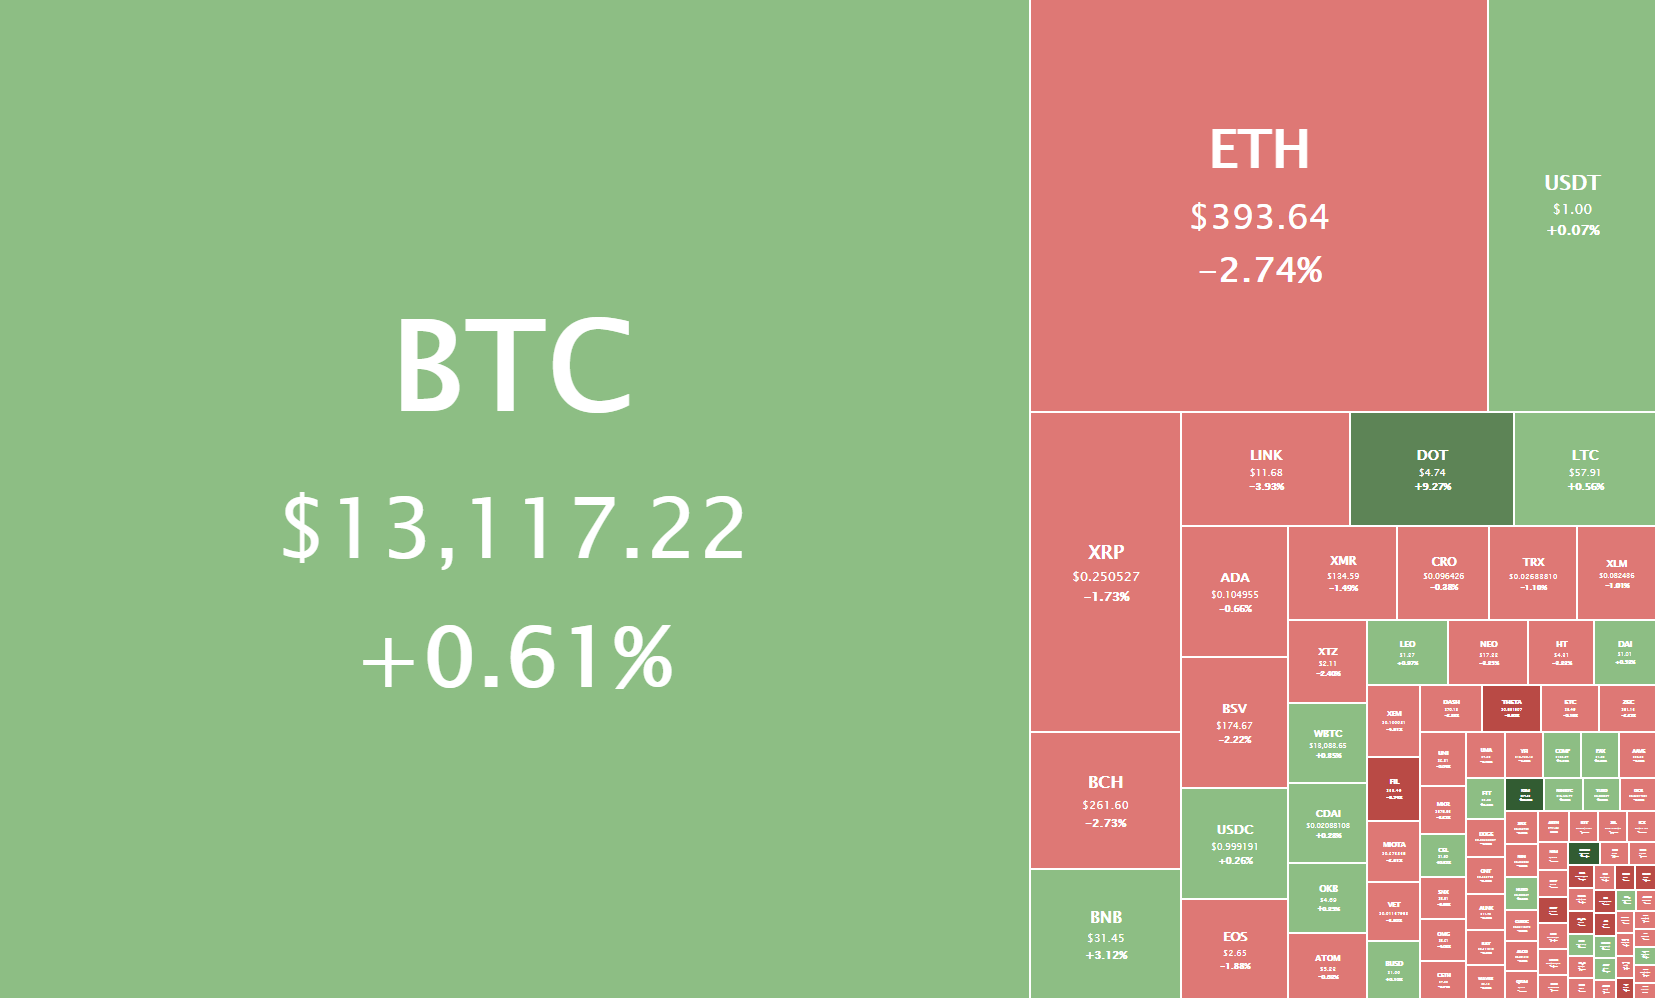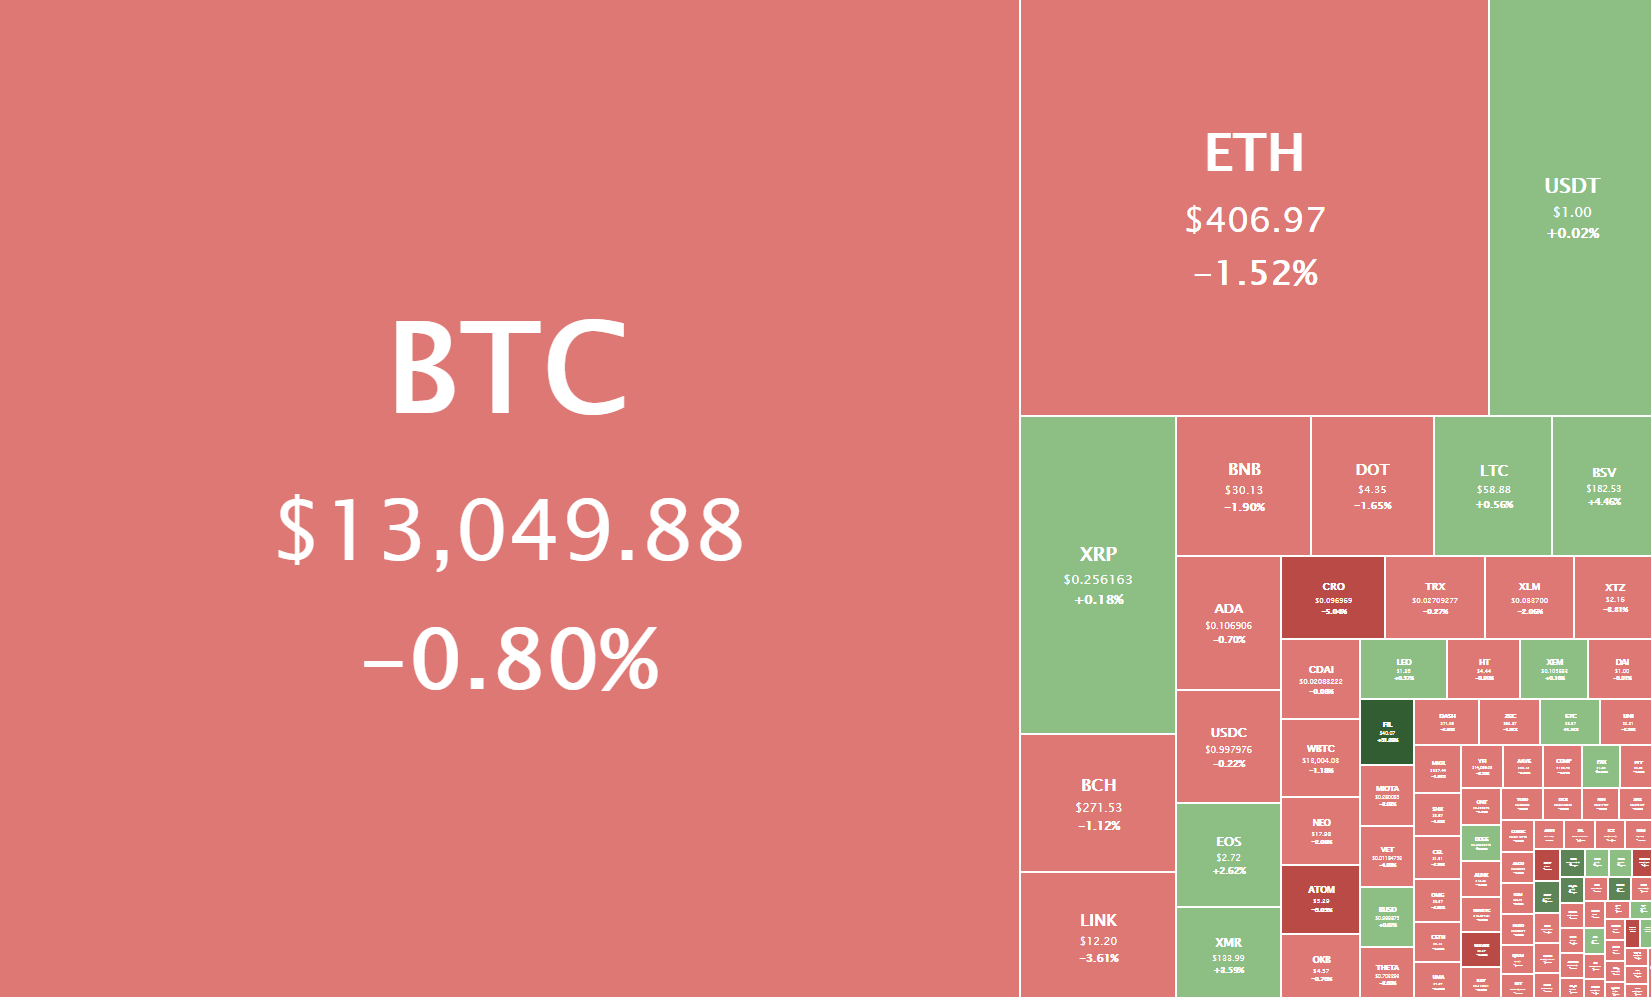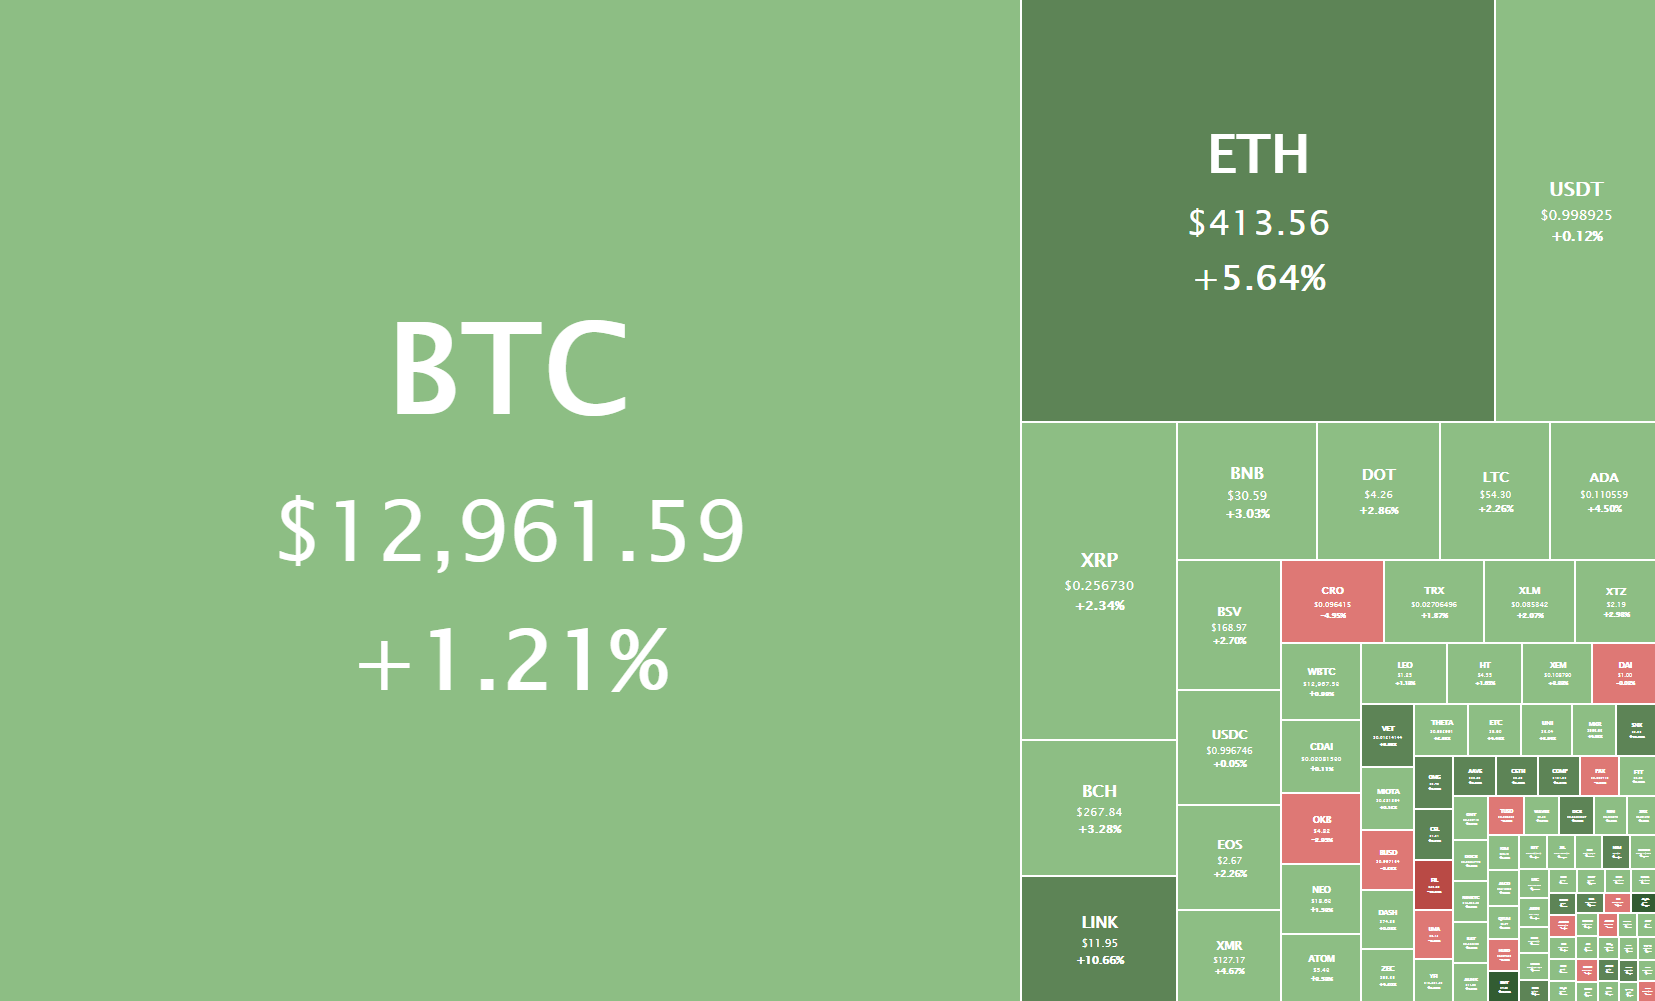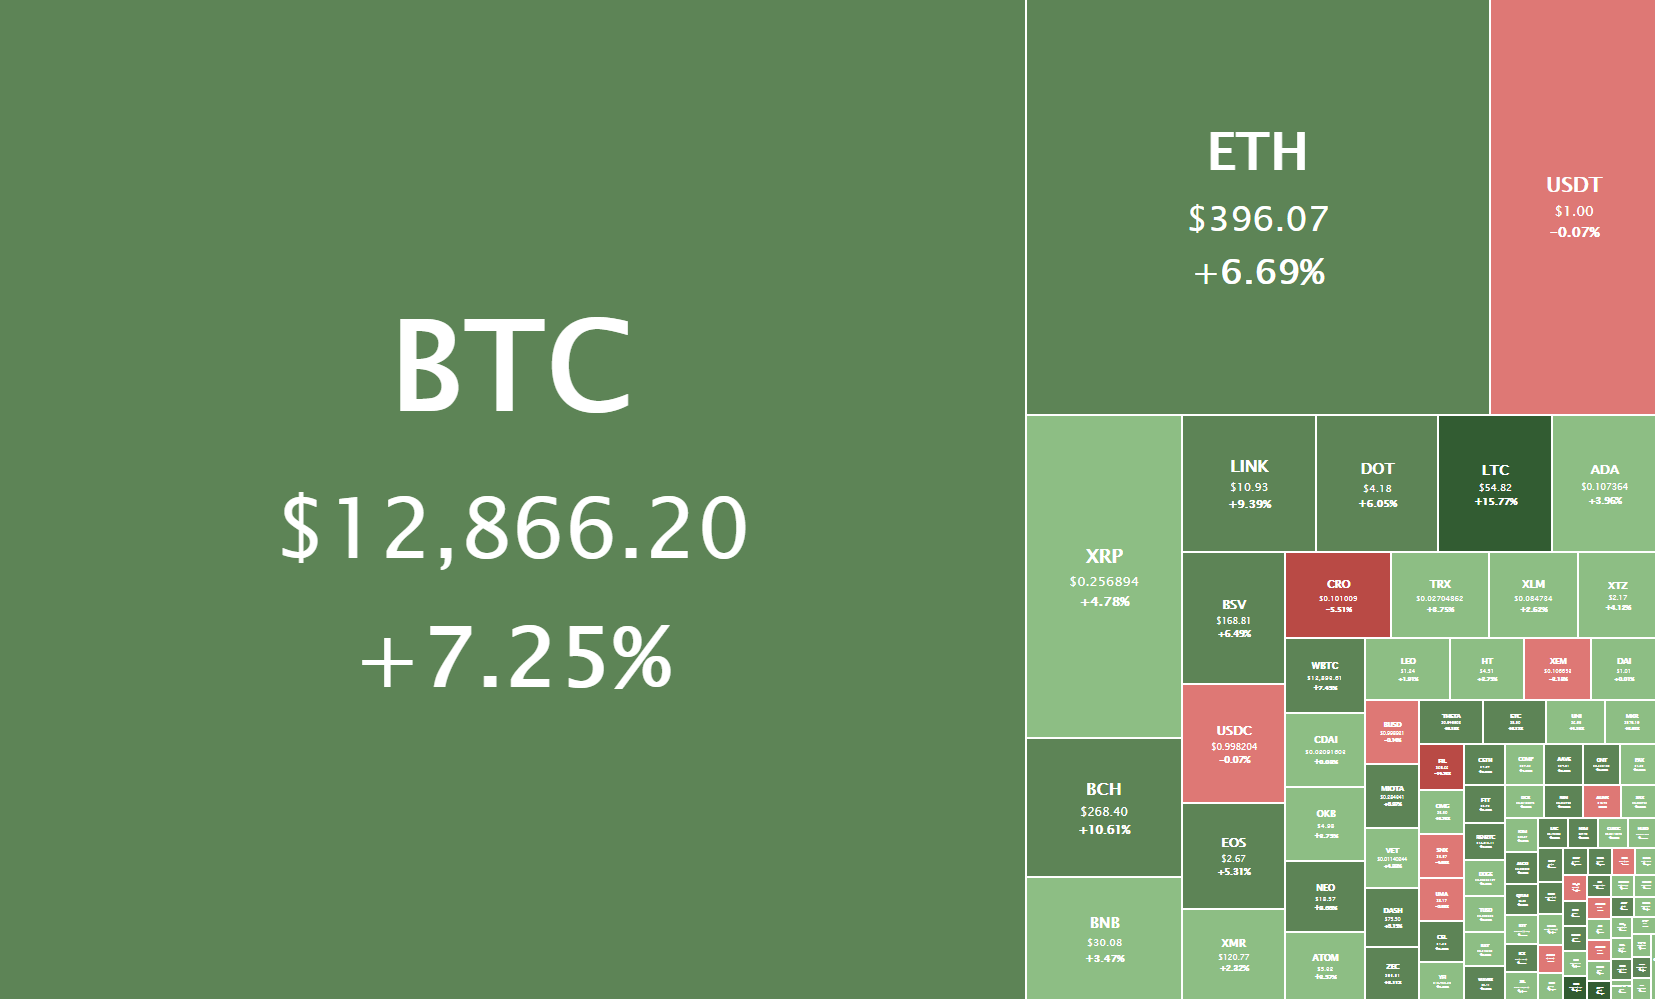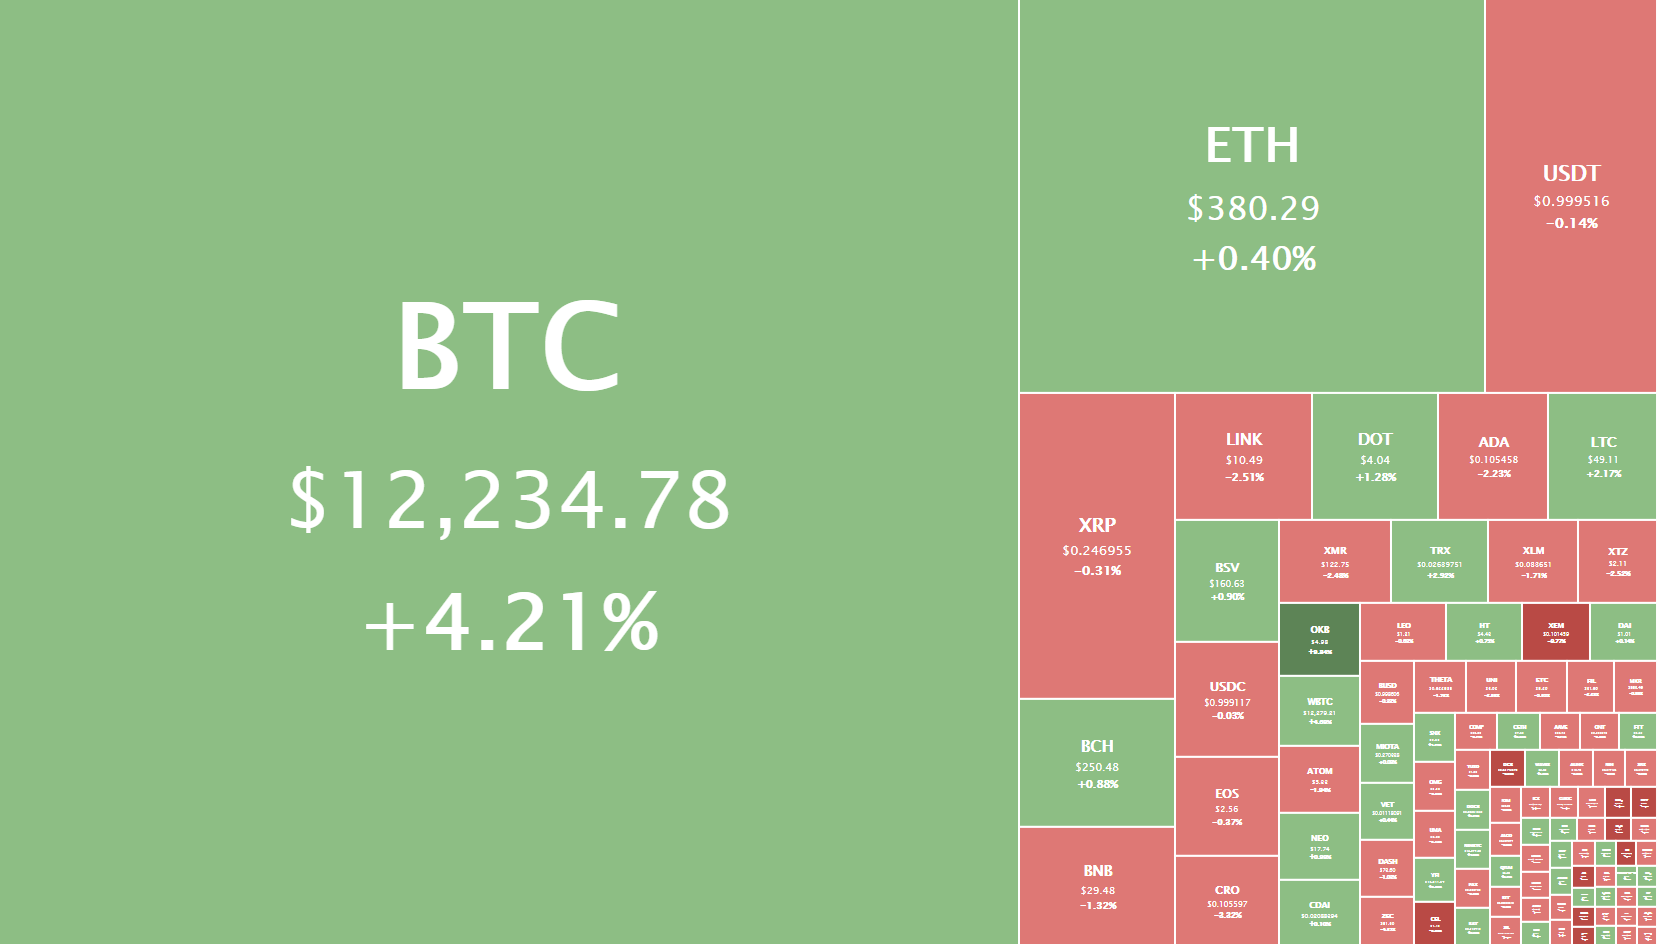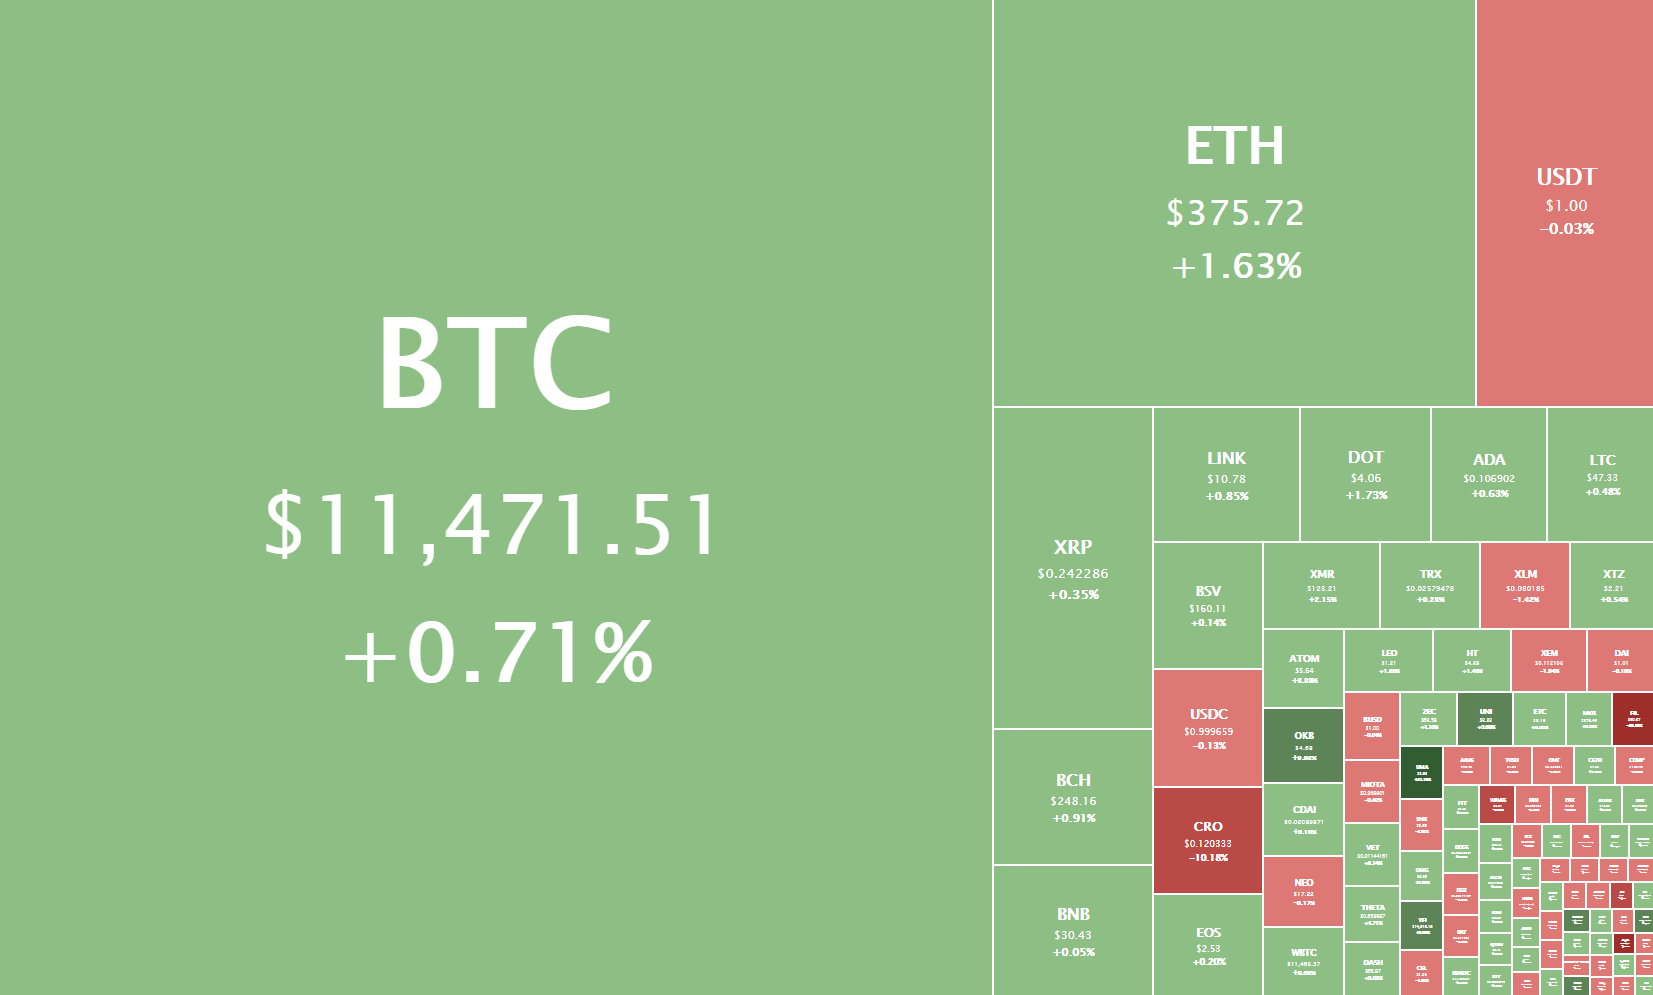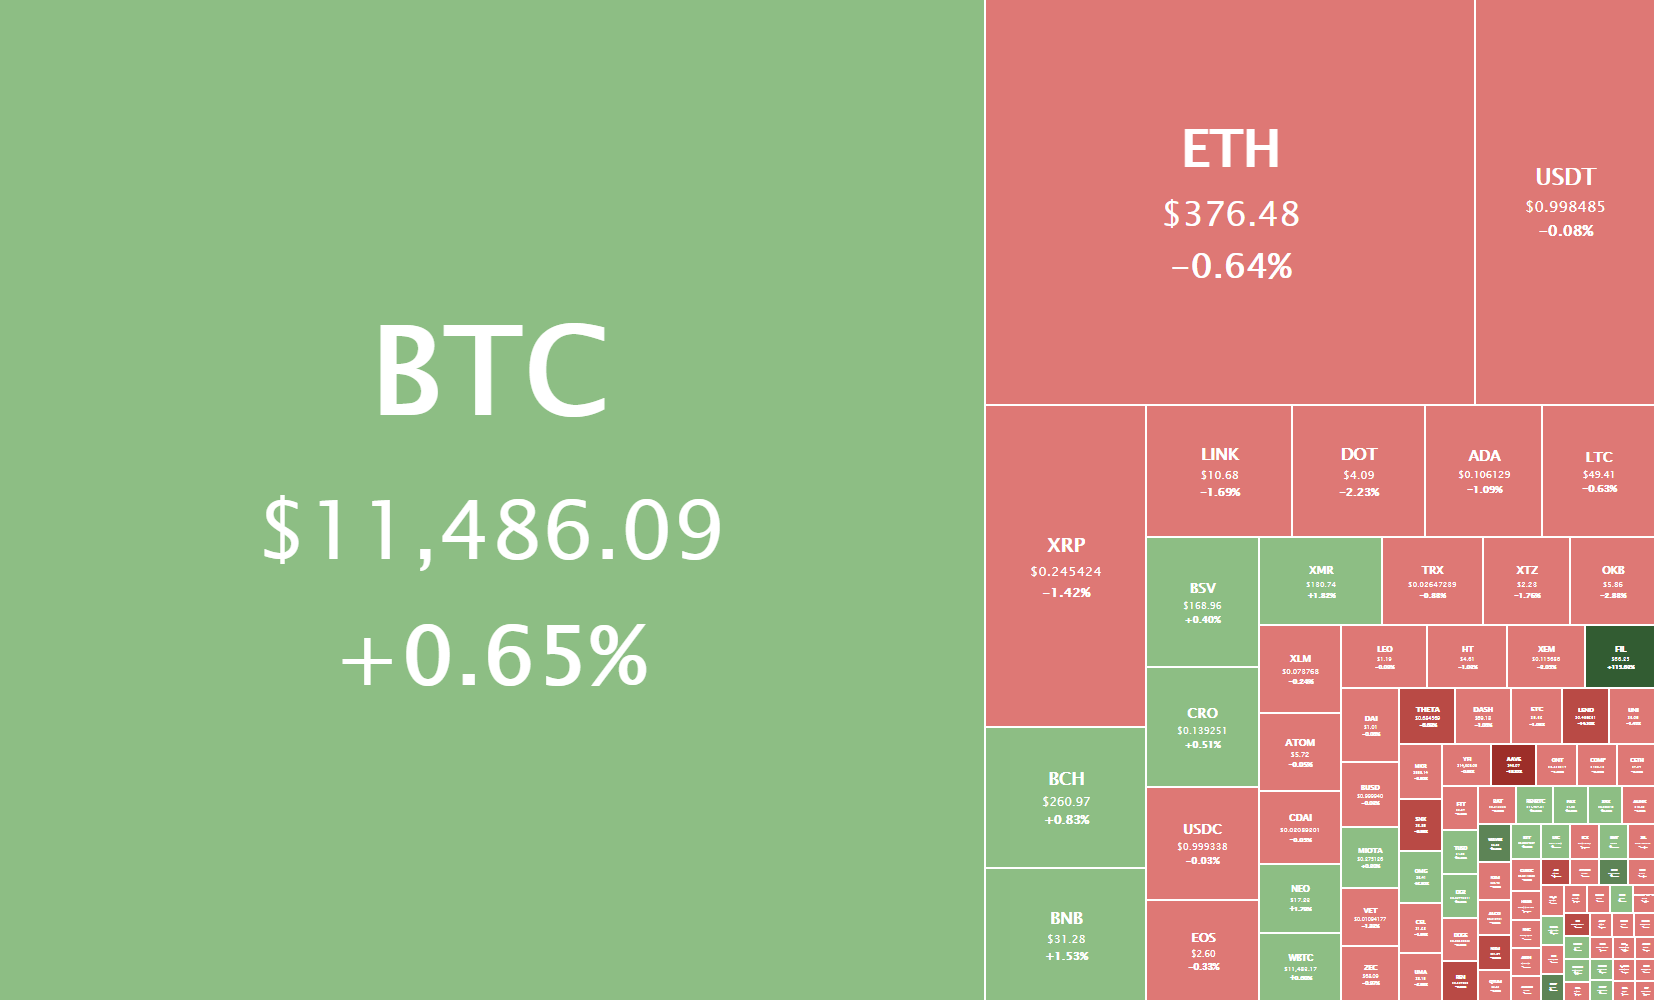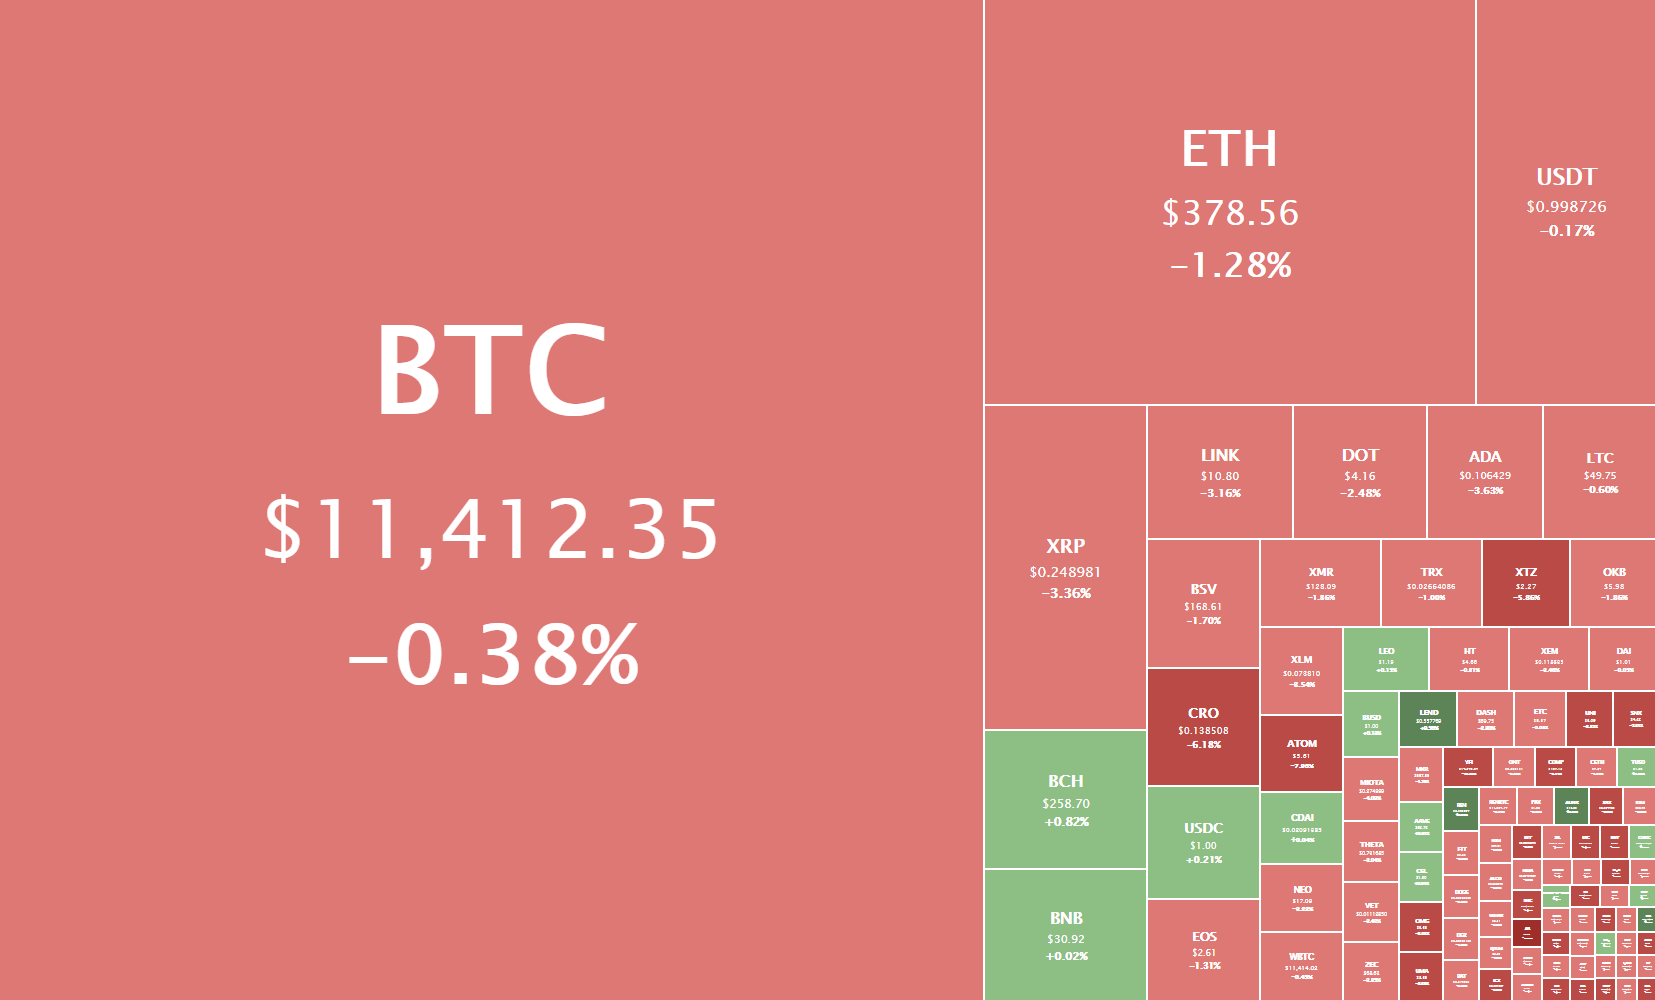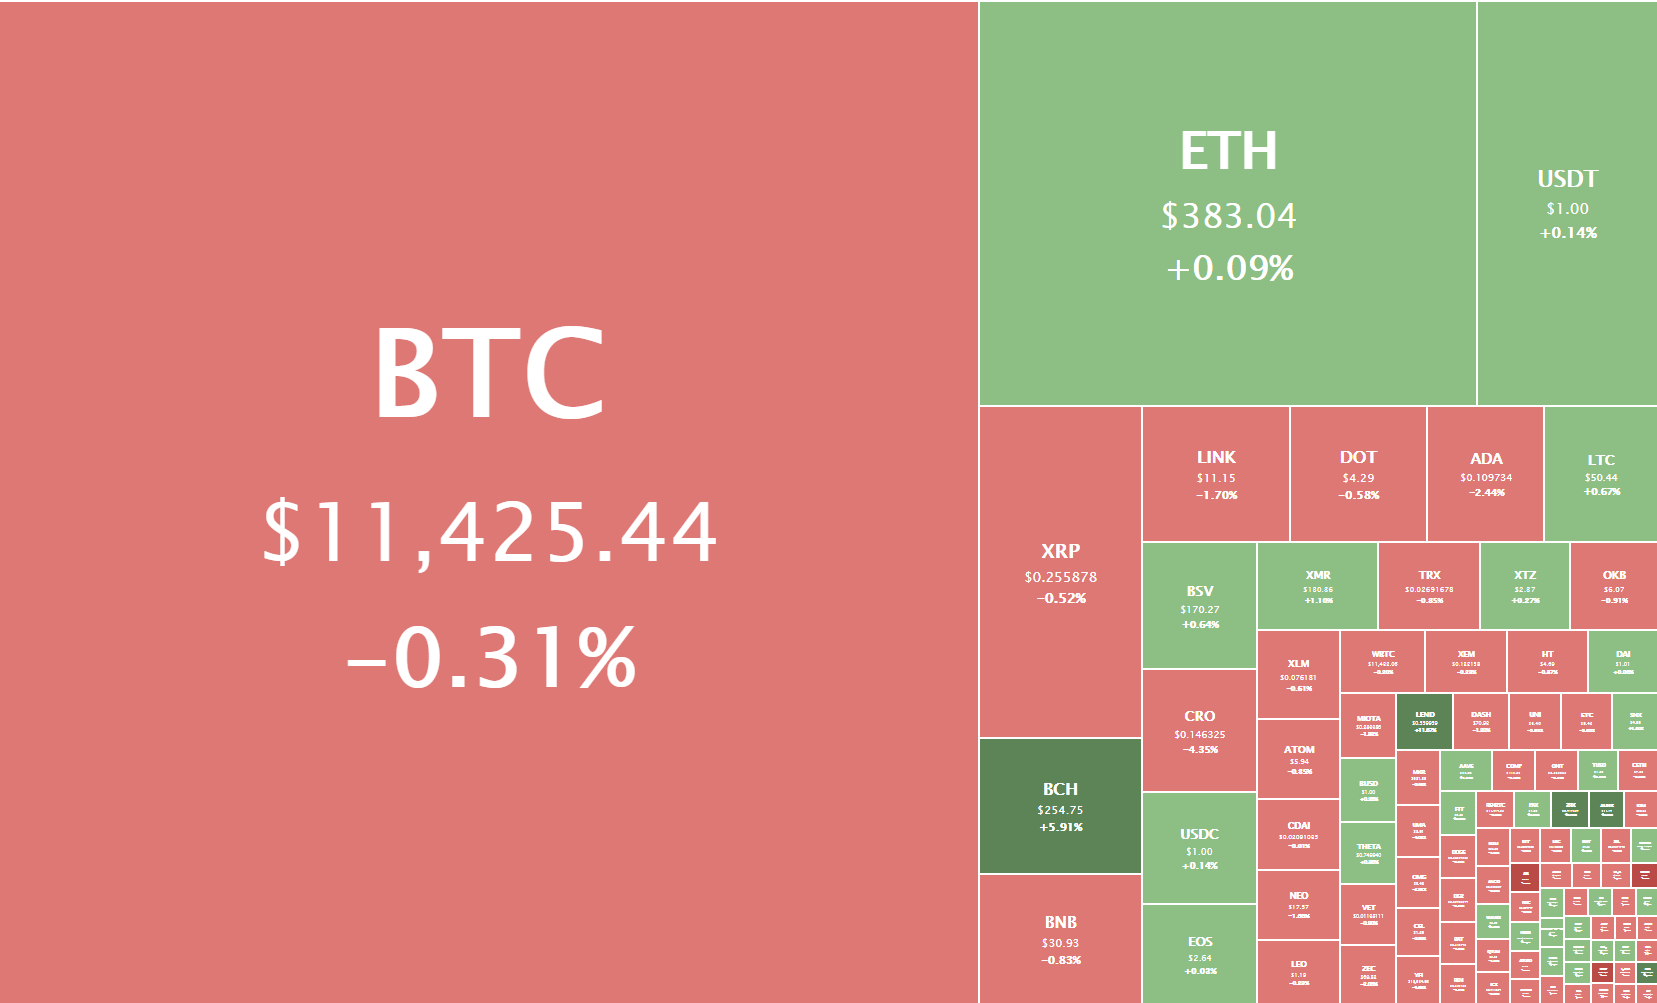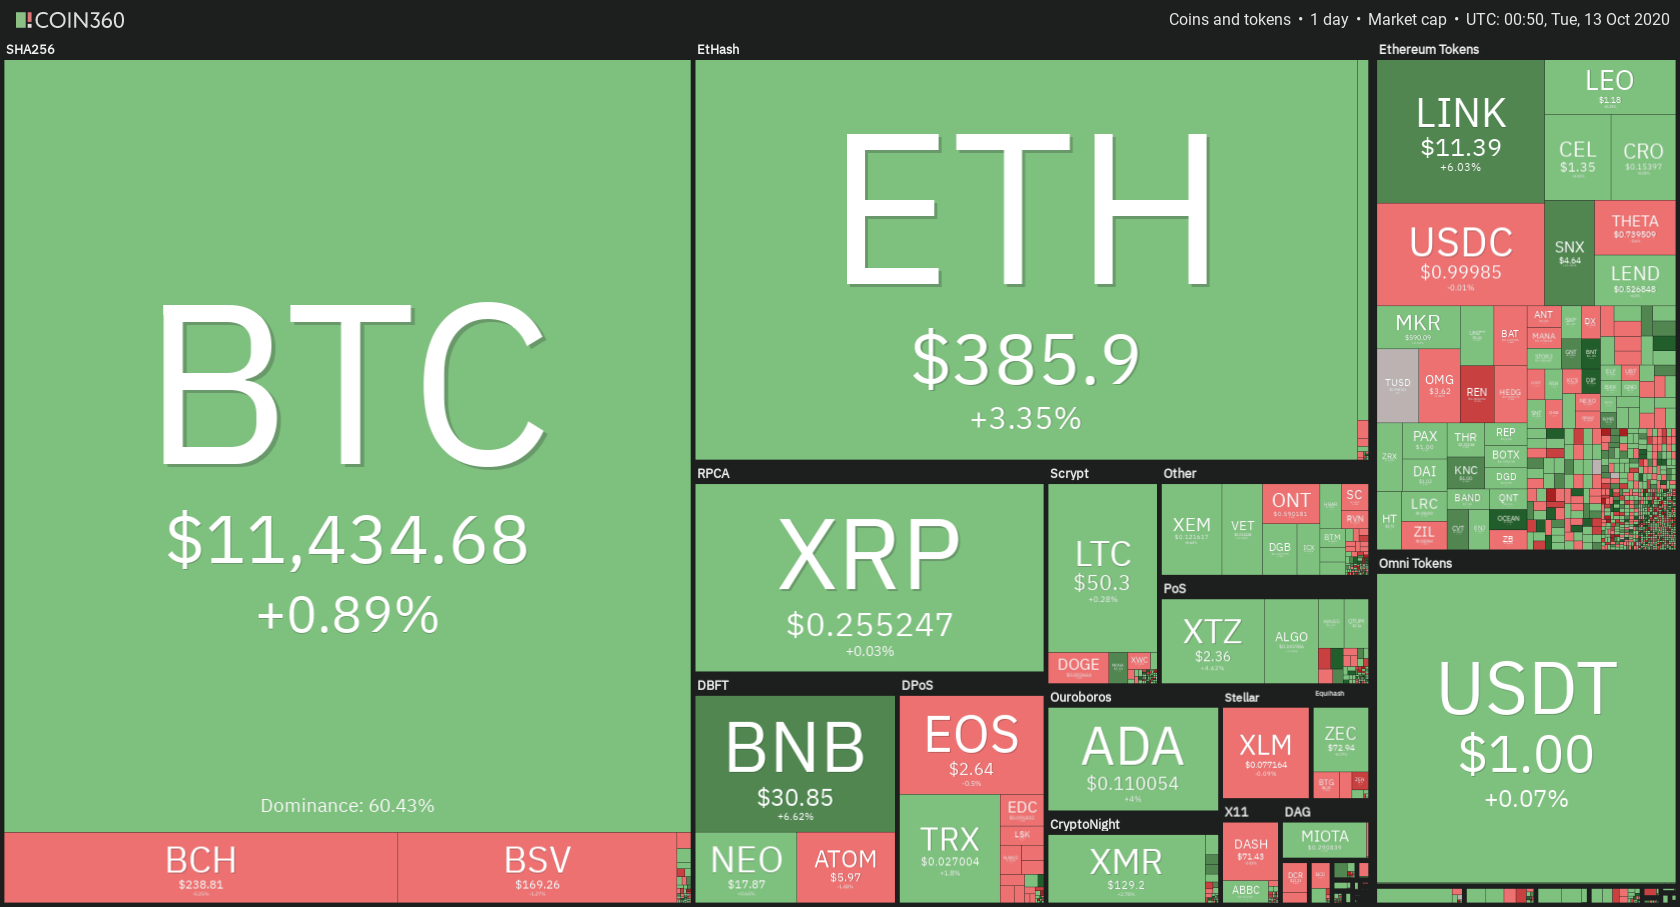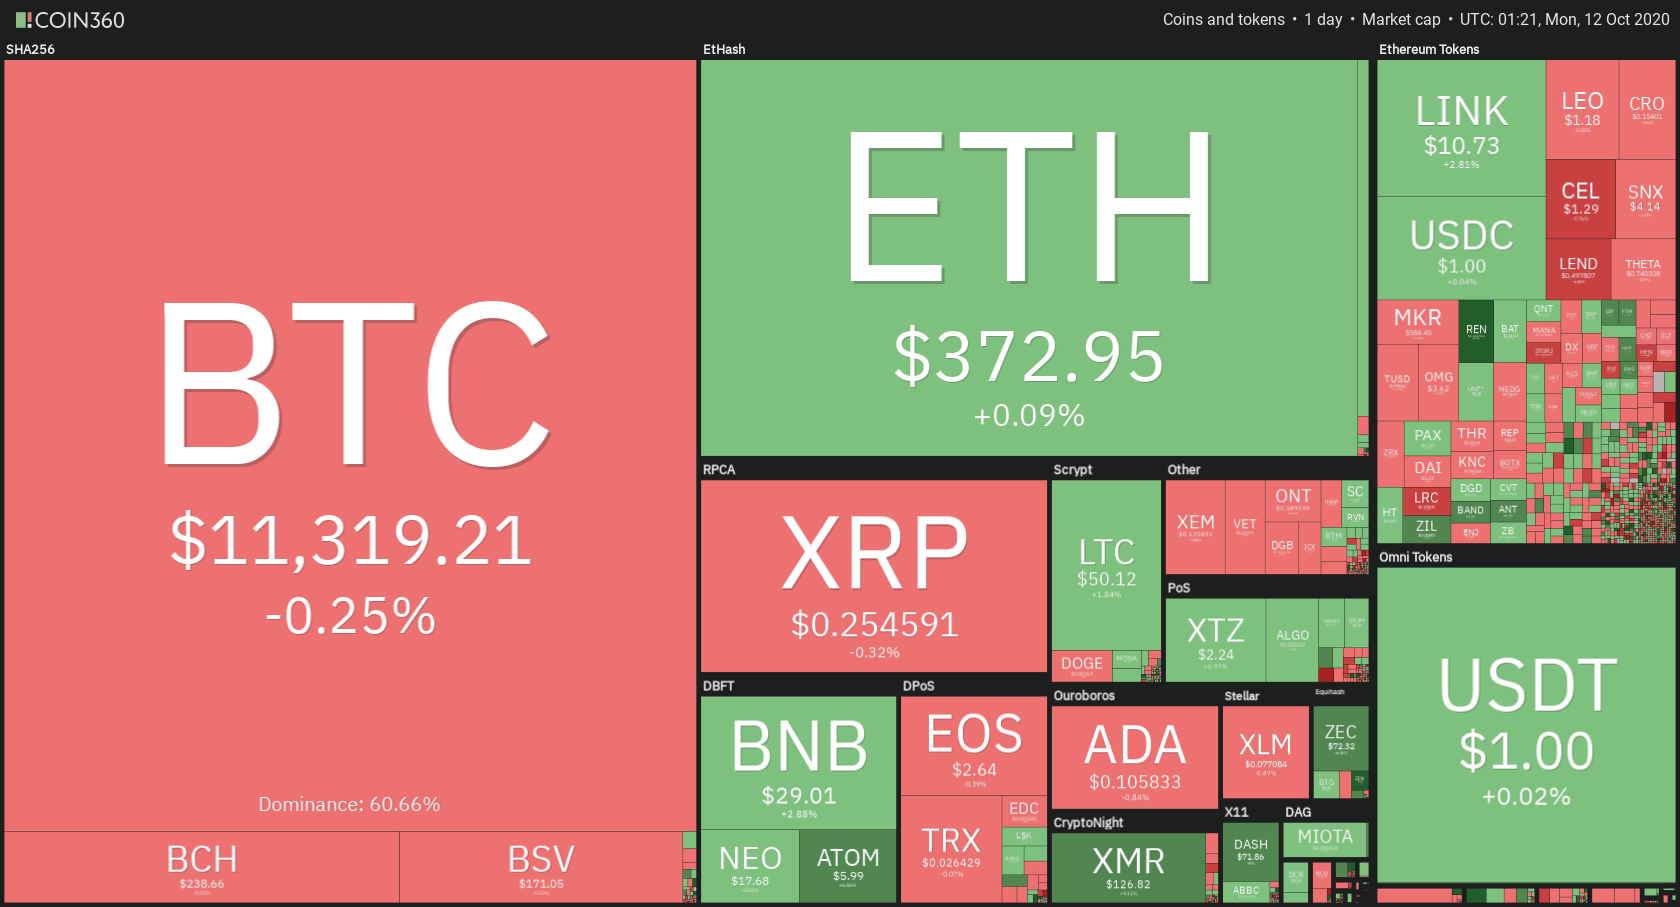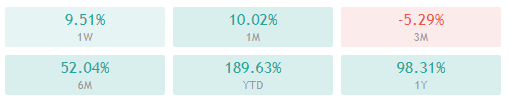
The cryptocurrency sector has spent the day mostly consolidating, with roughly the same amount of cryptocurrencies ending the day in the green and the red. The largest cryptocurrency by market cap is currently trading for $15,802, representing an increase of 2.68% on the day. Meanwhile, Ethereum gained 0.24% on the day, while XRP gained 0.60%.
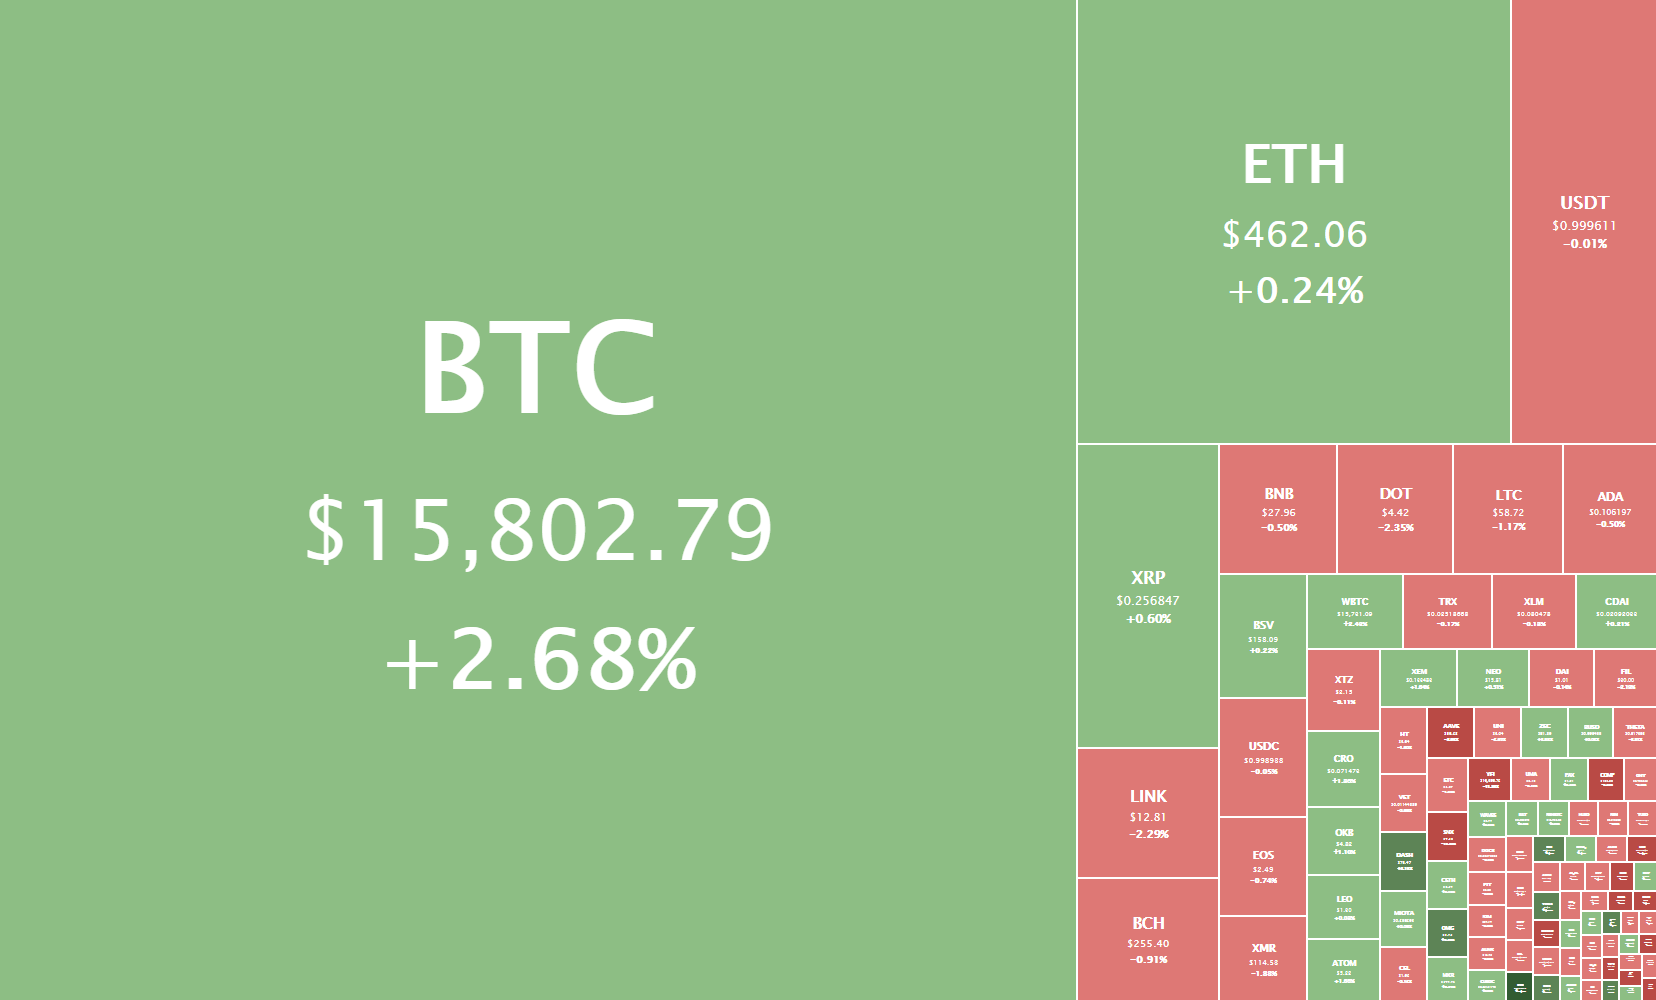
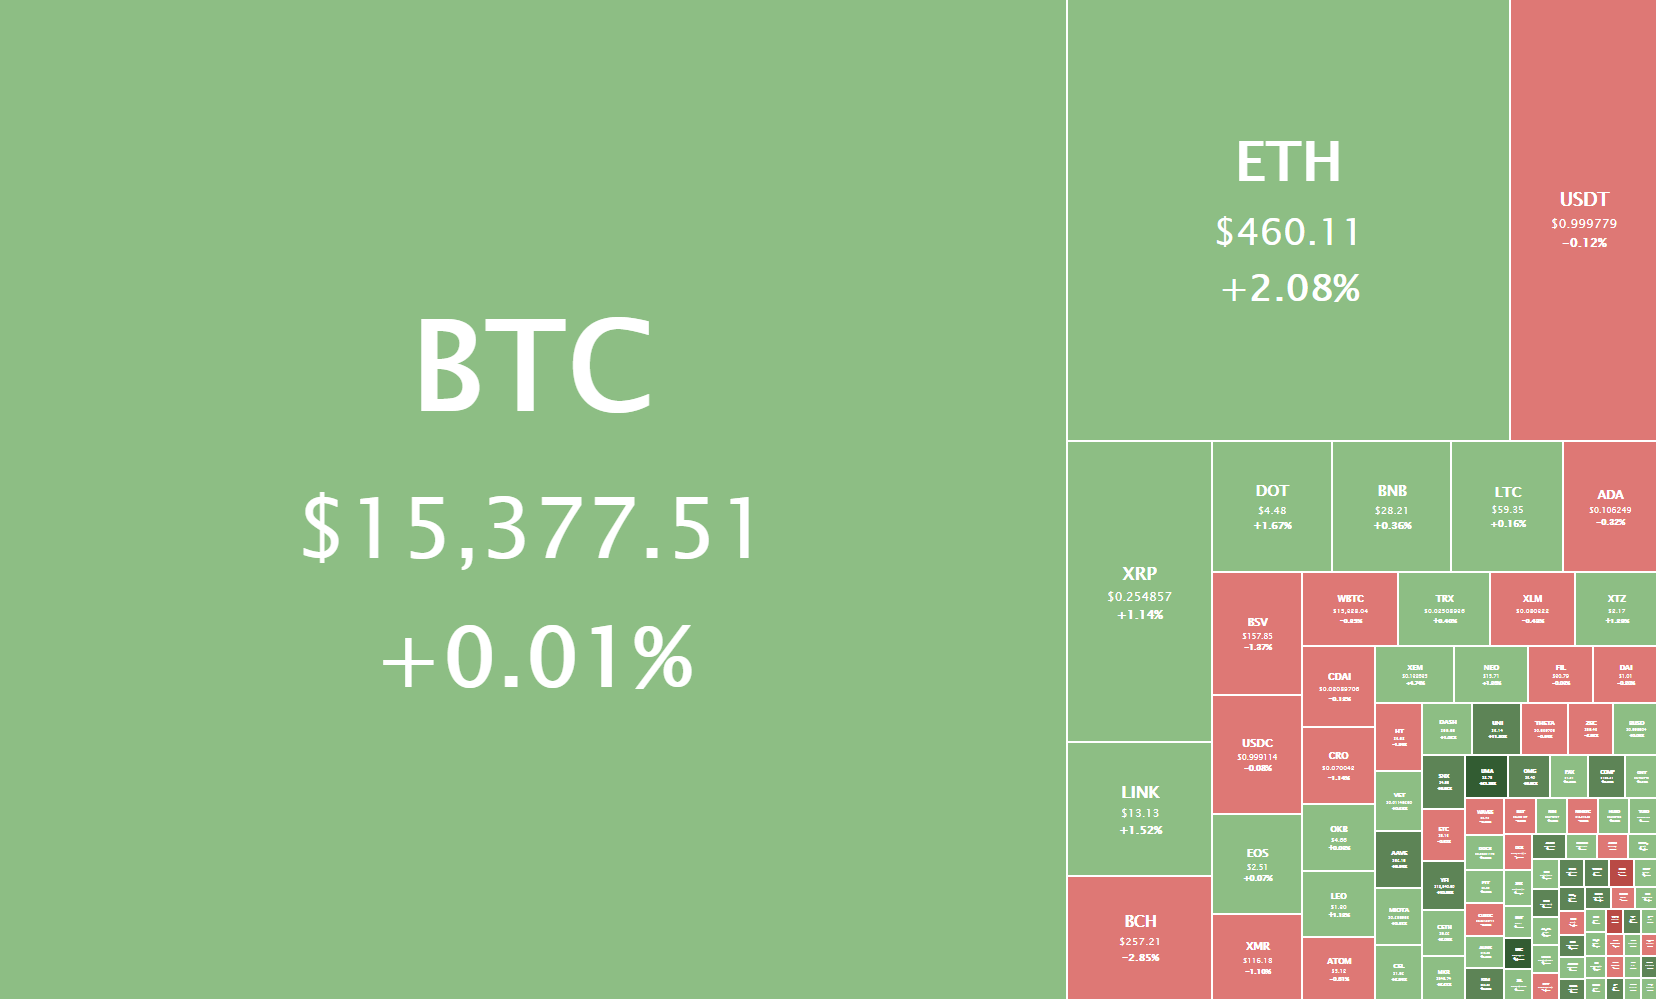
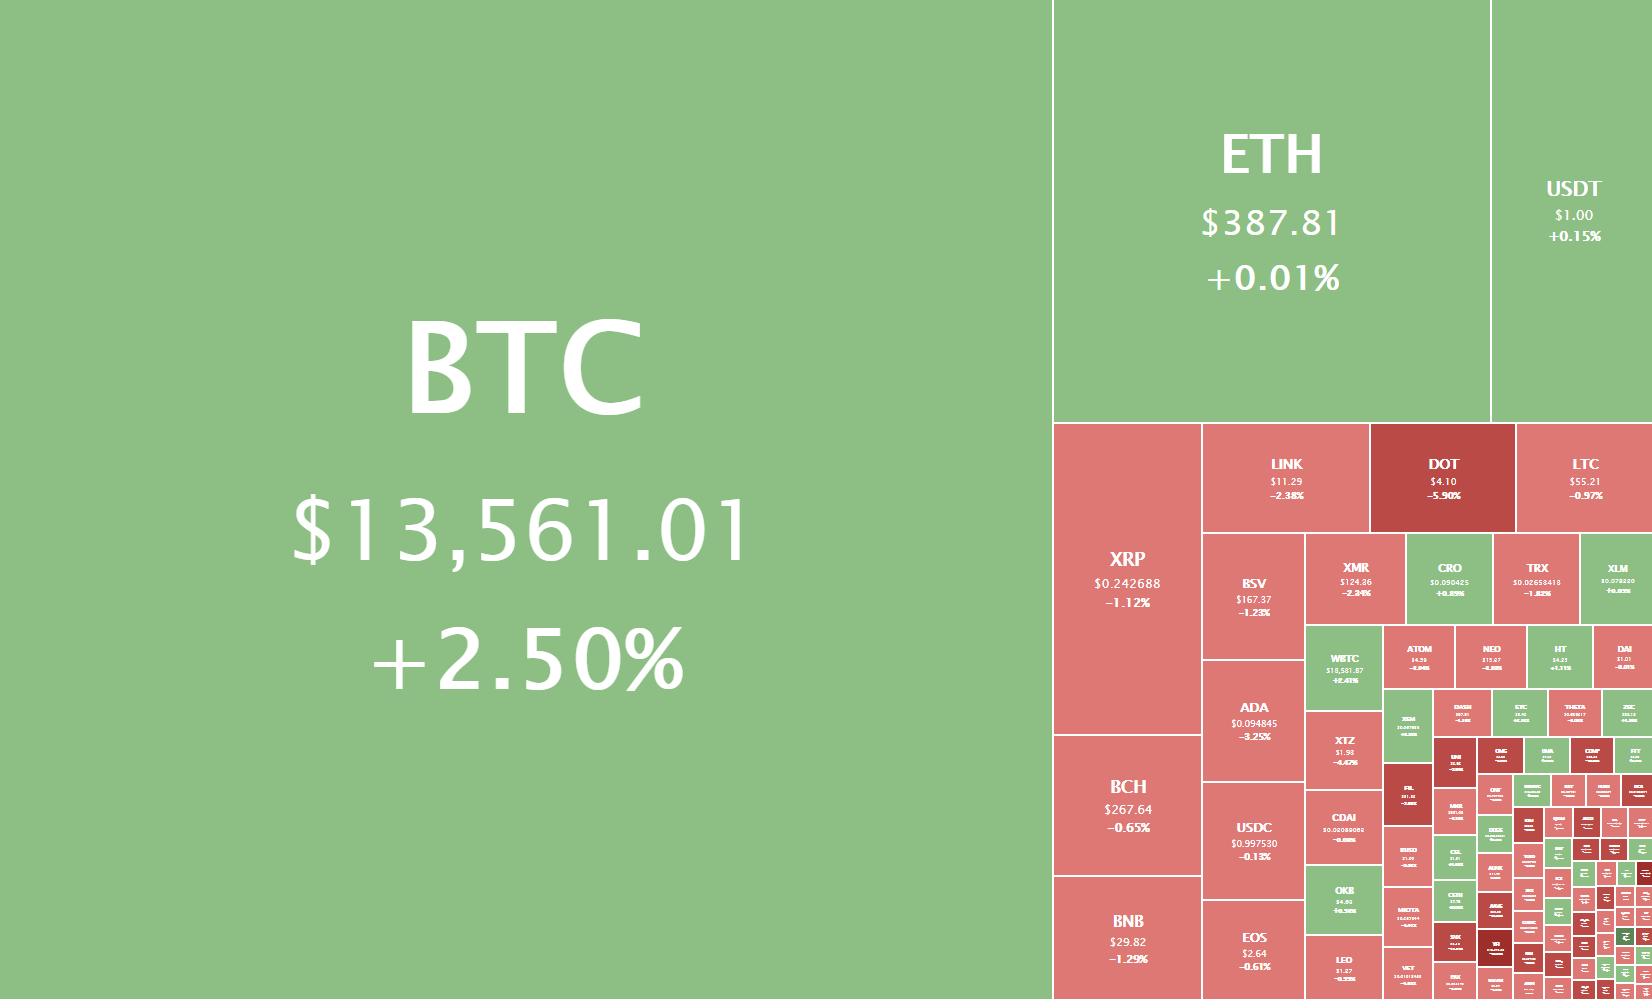
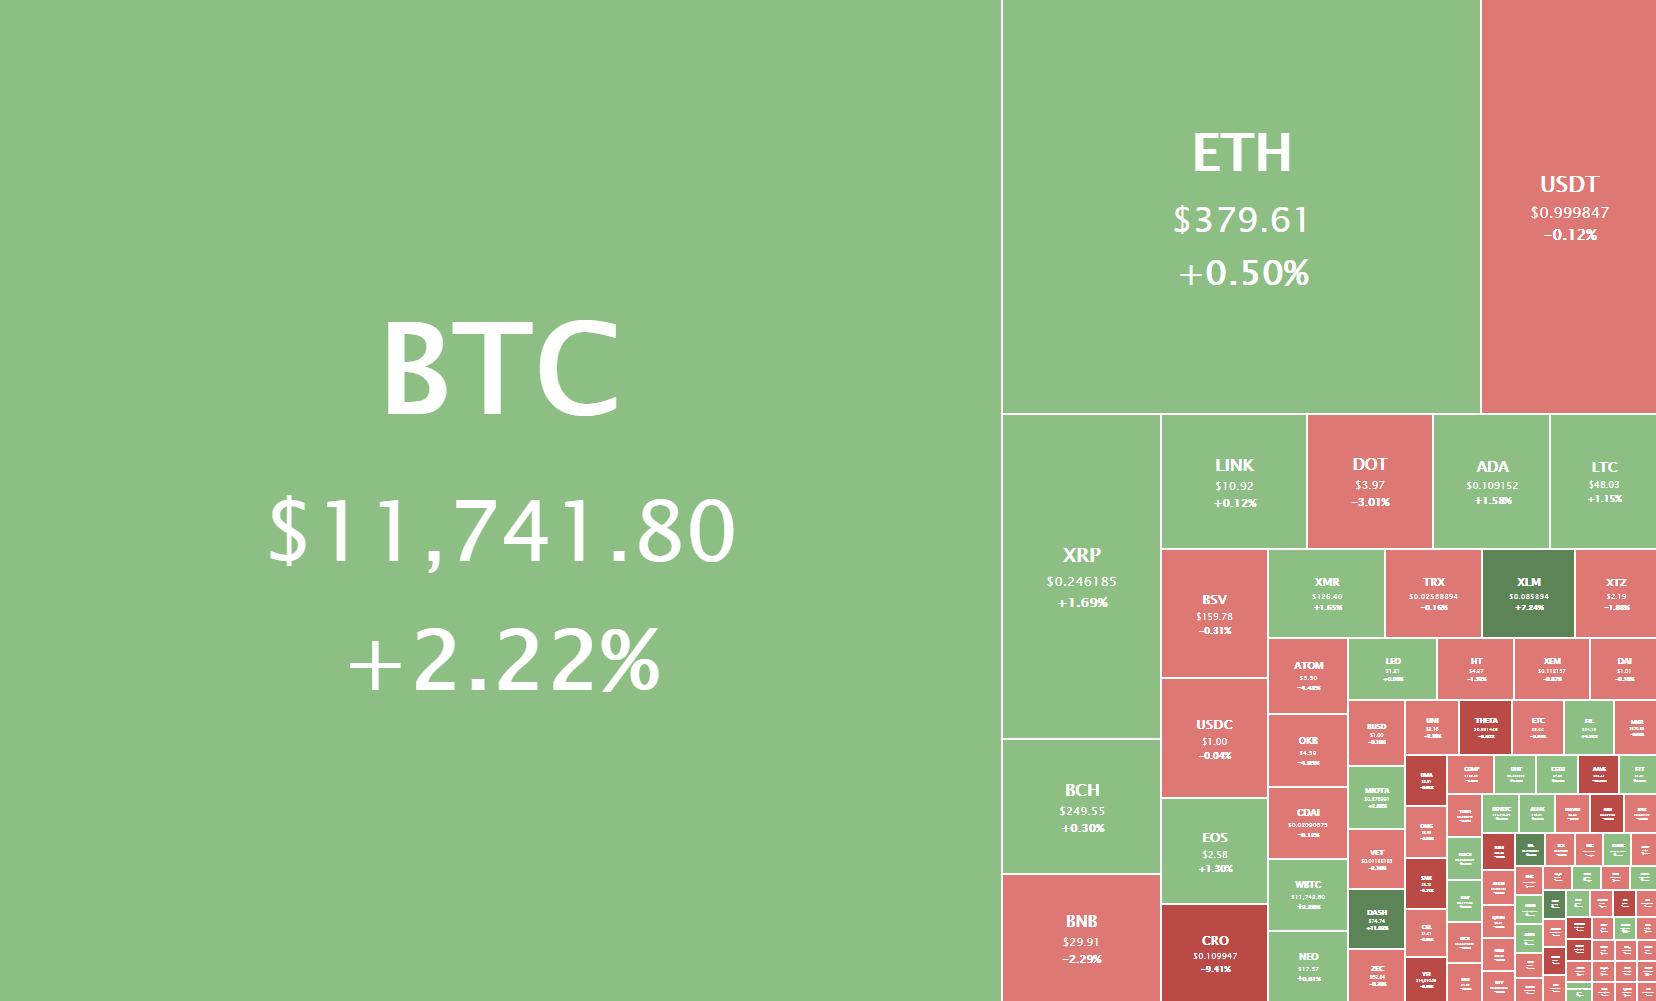
Daily Crypto Sector Heat Map
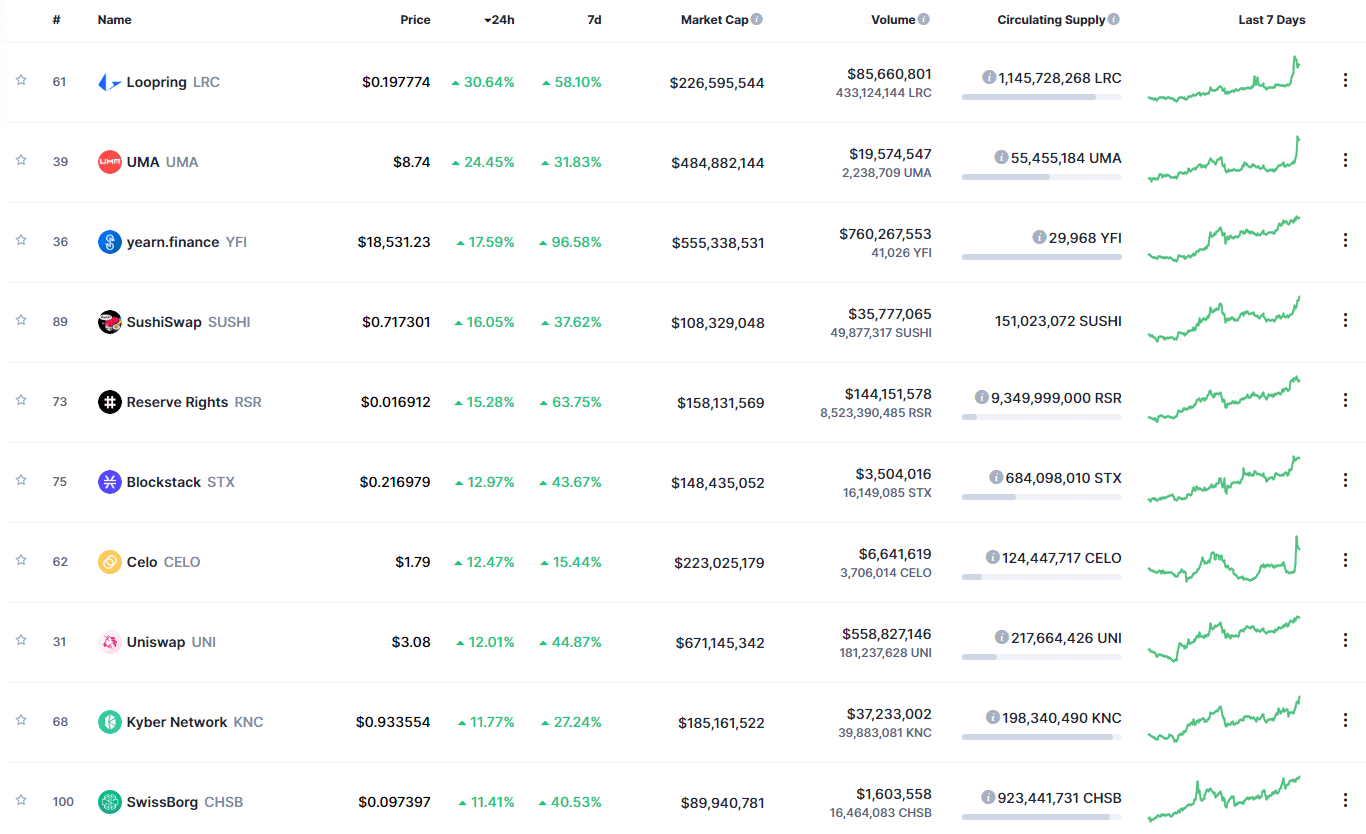
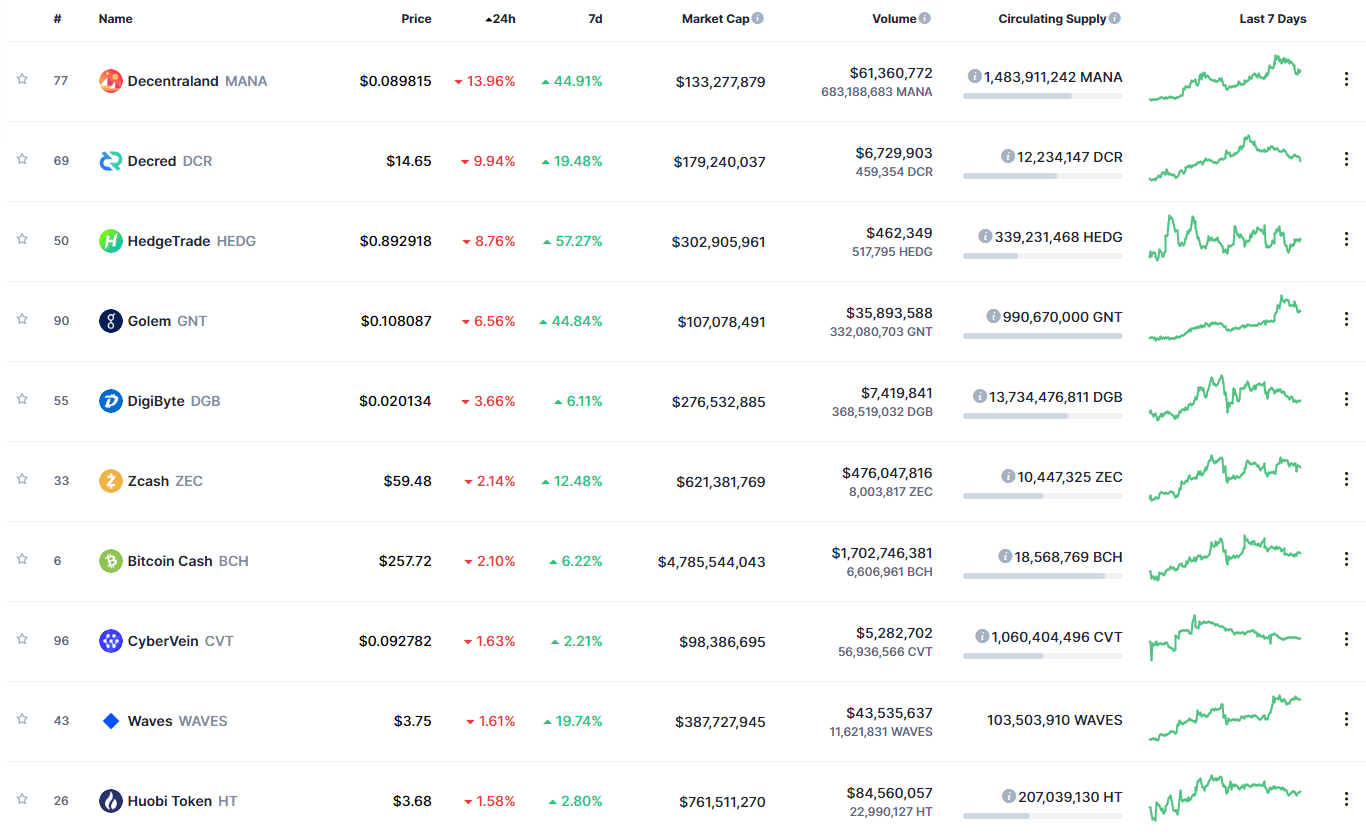
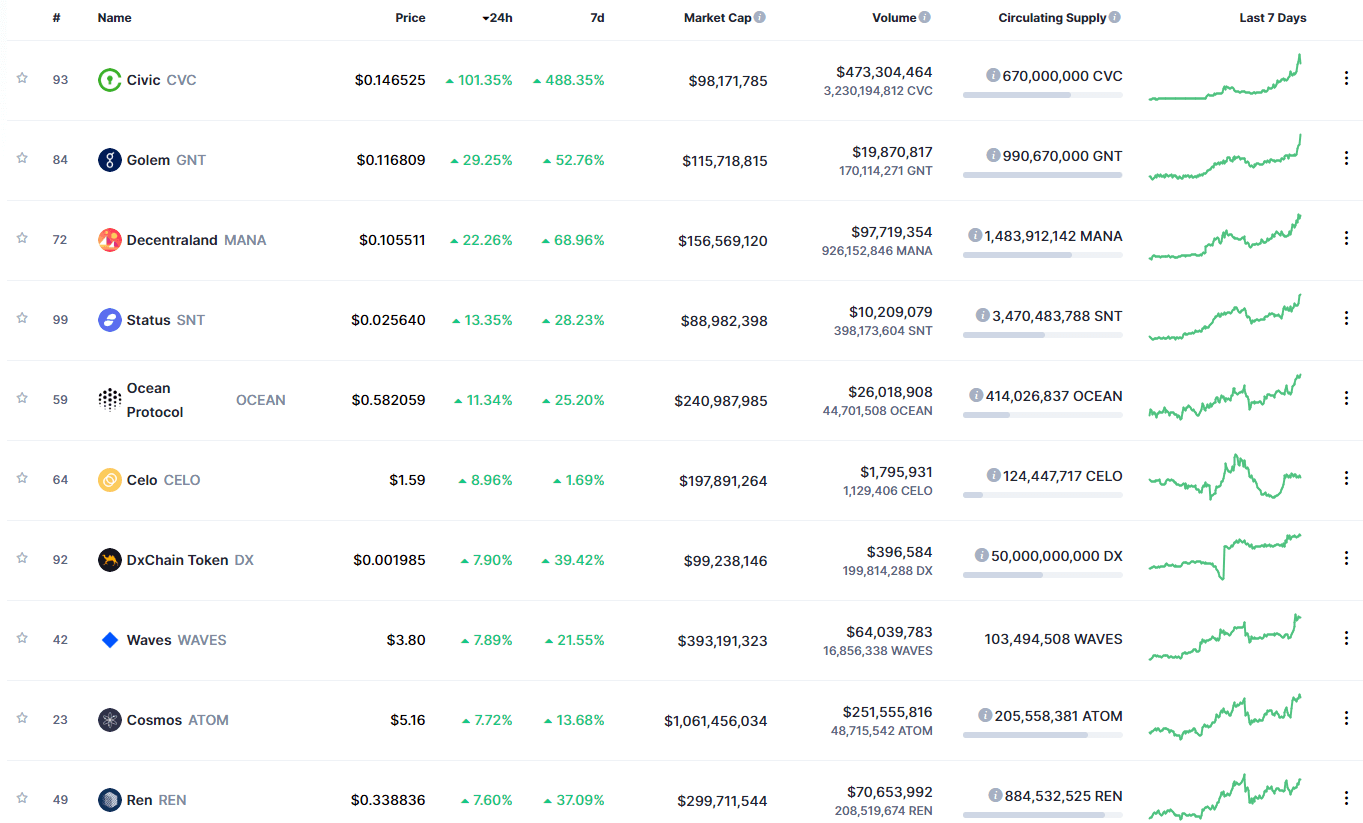
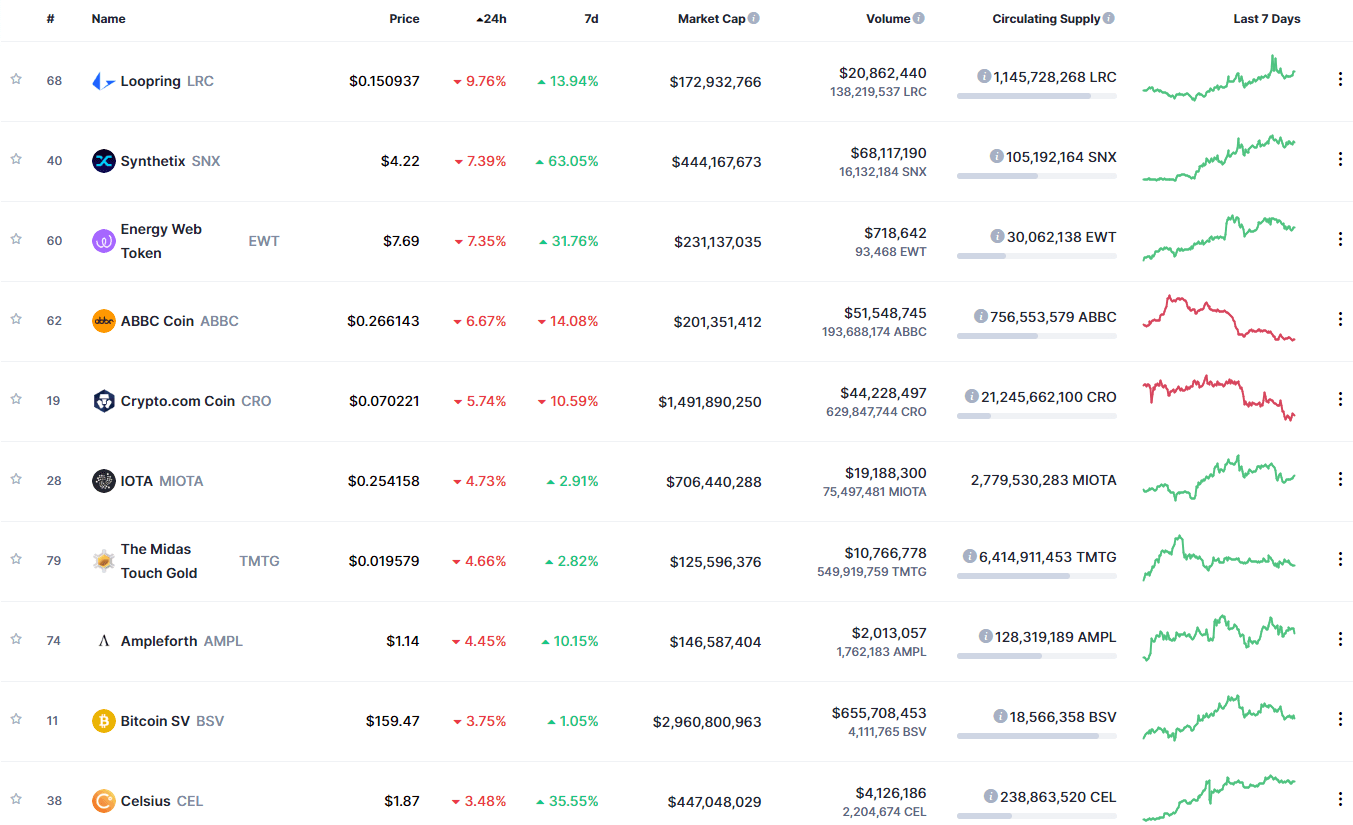
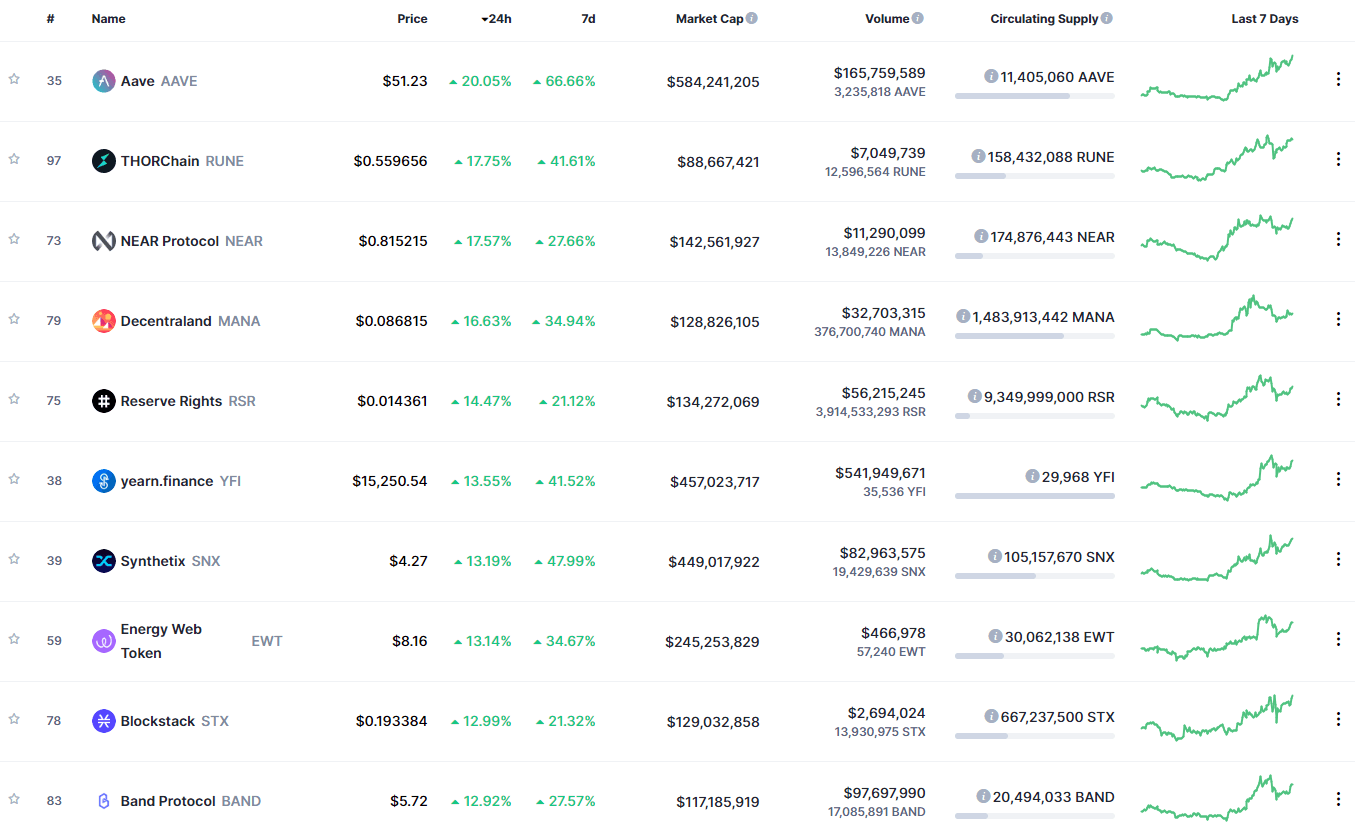
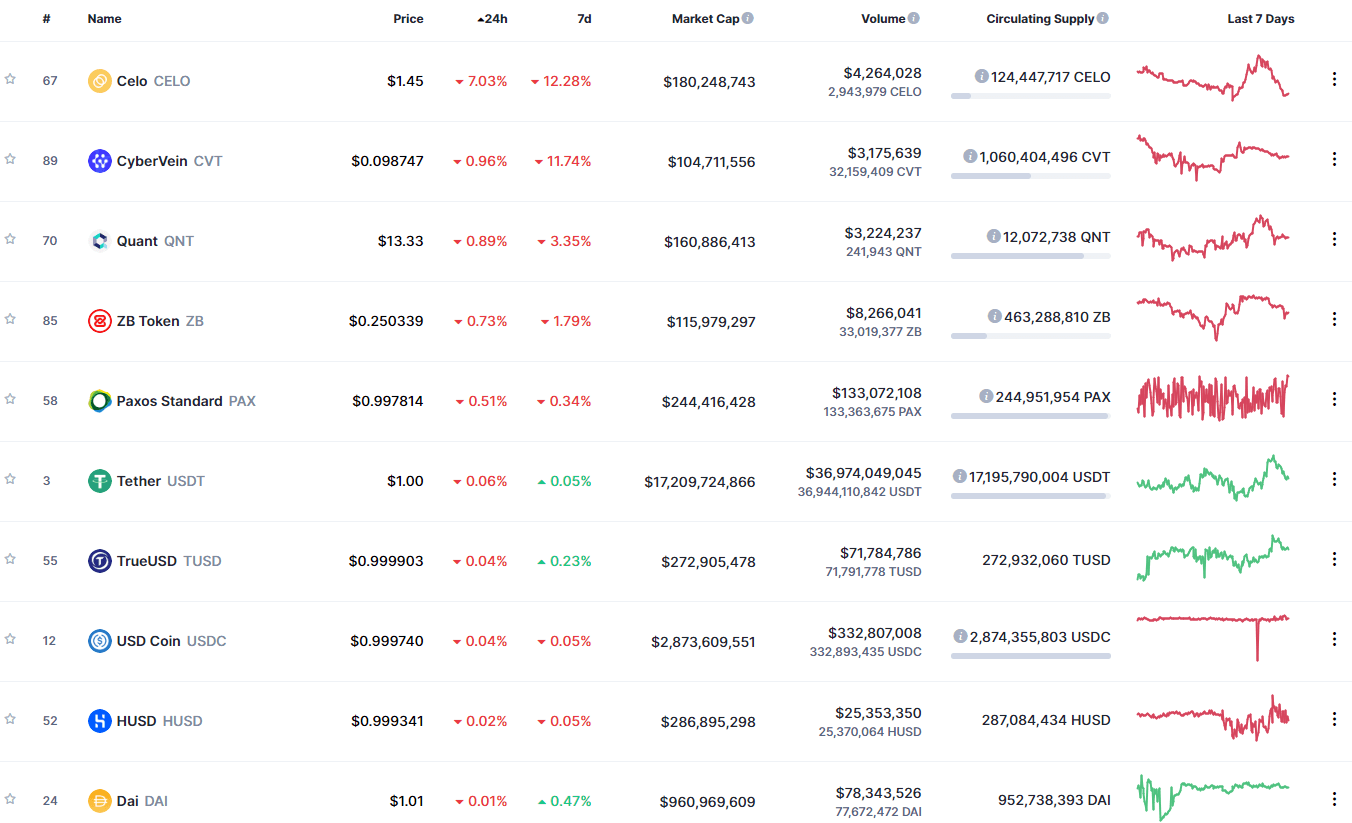
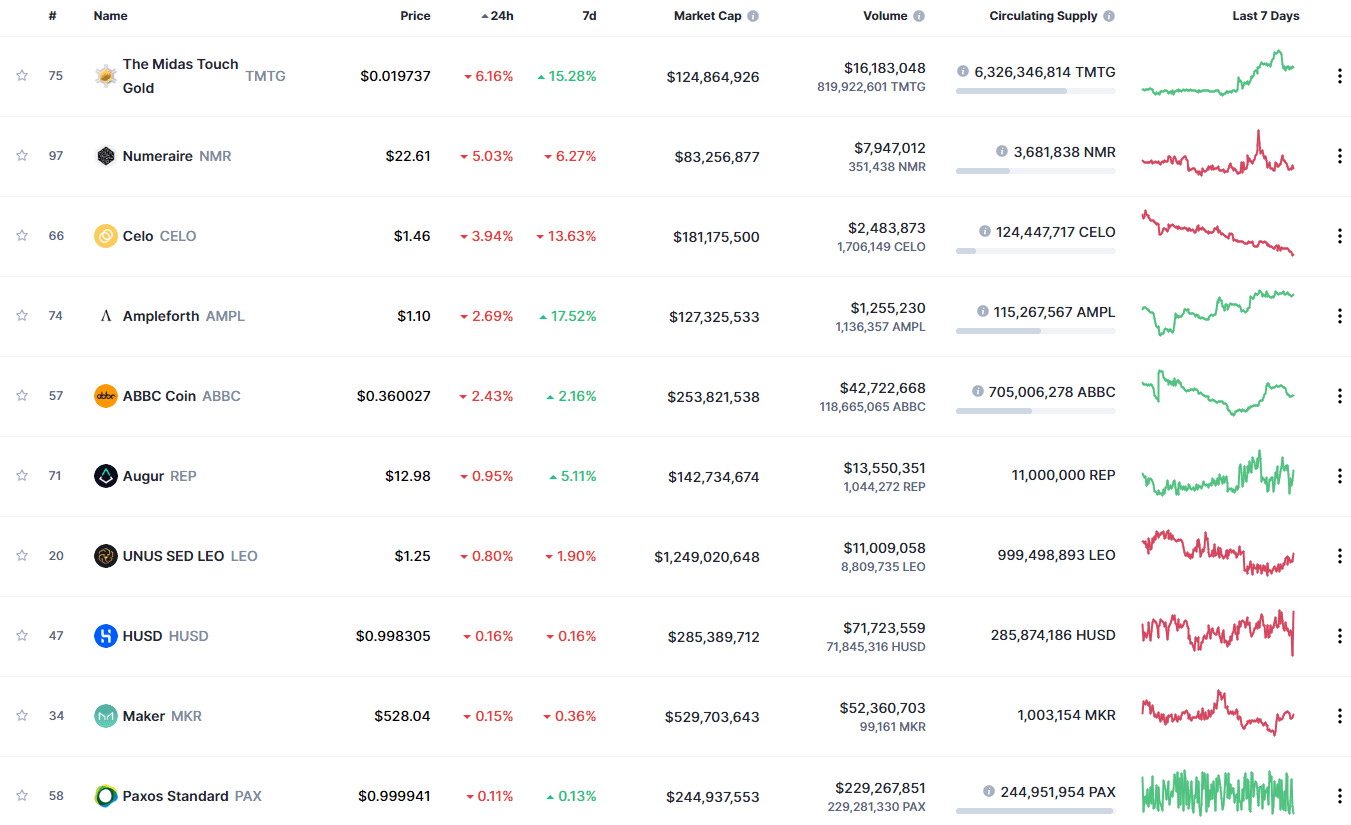
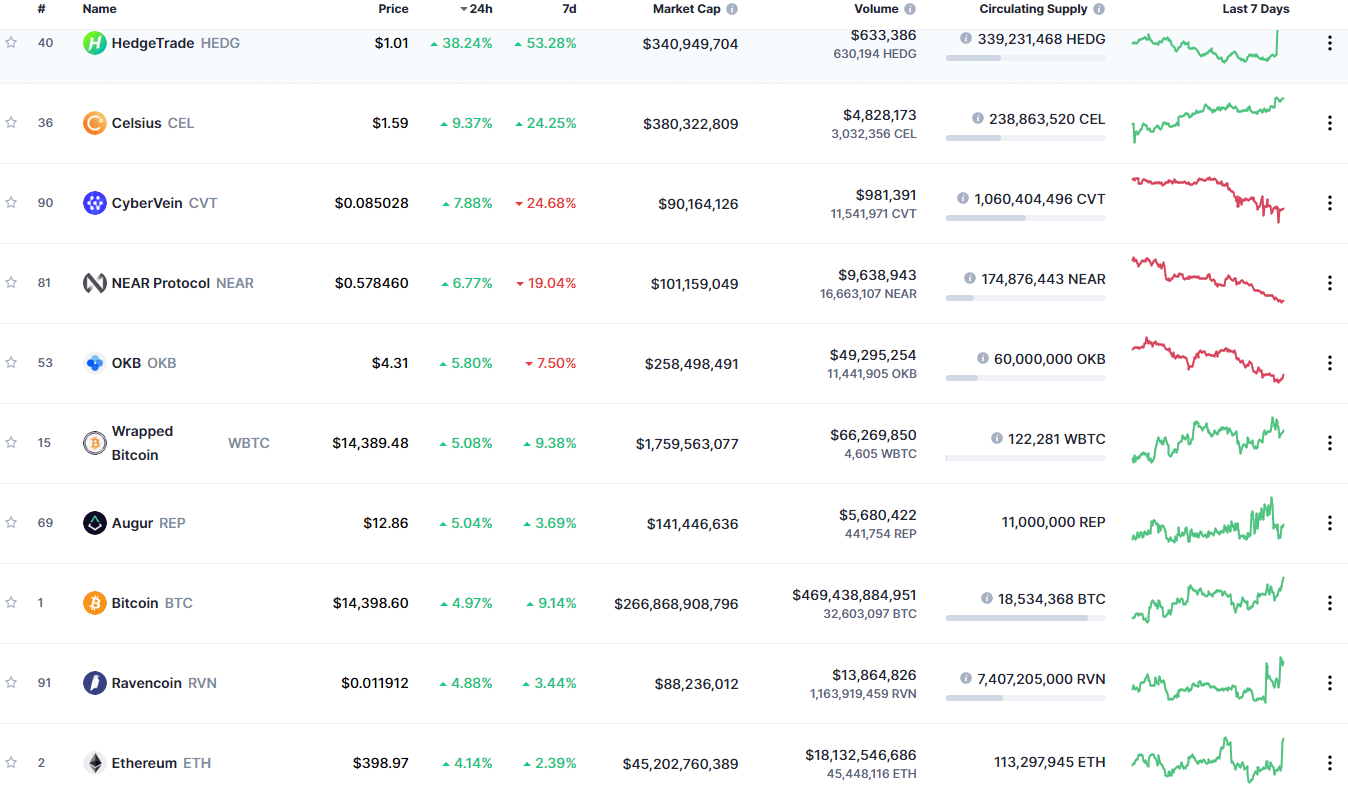
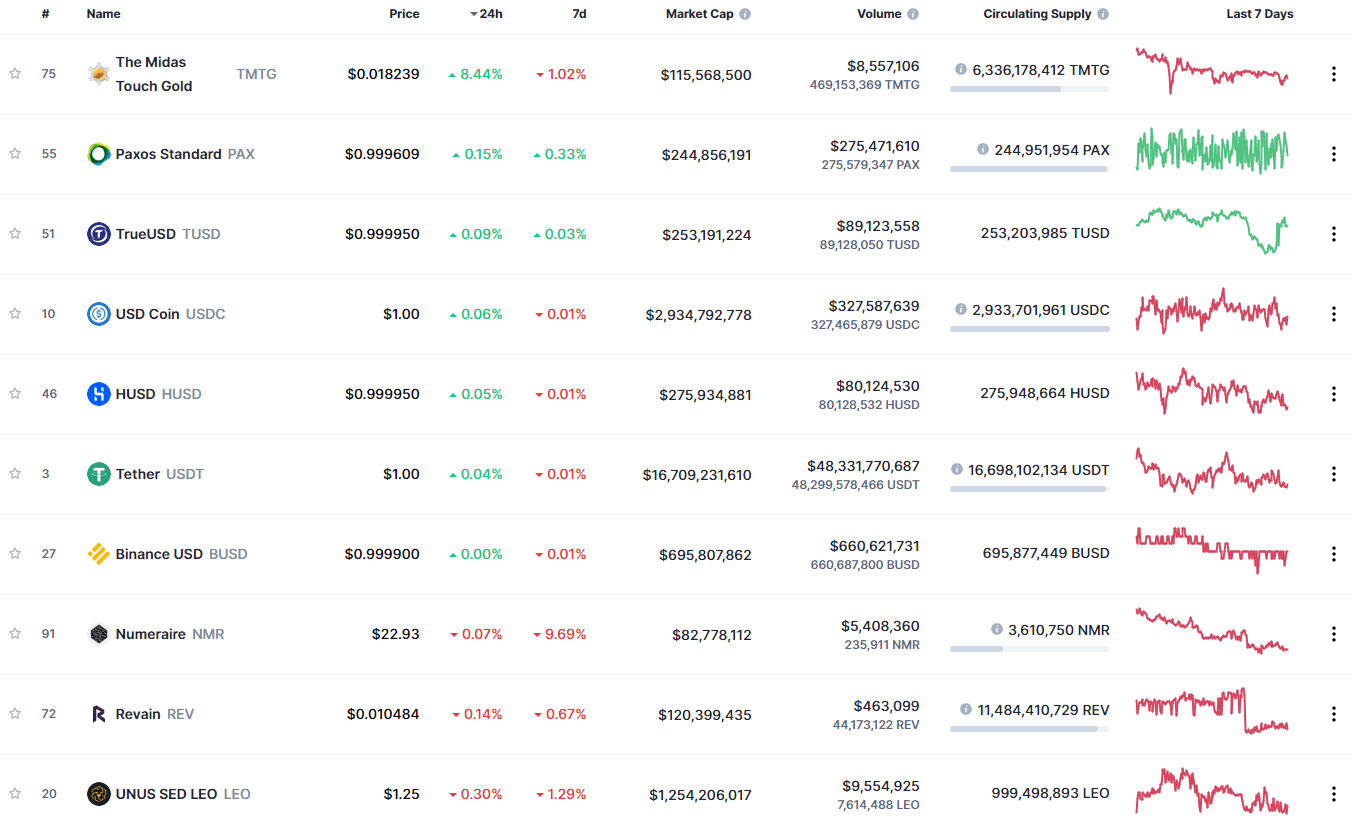
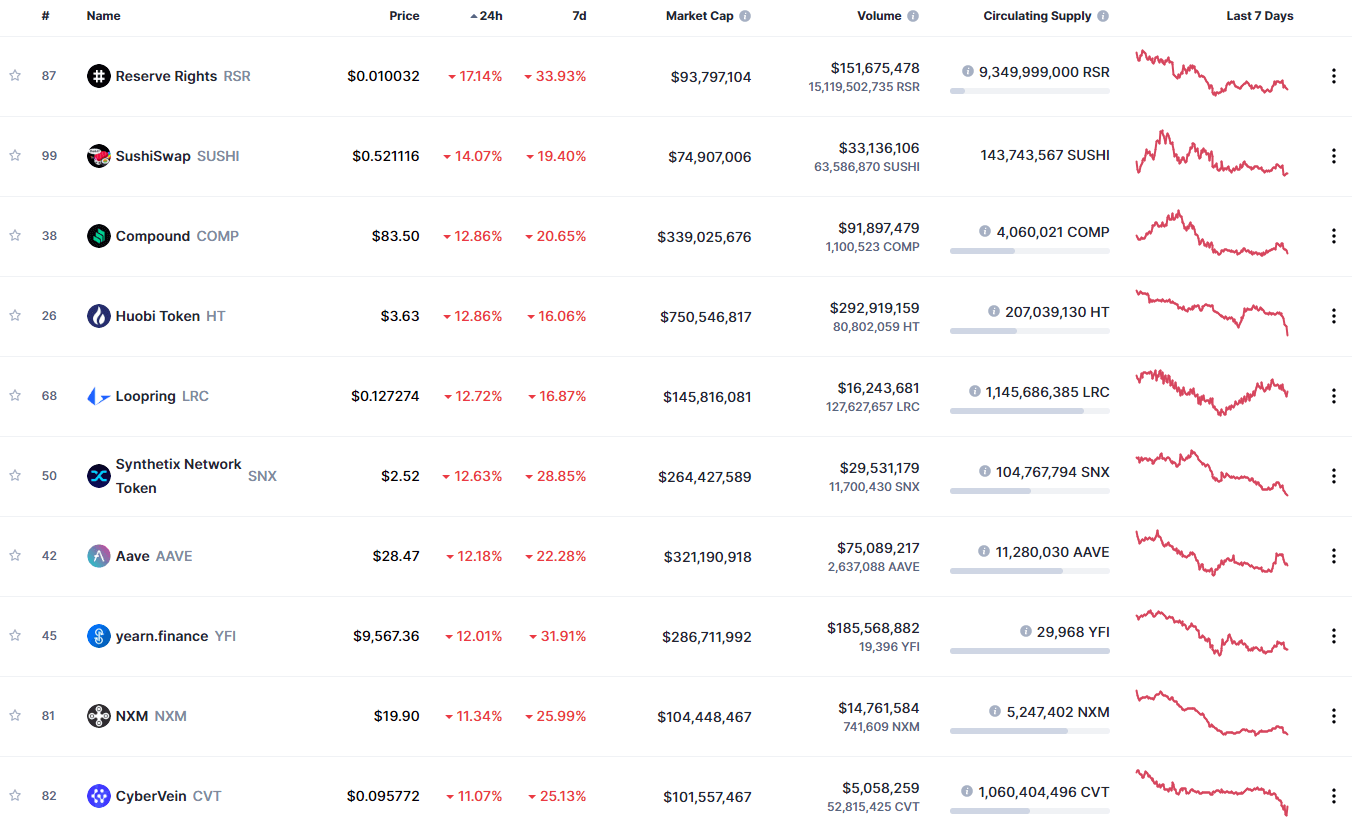
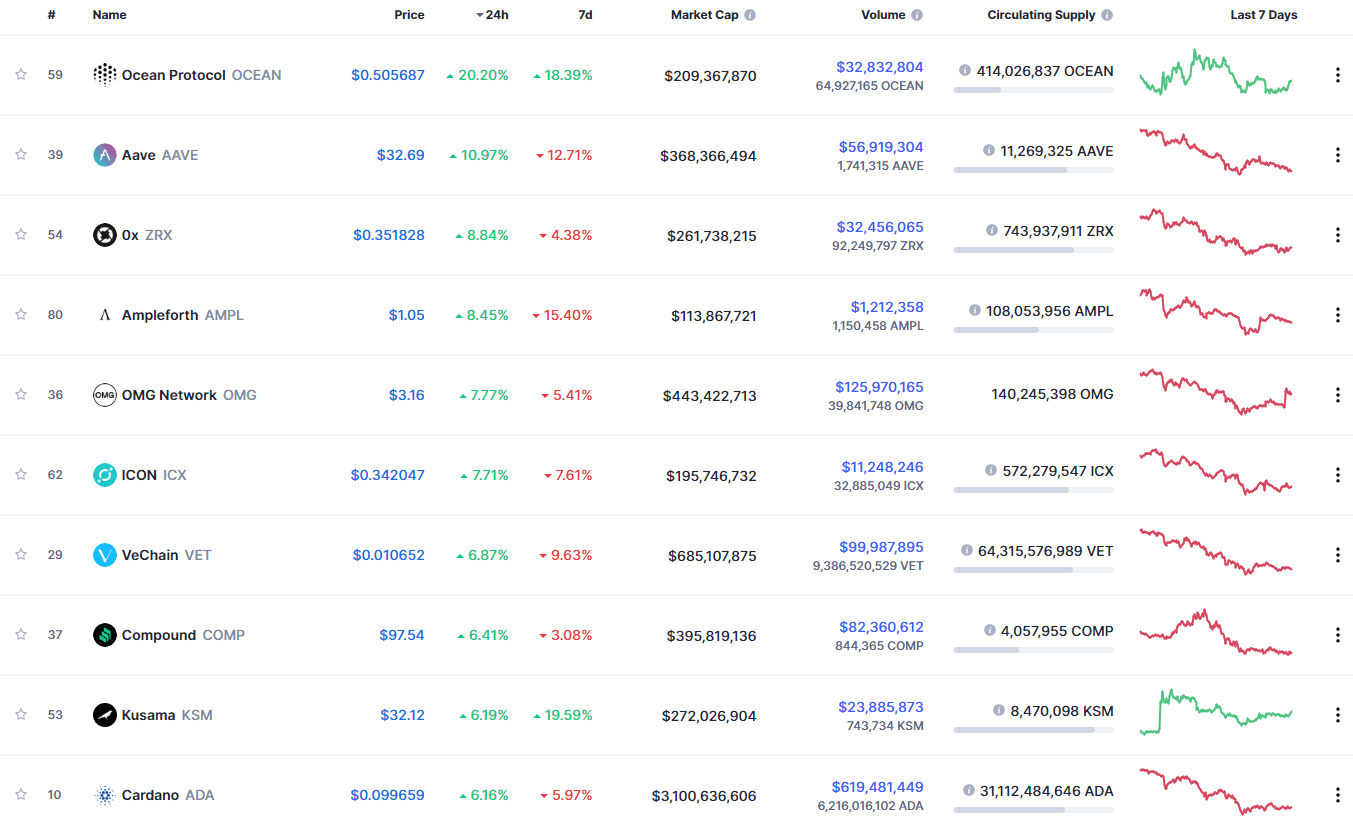
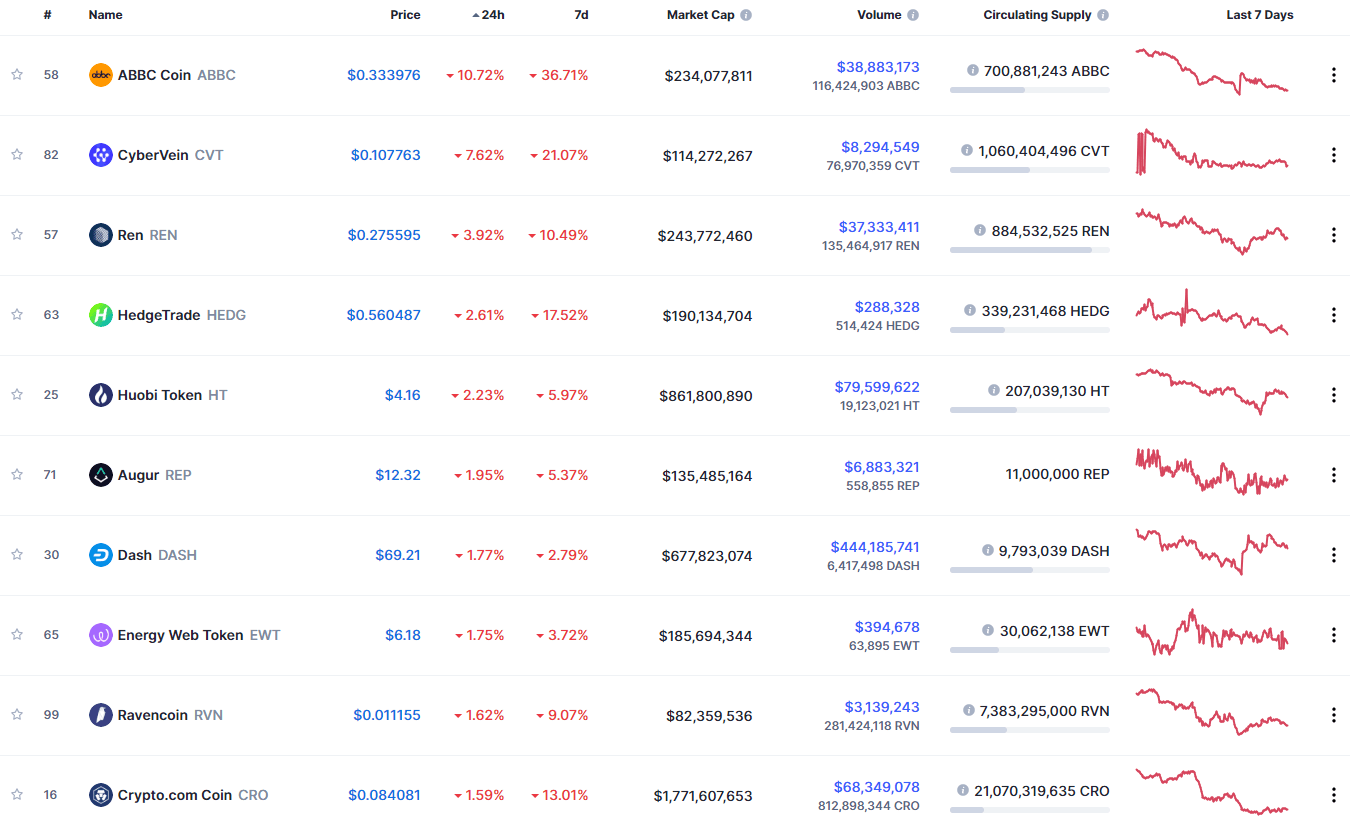
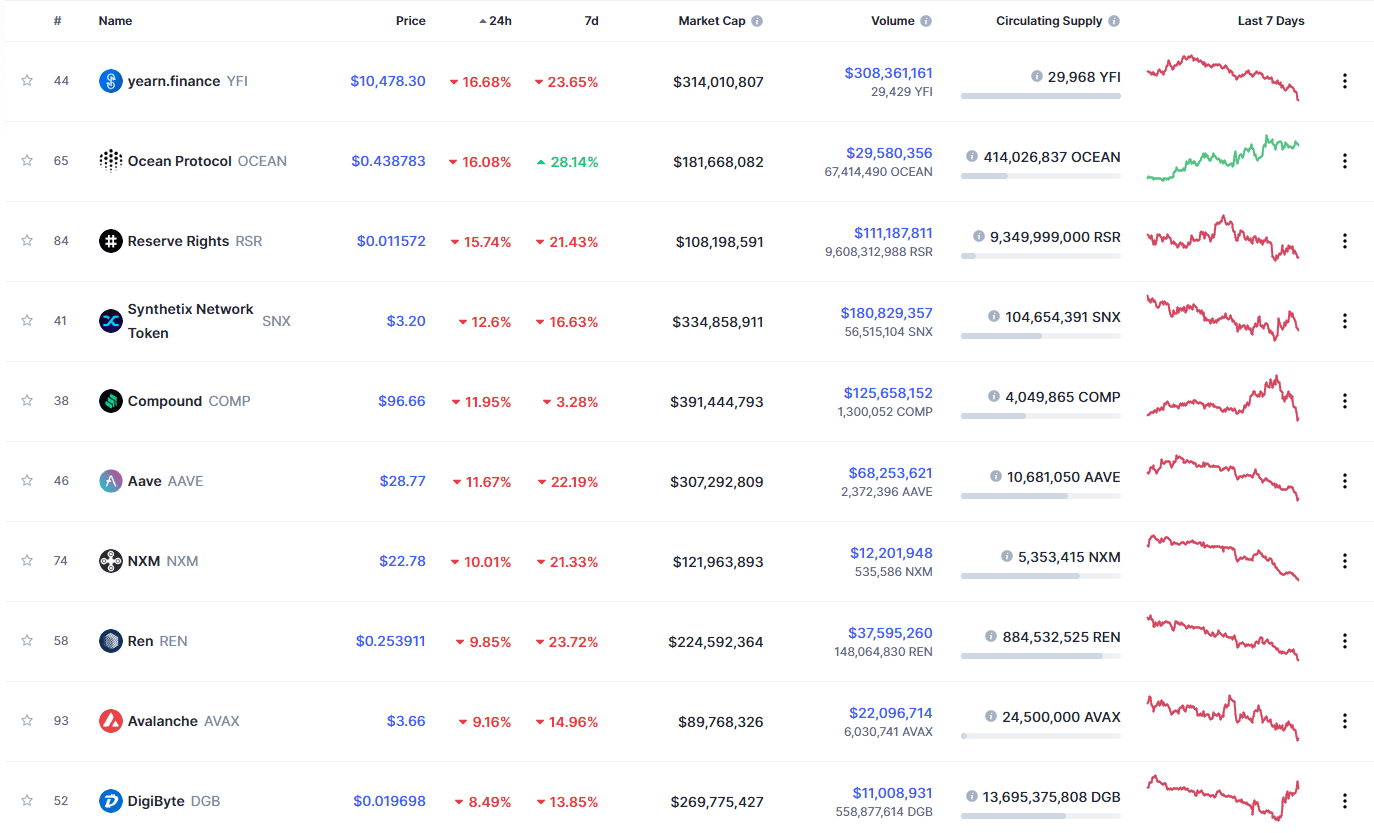
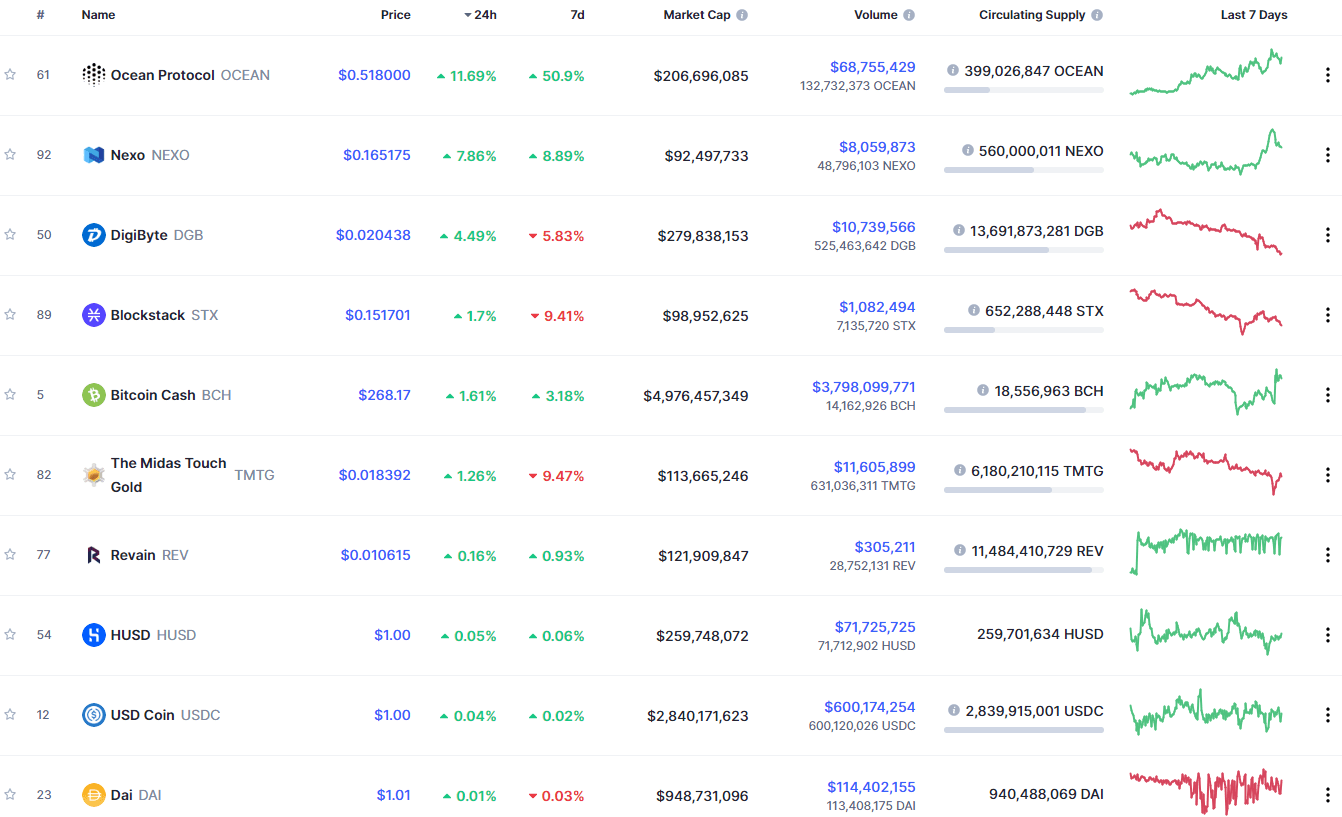
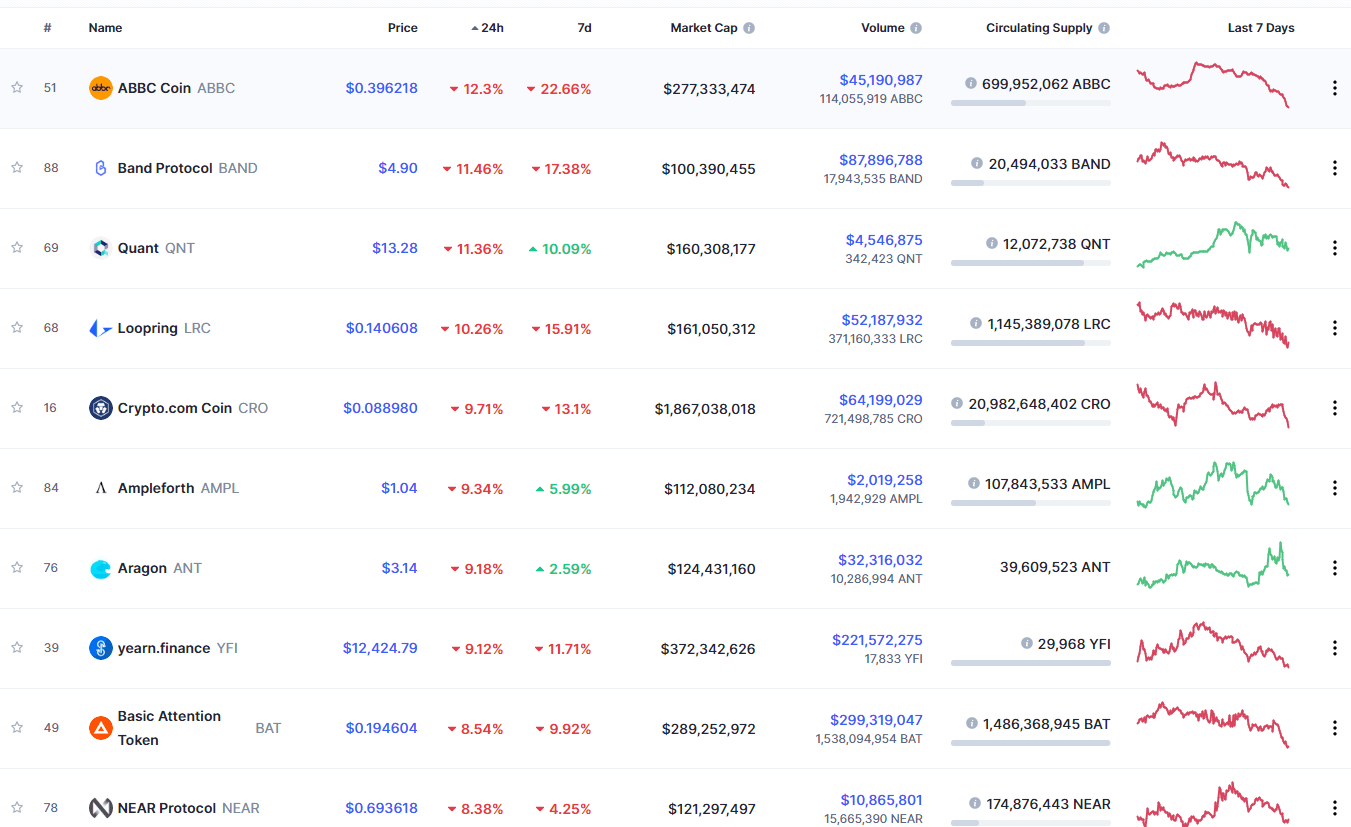
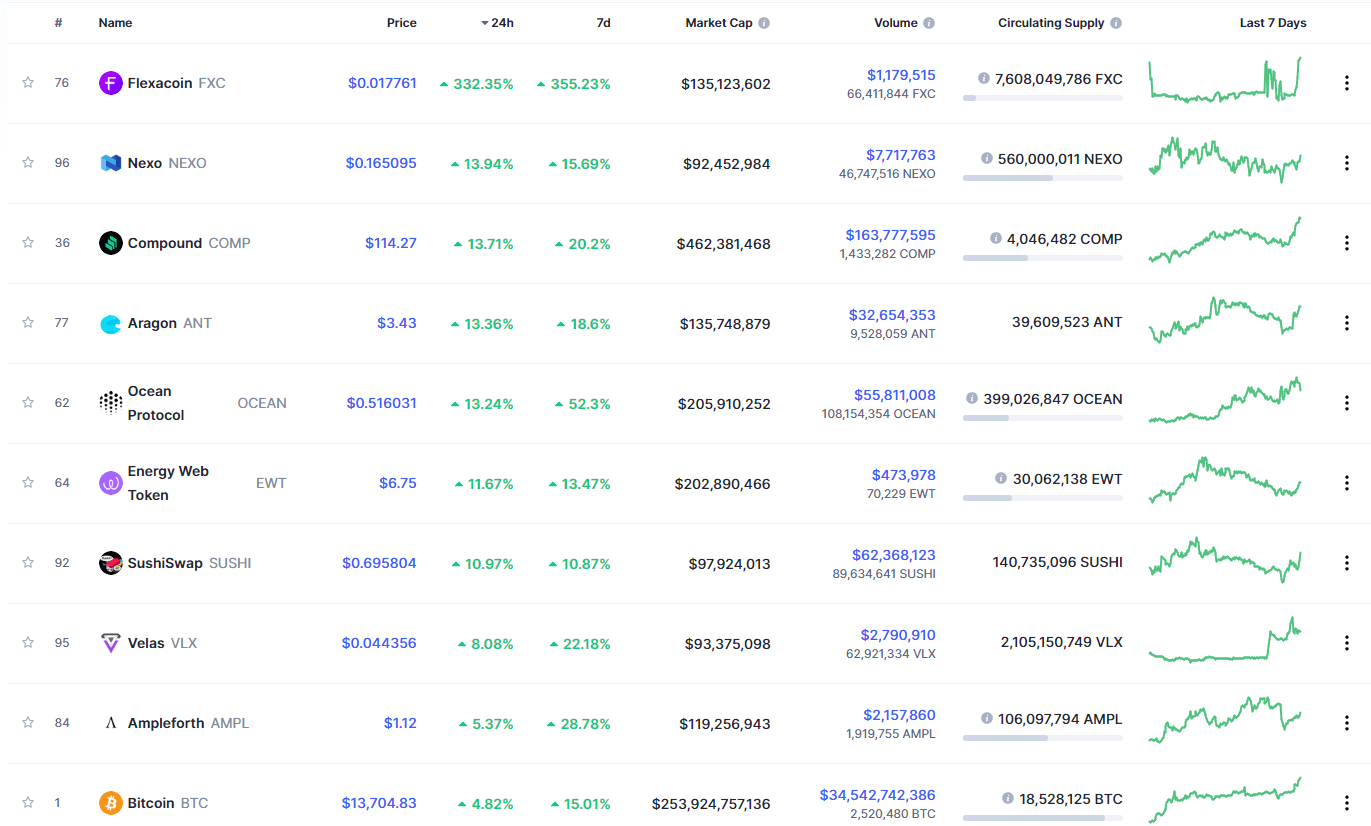
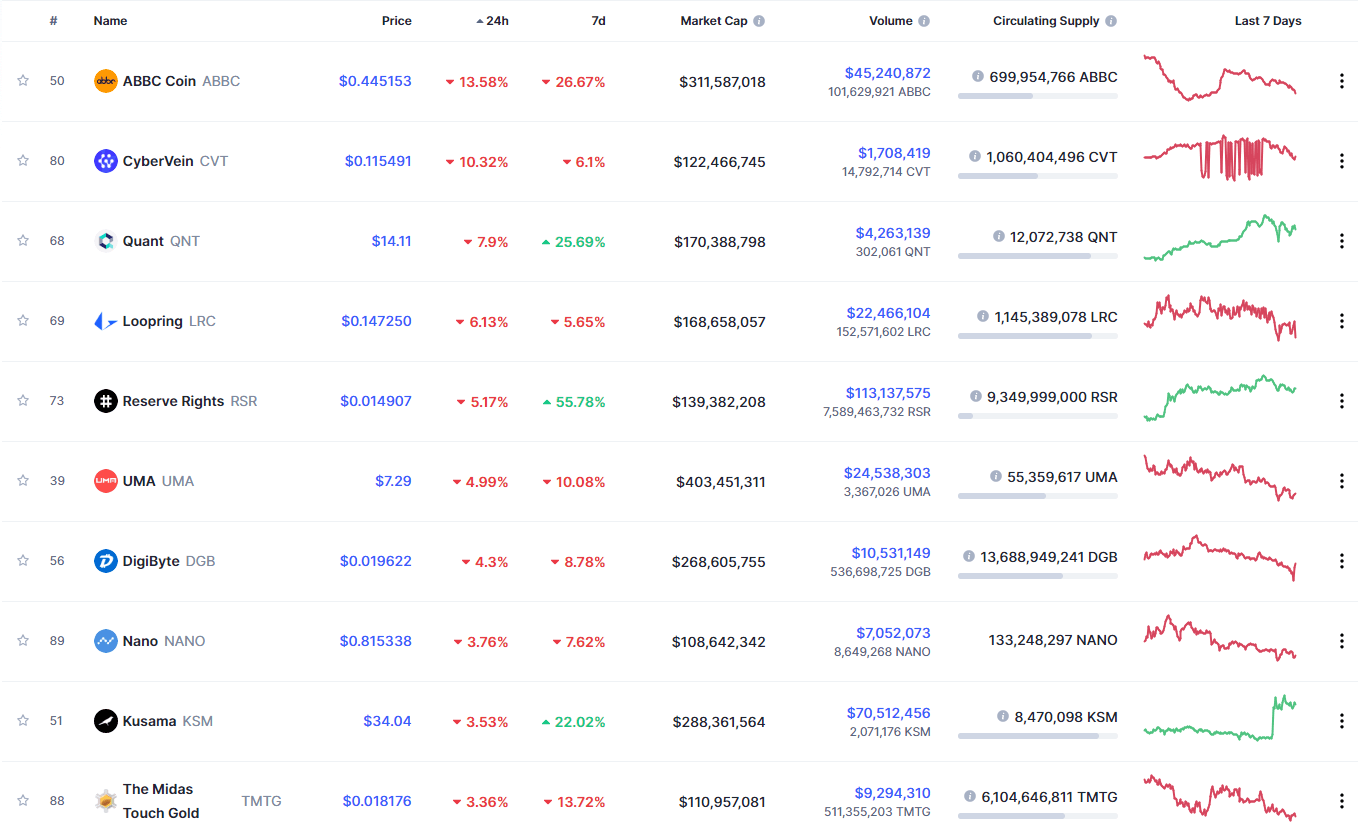
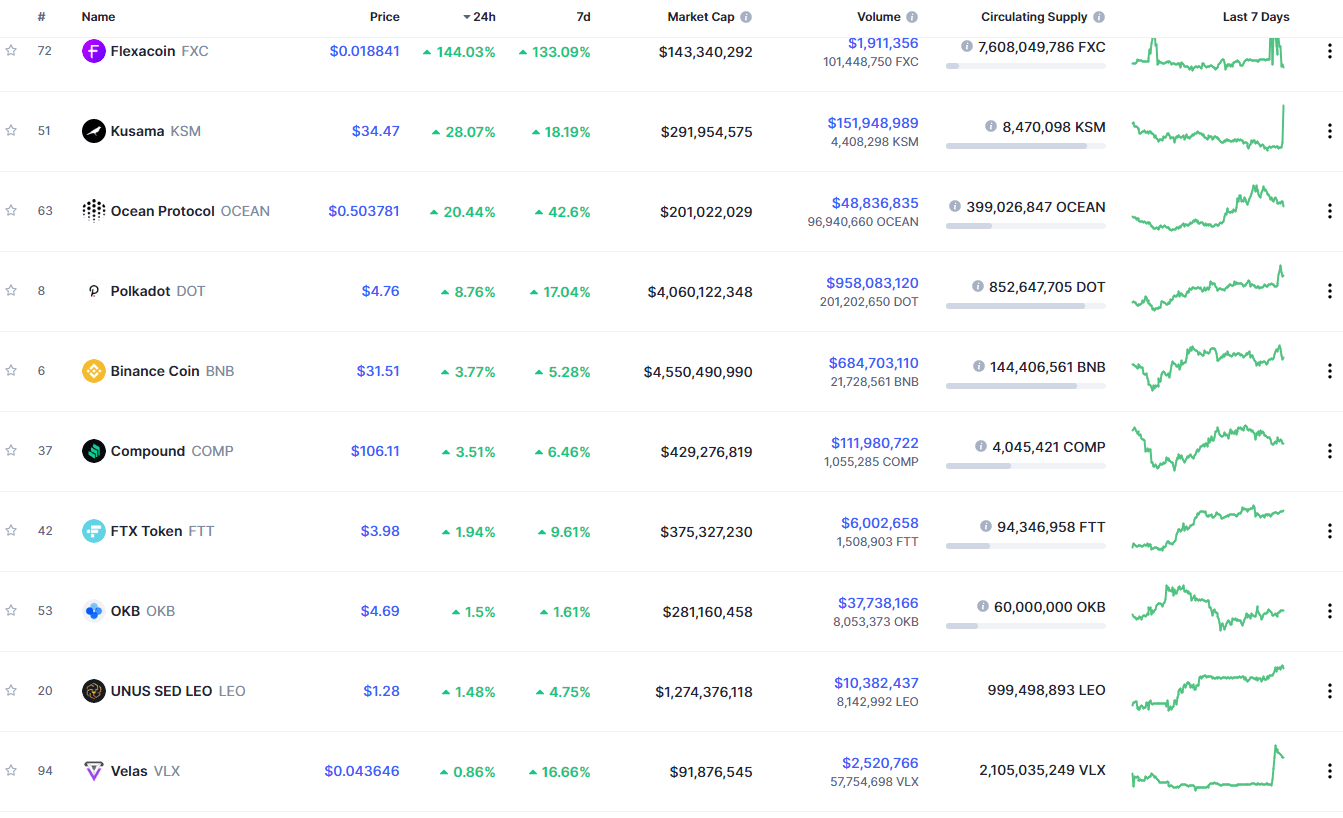
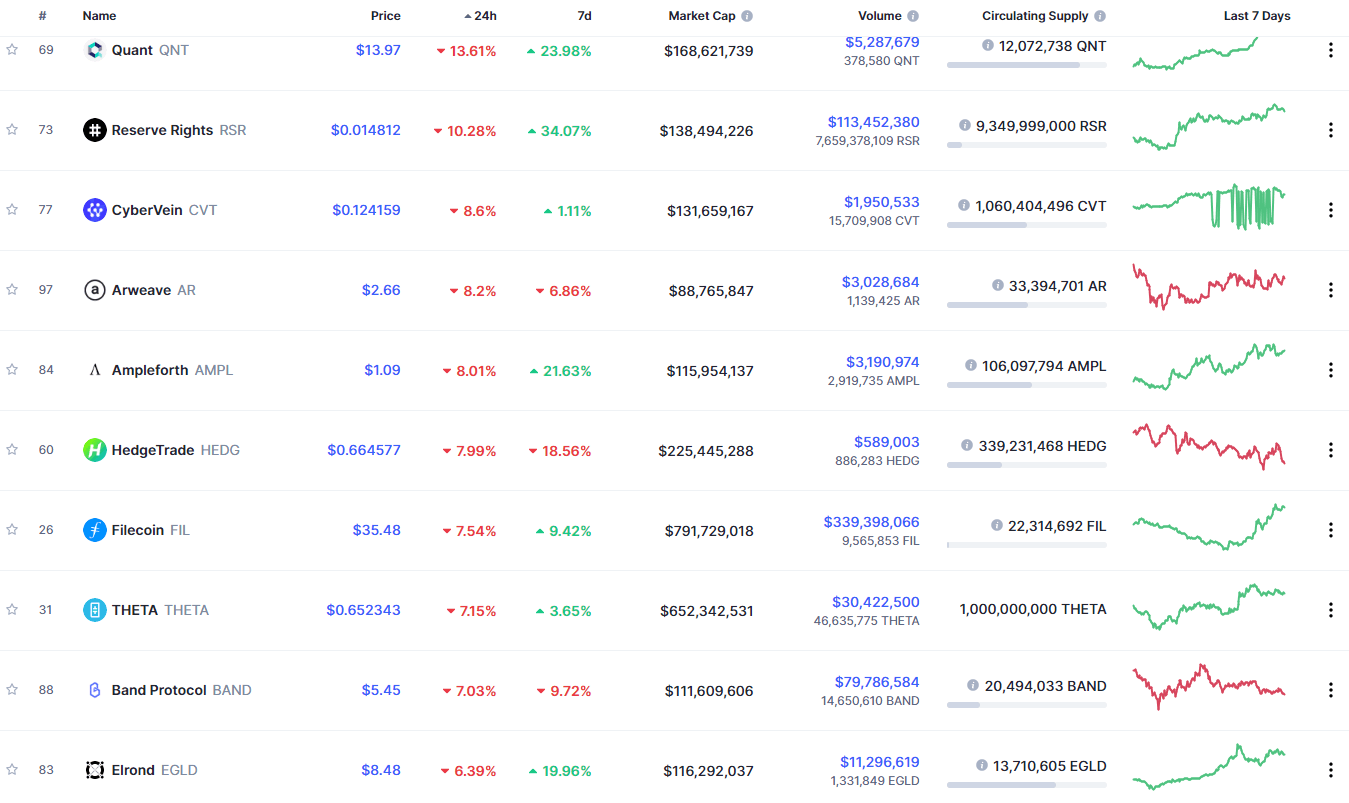
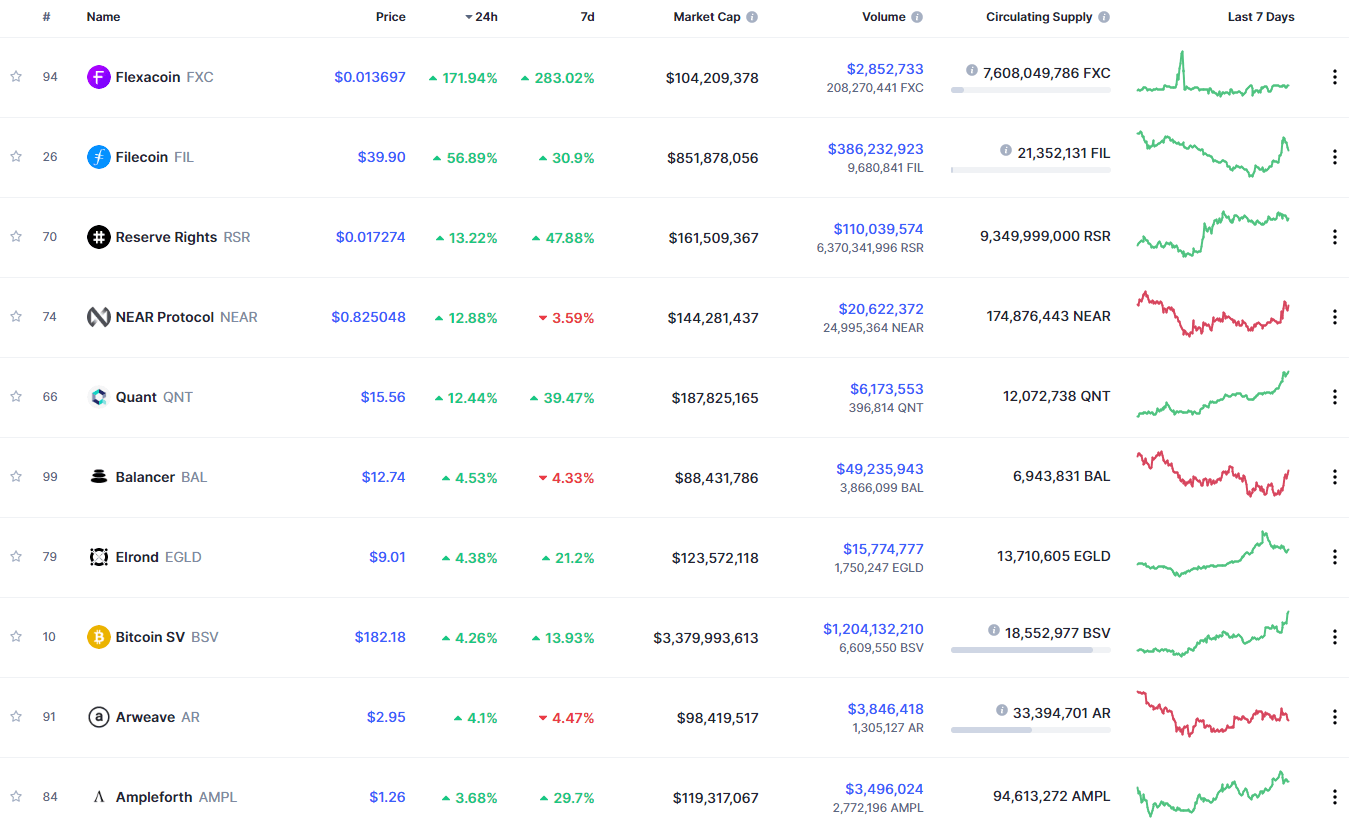
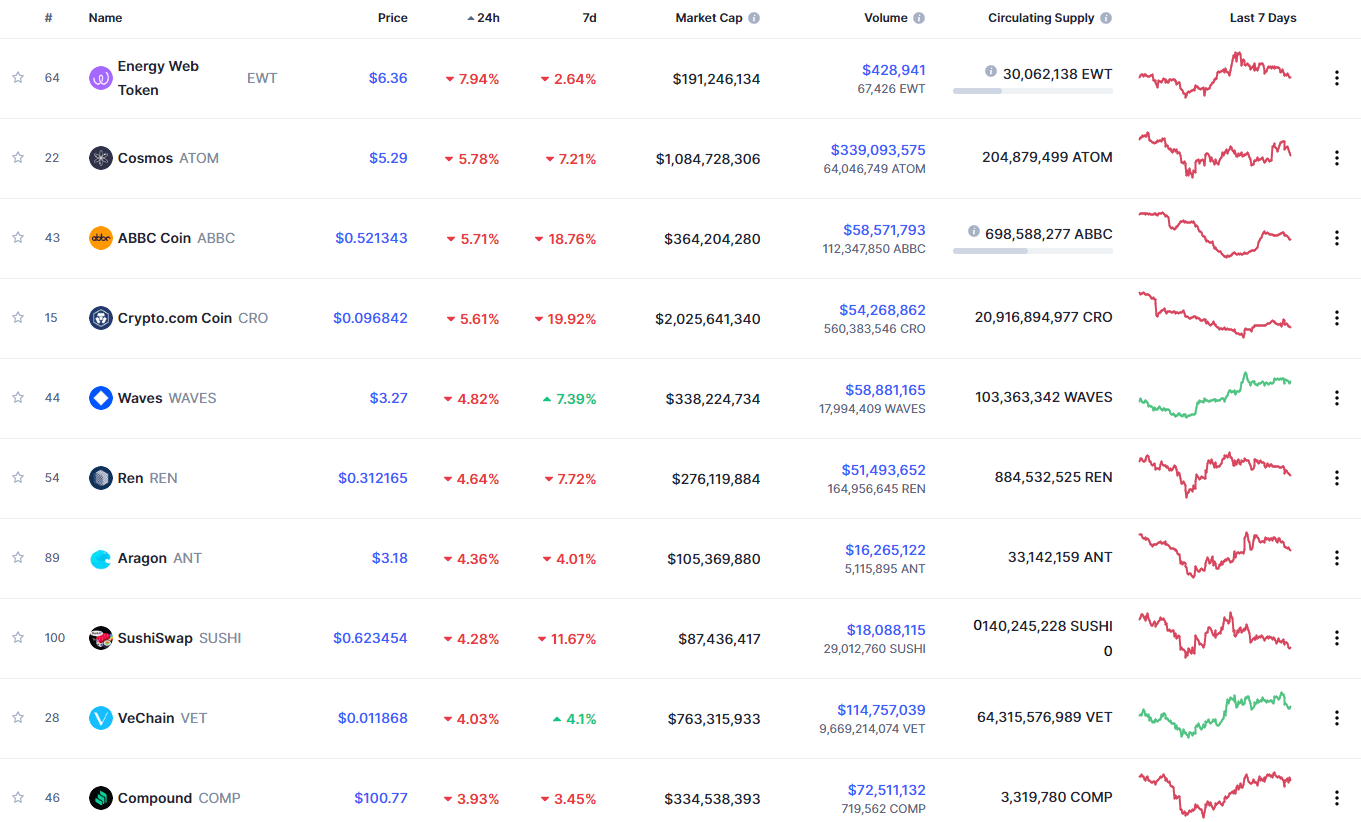
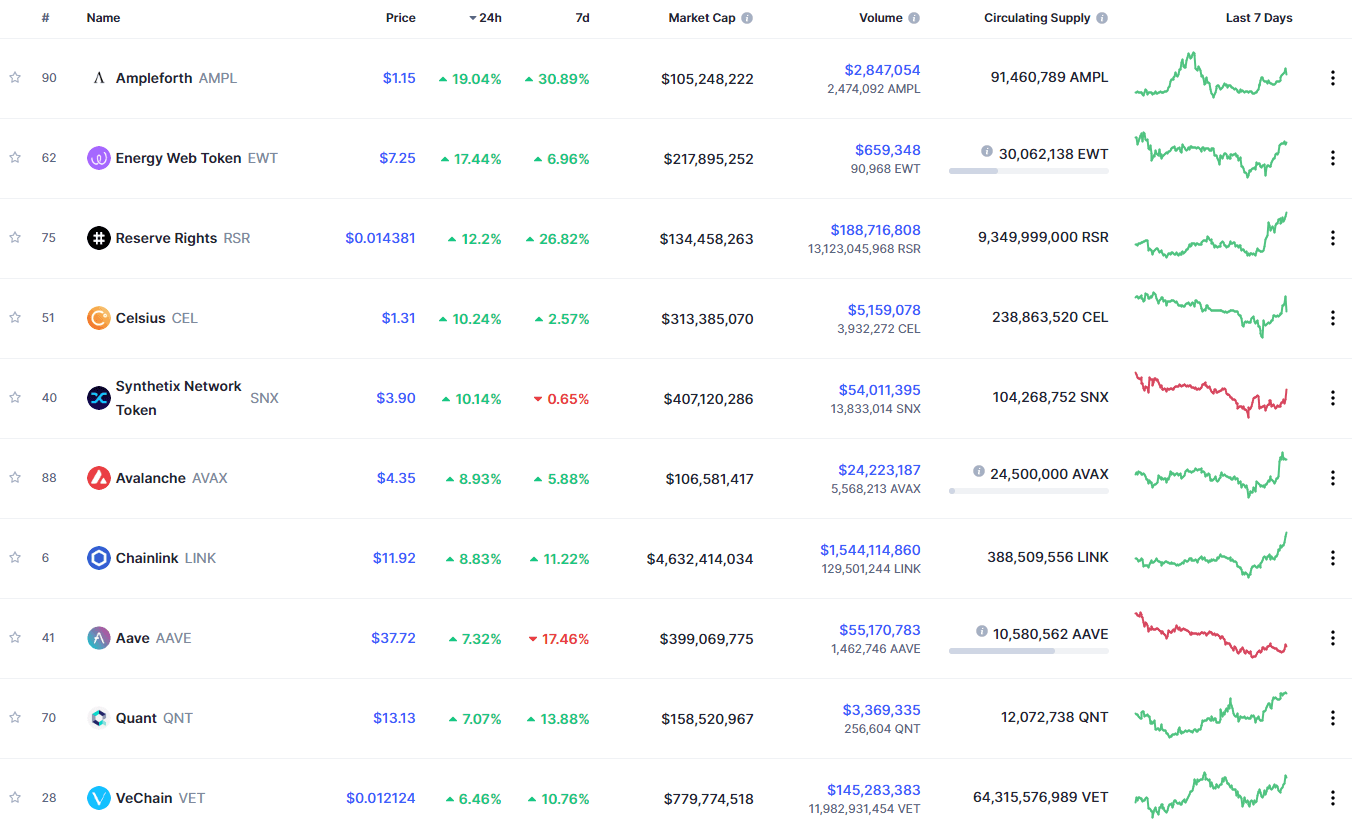
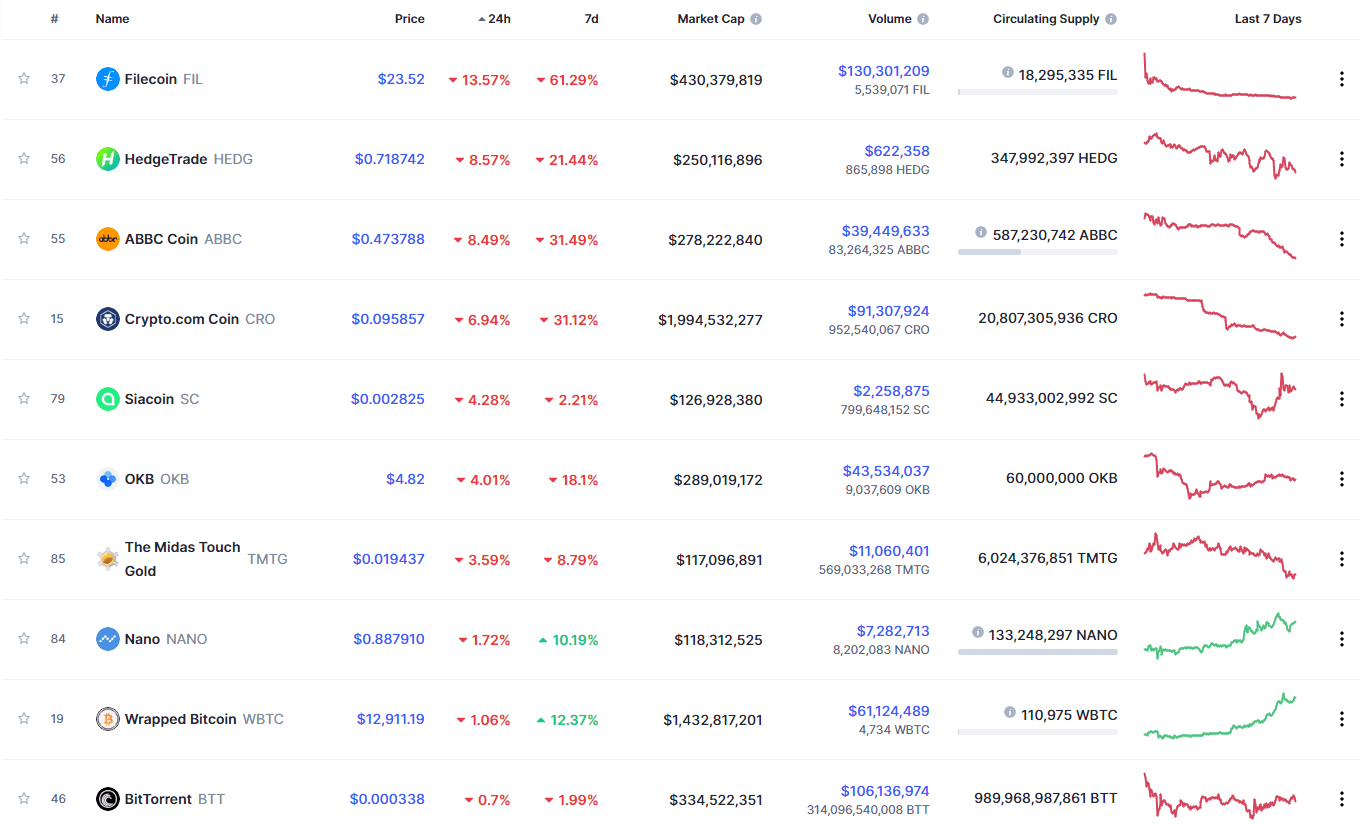
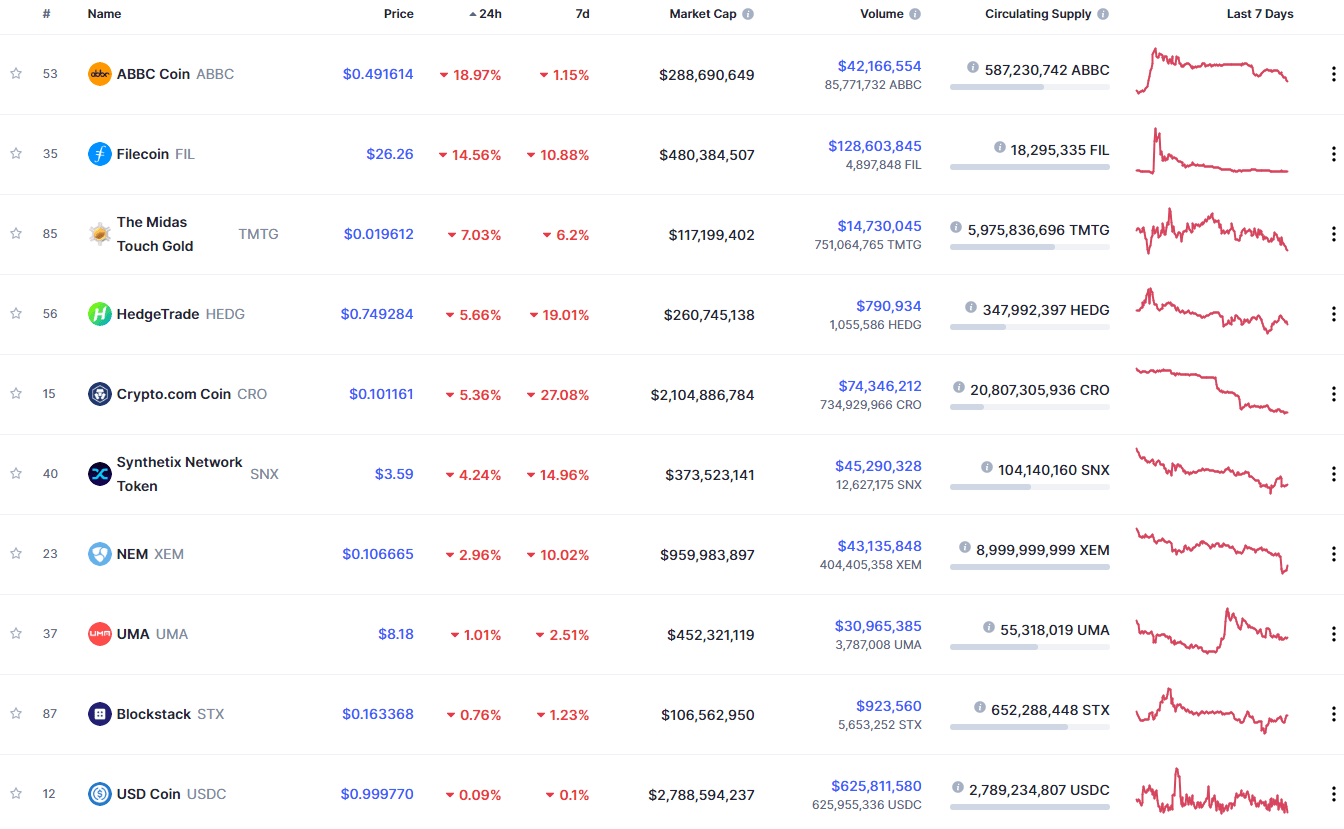
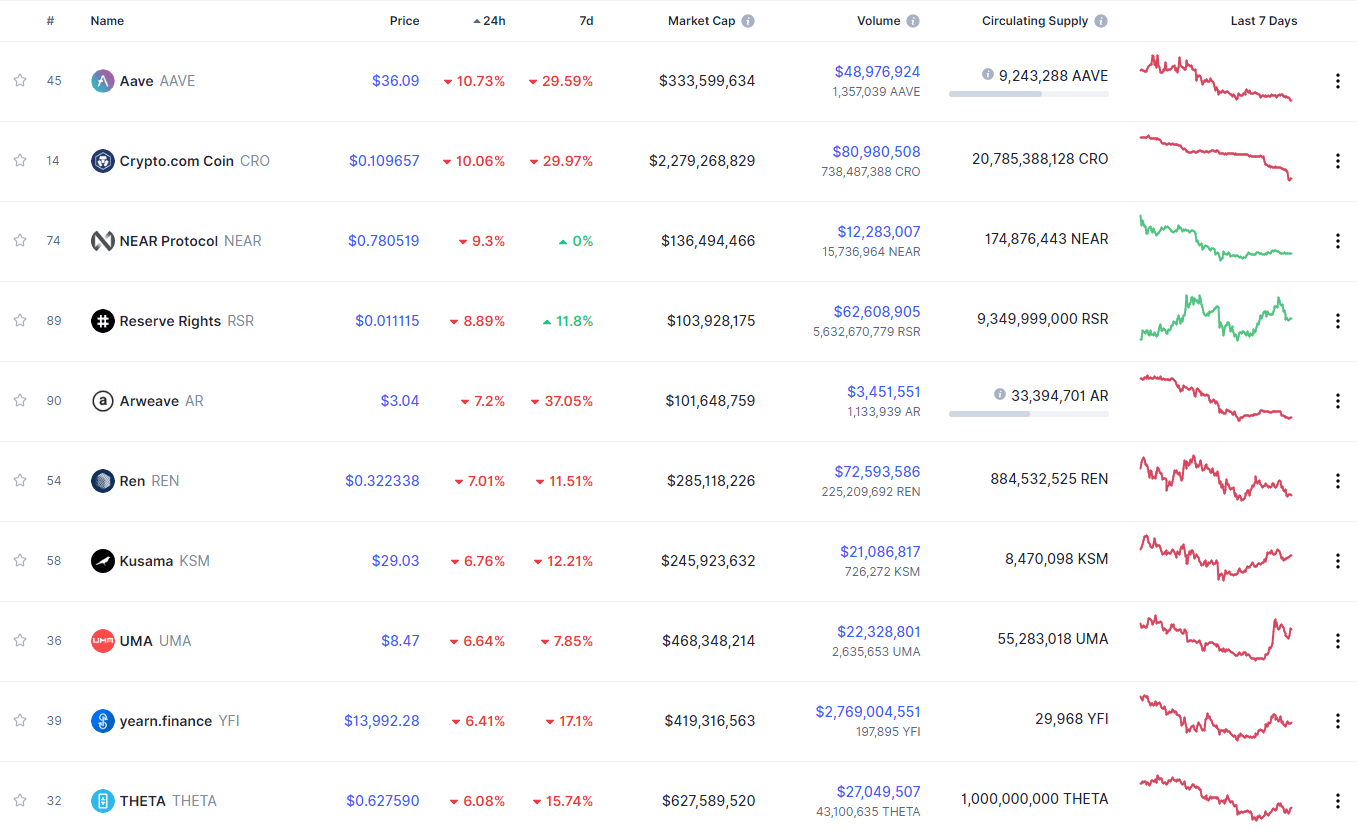
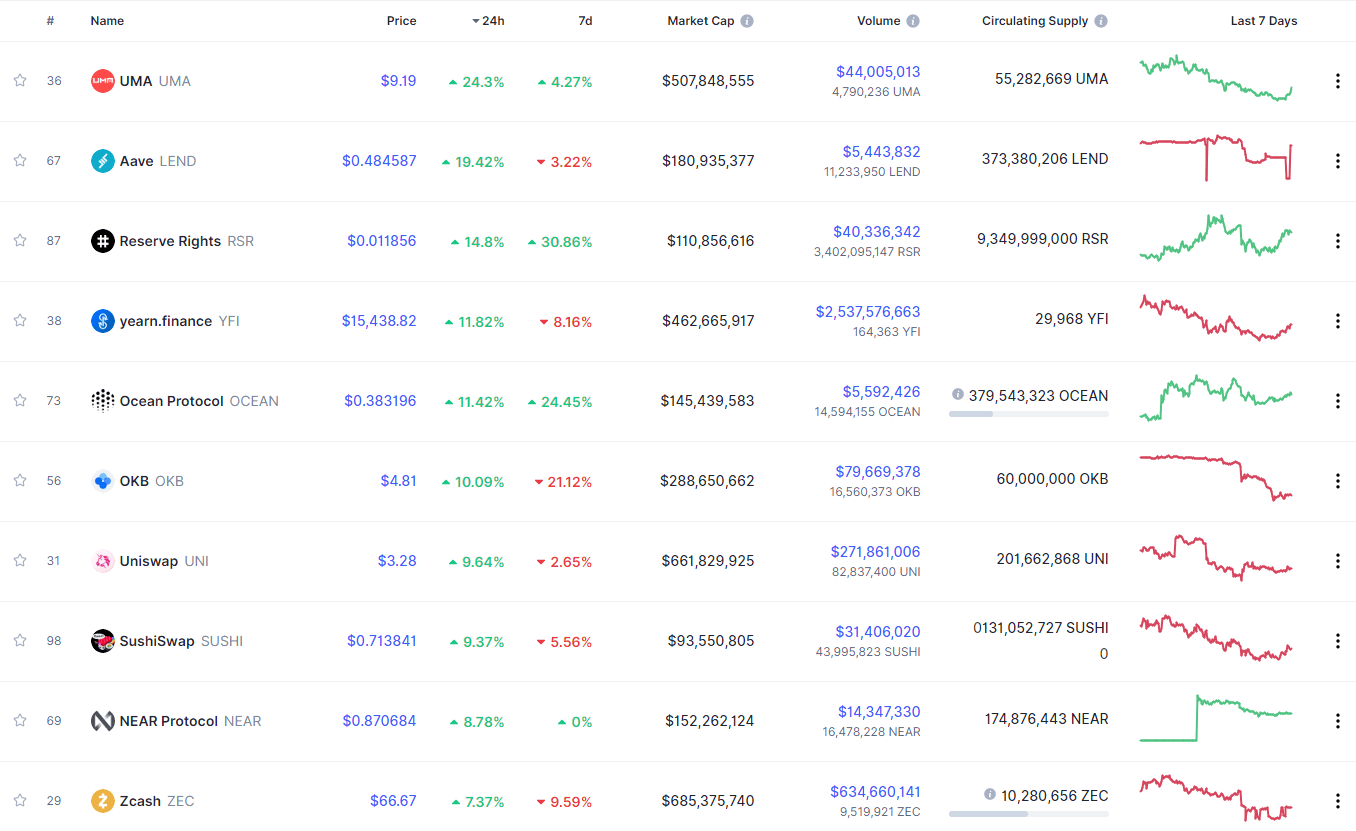
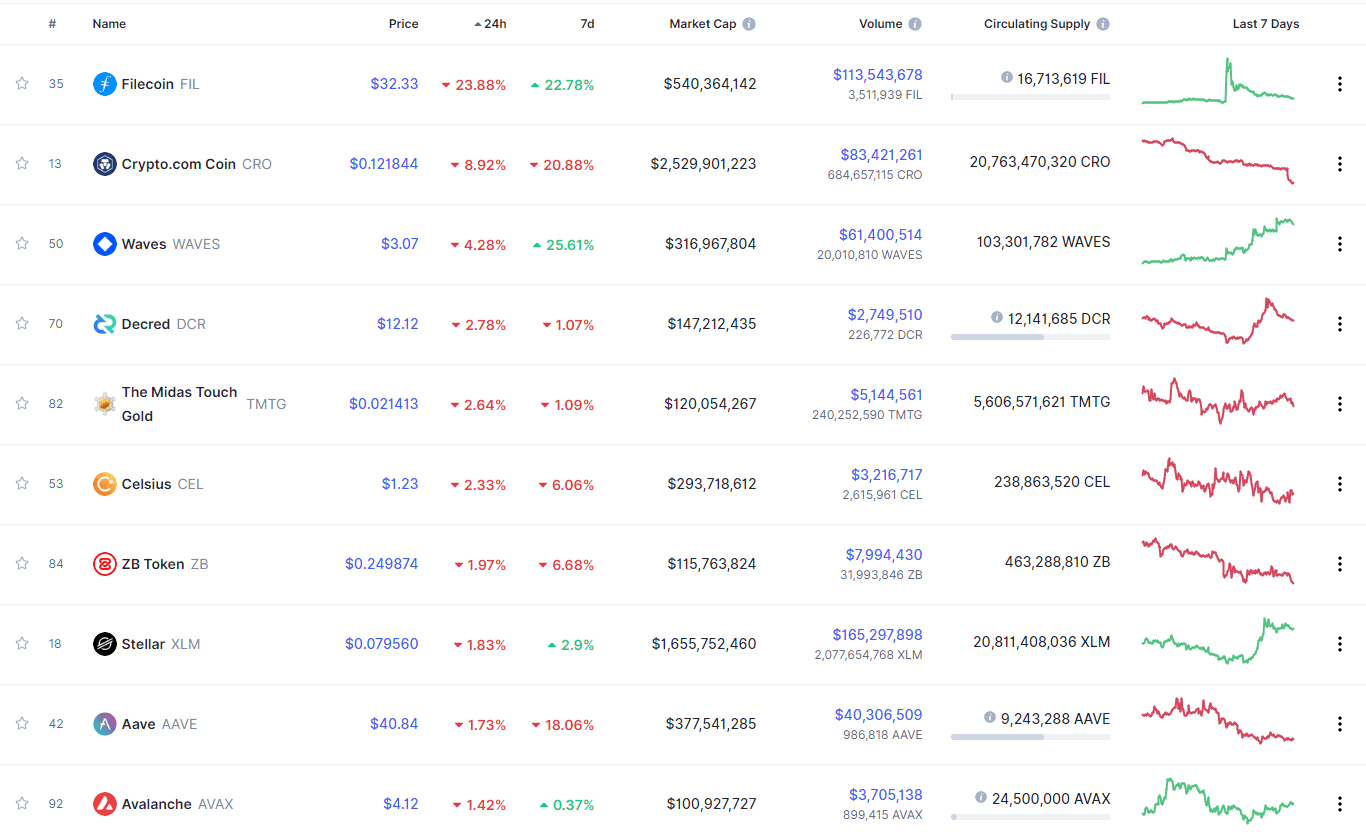
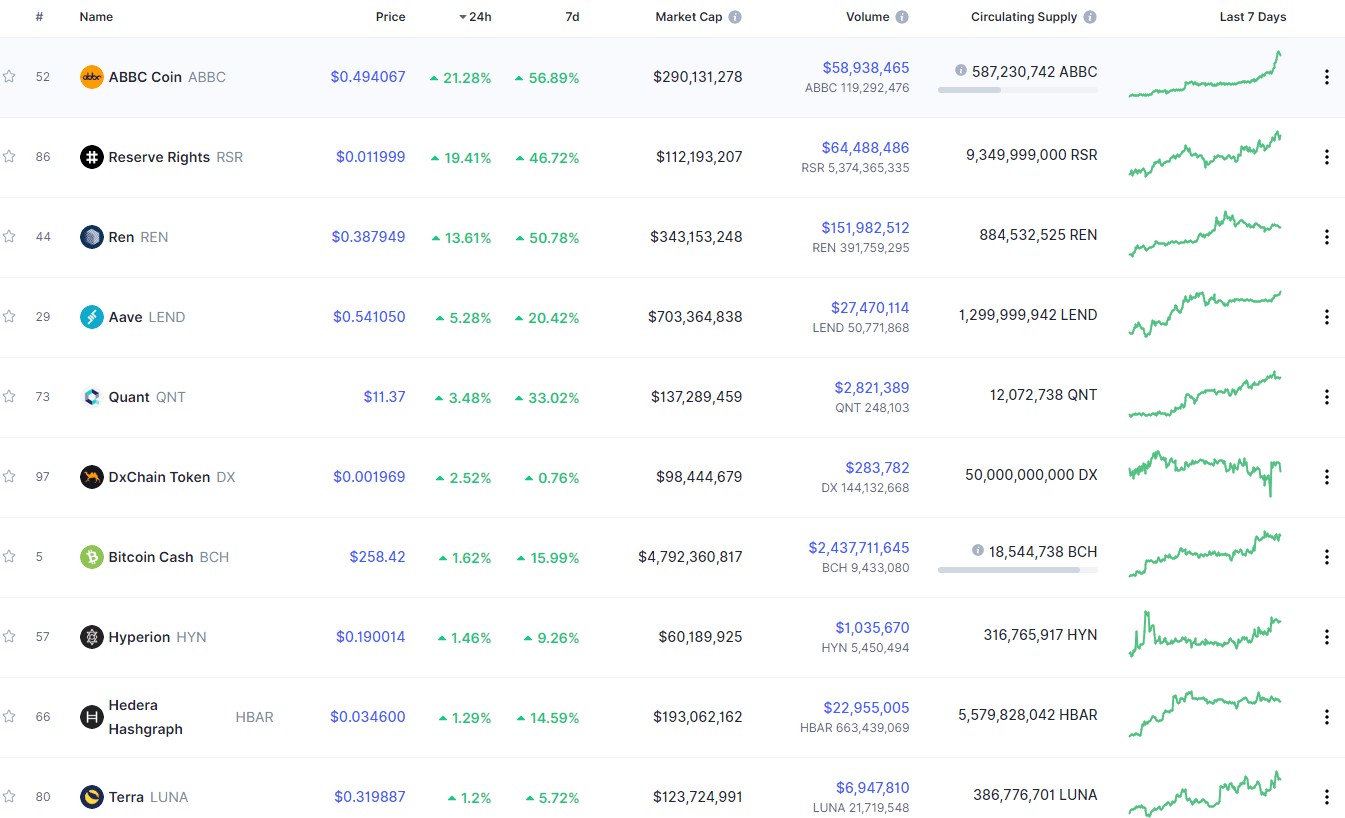
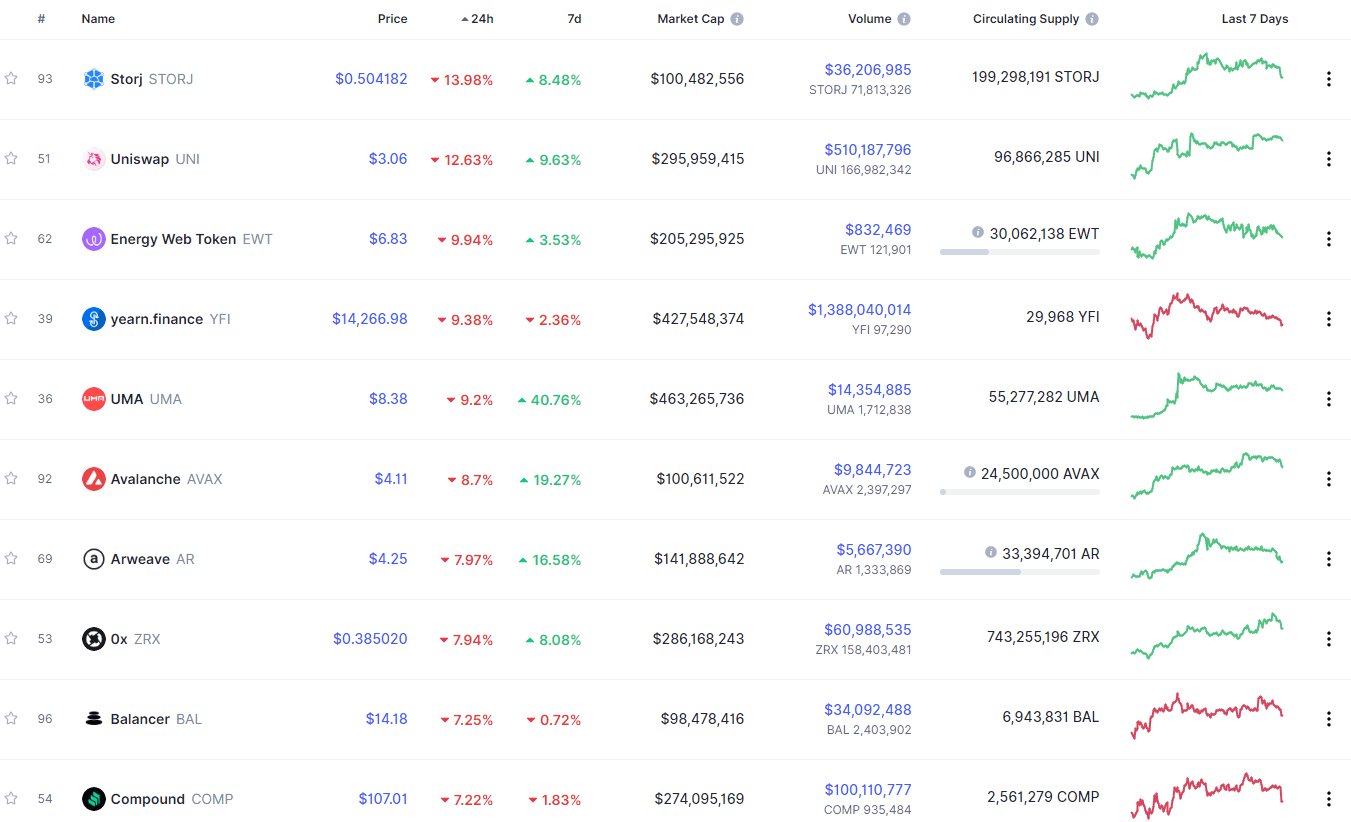
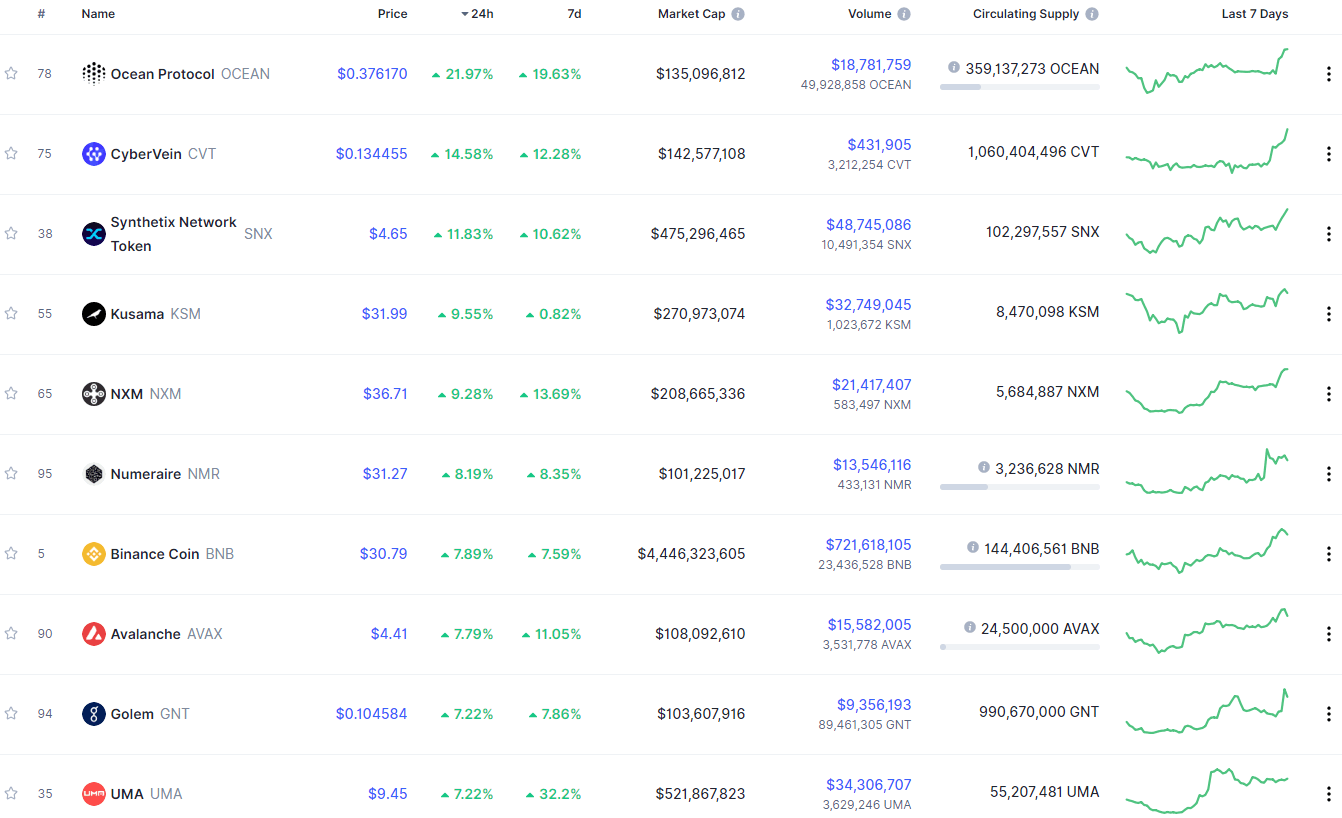
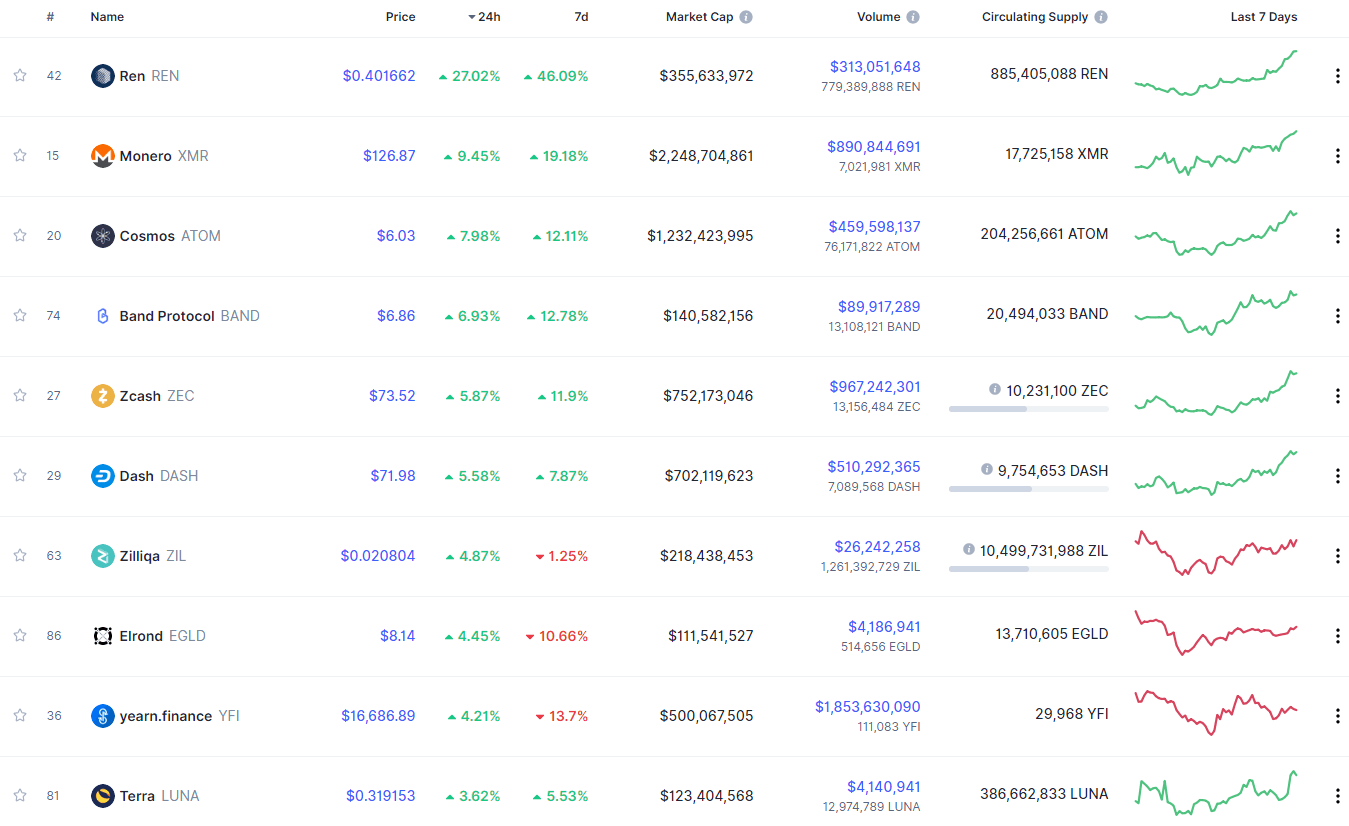
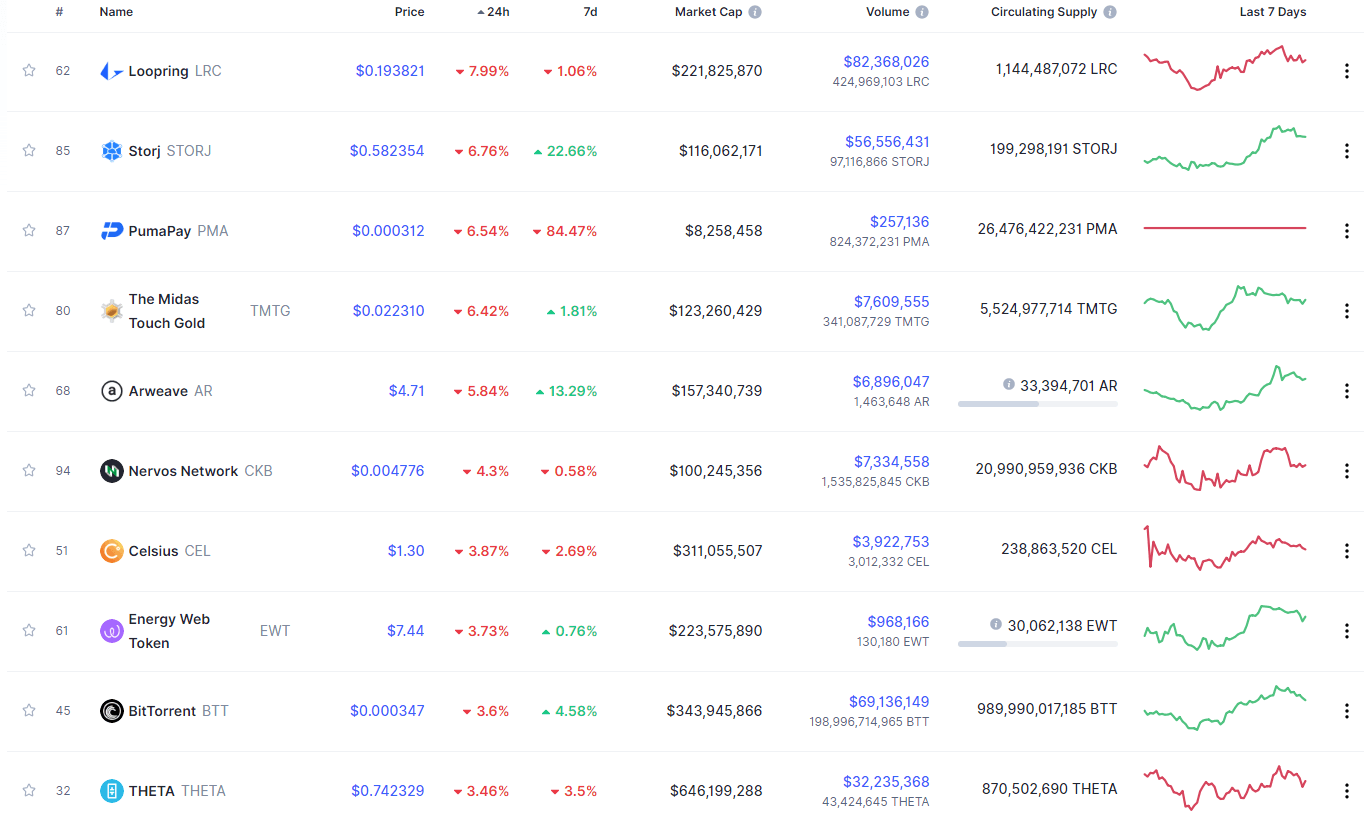
Blockstack gained 17.15% in the past 24 hours, making it the most prominent daily gainer out of the top100 cryptos ranked by market capitalization. It is closely followed by OMG Network’s gain of 12.03% and ICON’s 11.46% gain. On the other hand, yearn.finance lost 10.37%, making it the most prominent daily loser. Loopring lost 9.34% while Synthetix lost 8.90%, making them the 2nd and 3rd most prominent daily losers.
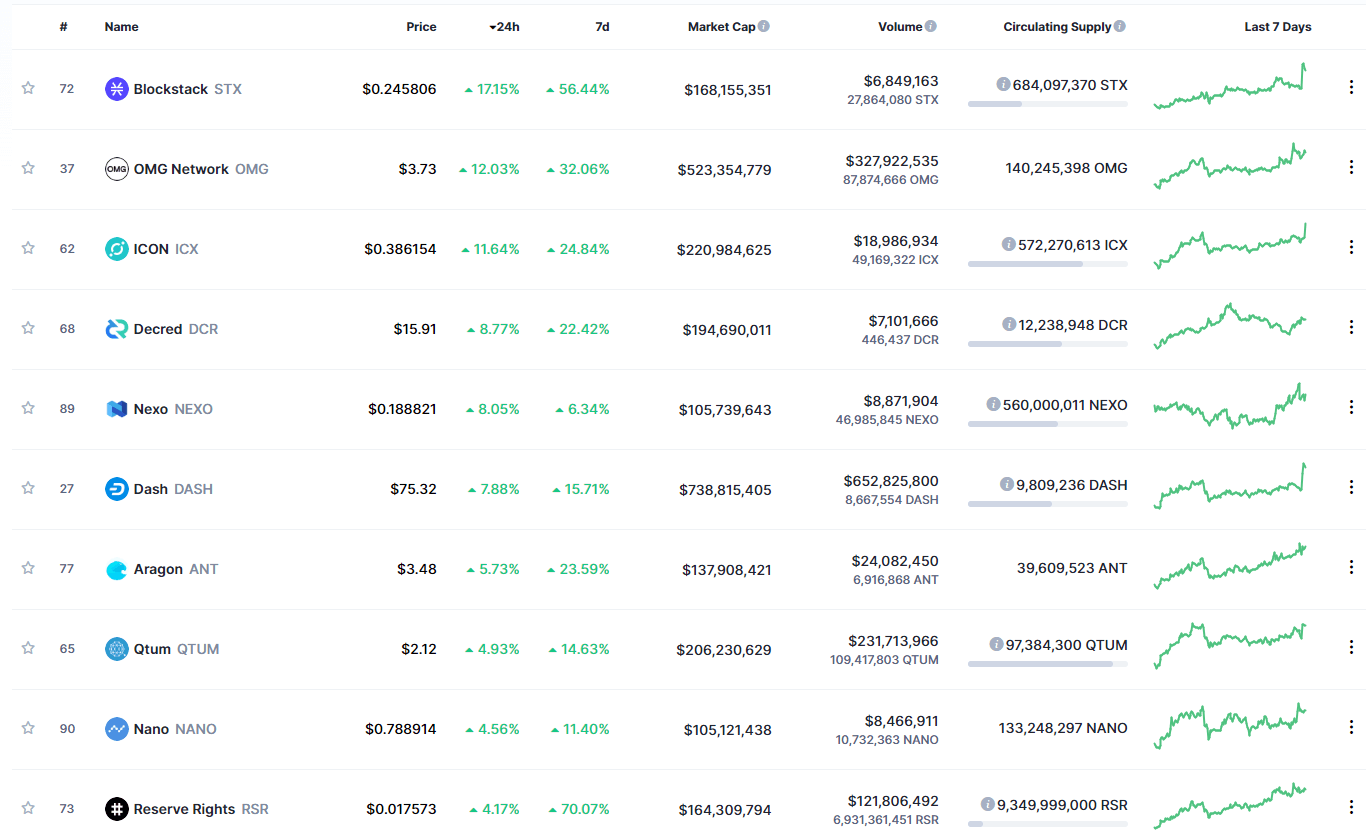
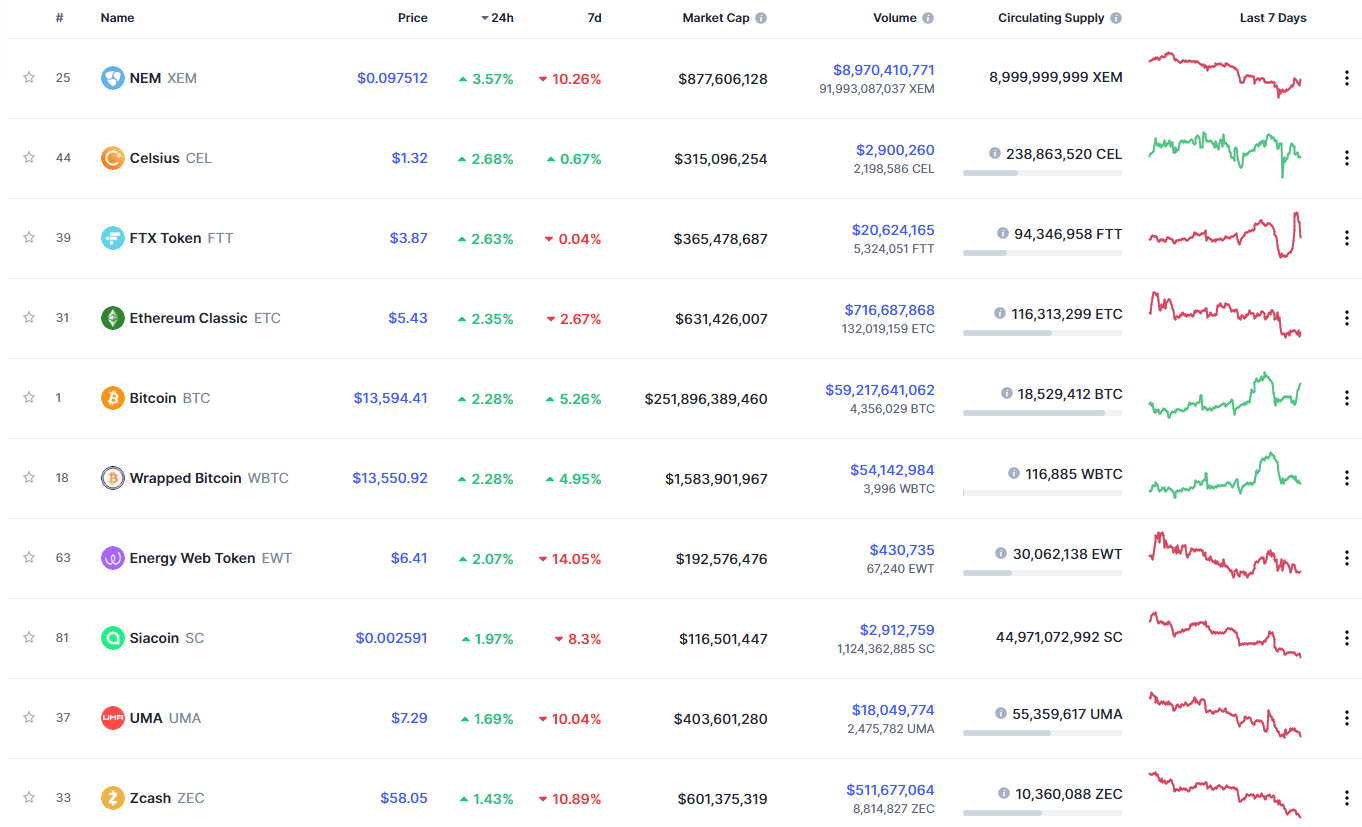
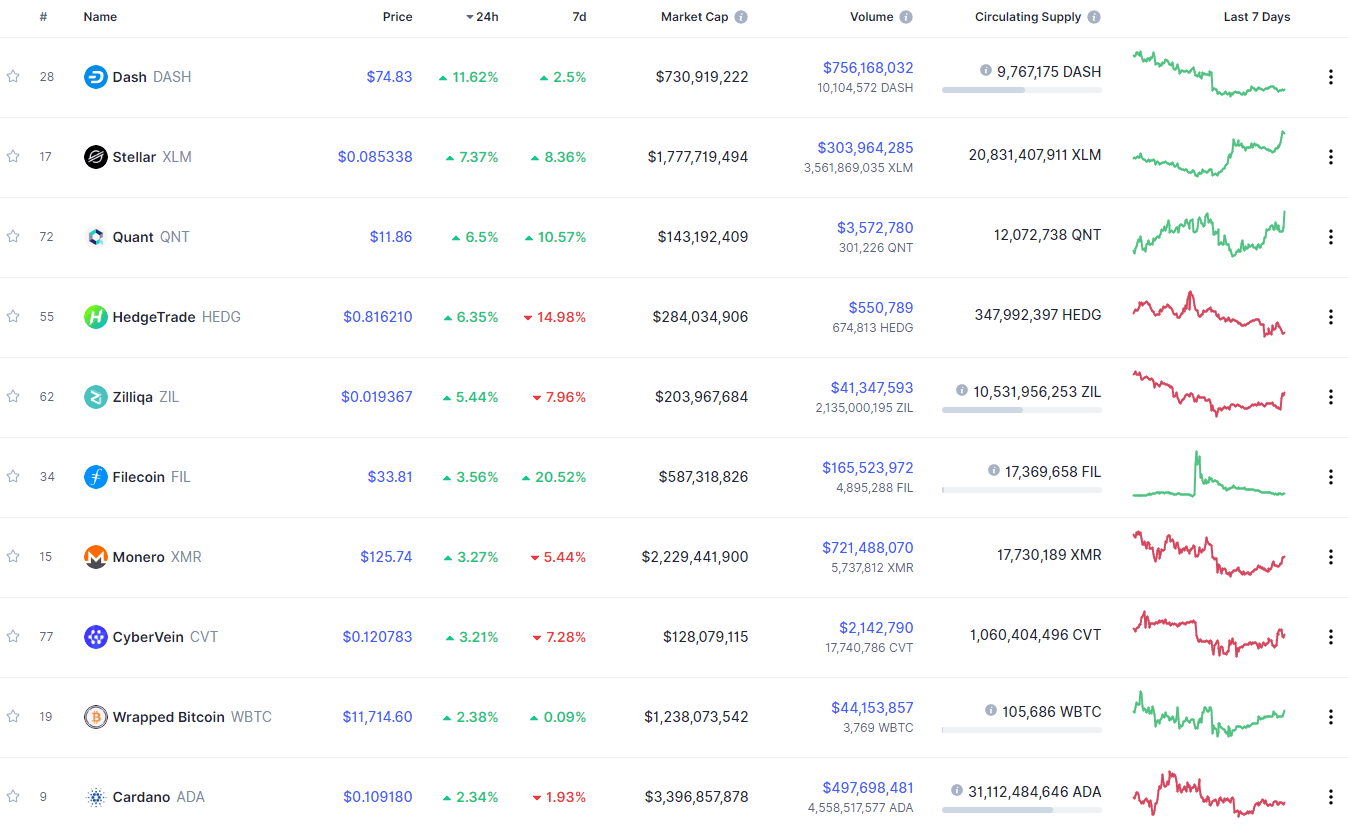
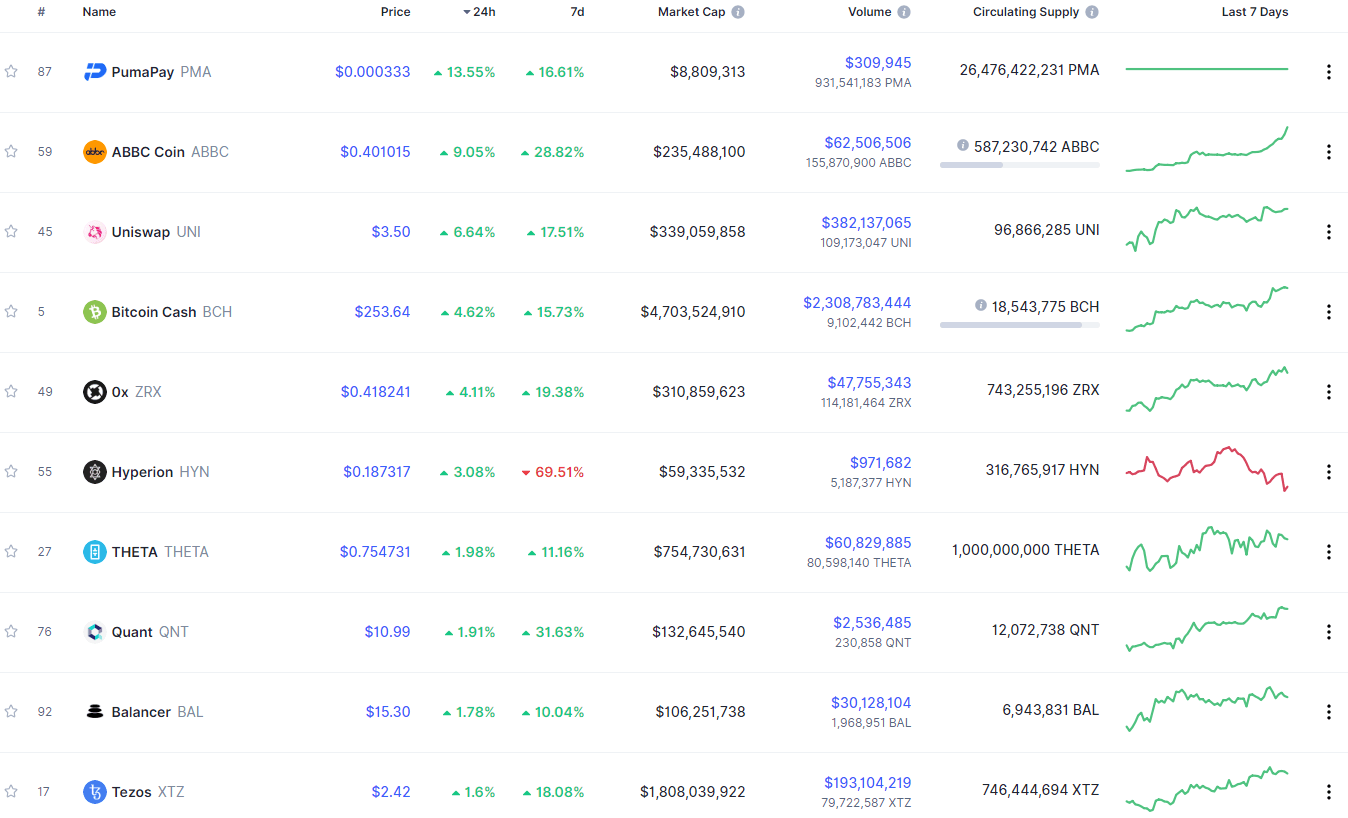
Top 10 24-hour Performers (Click to enlarge)
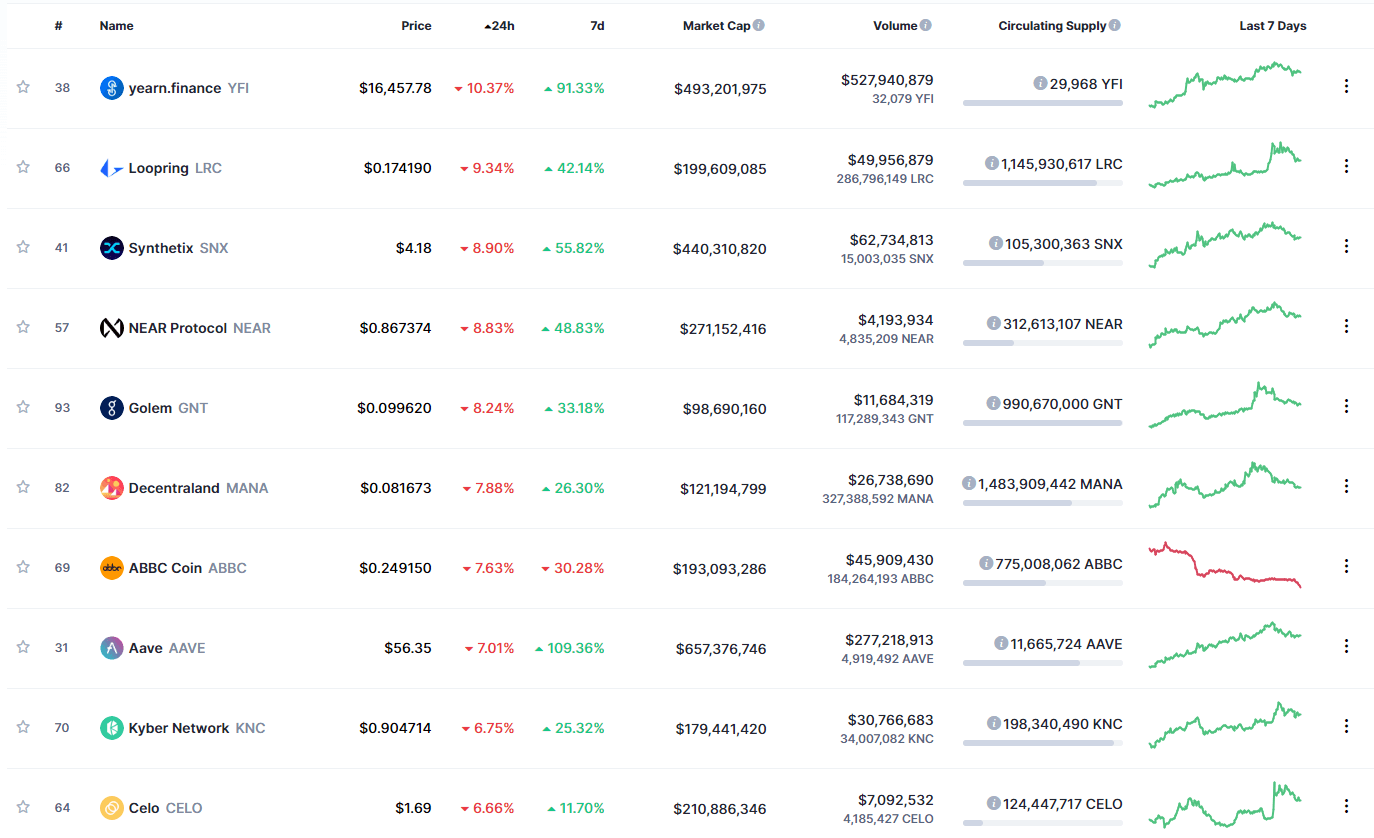
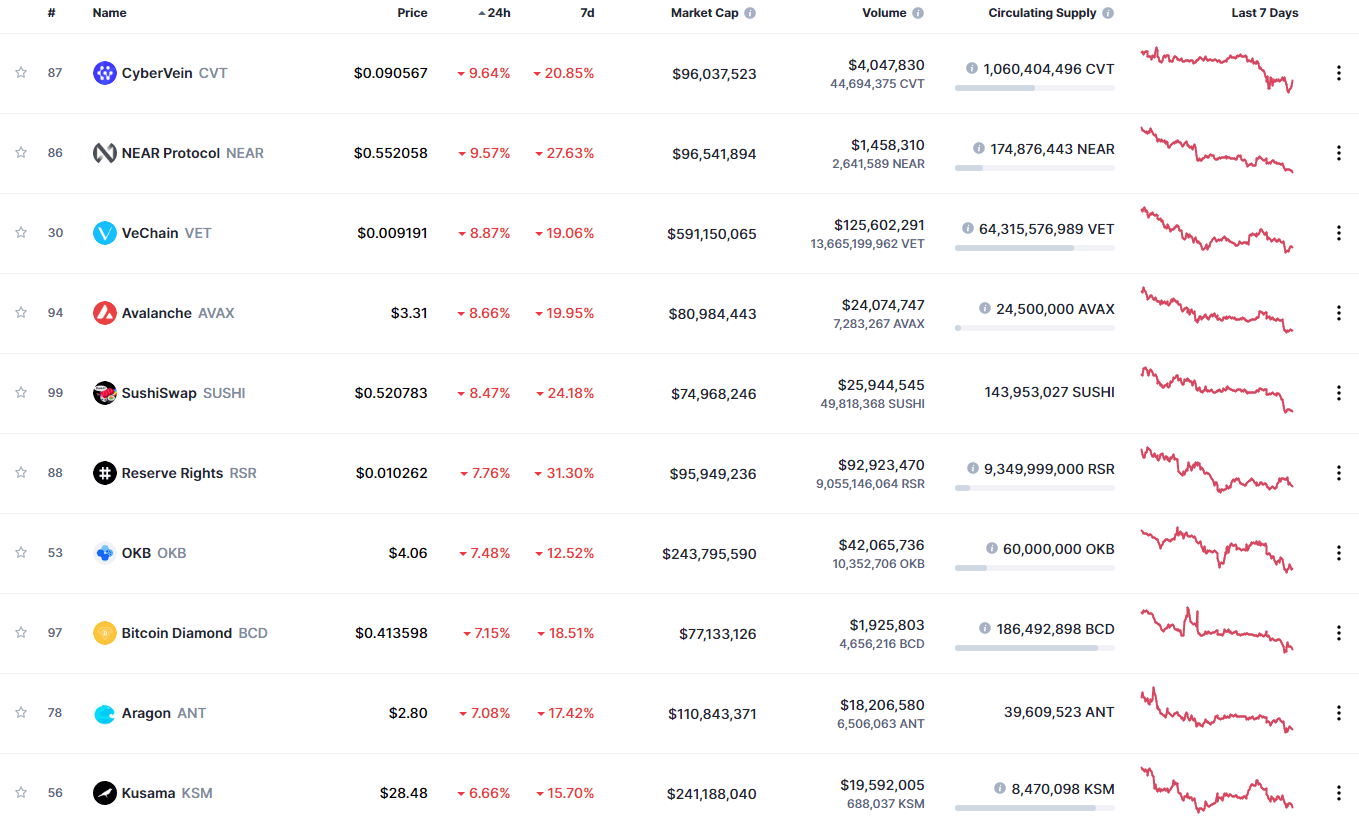
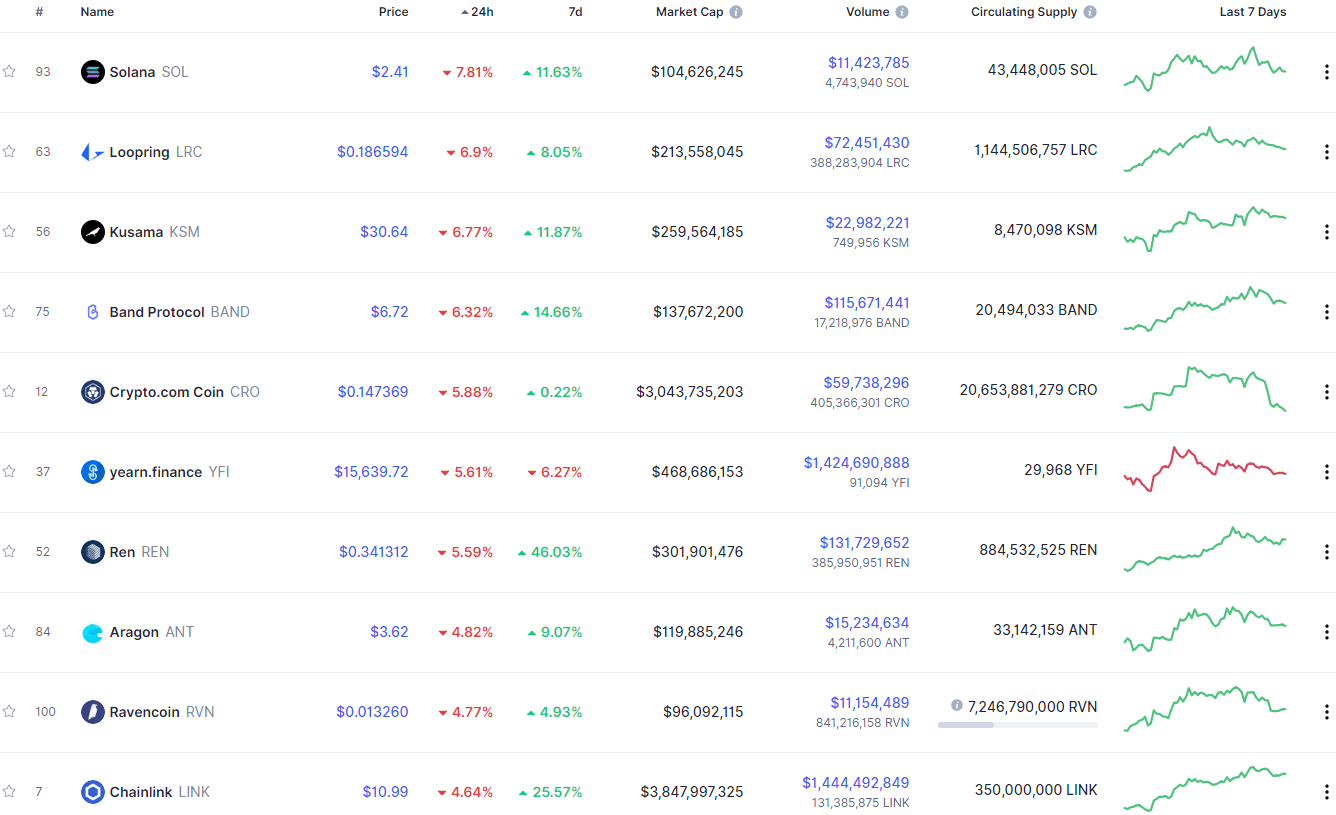
Bottom 10 24-hour Performers (Click to enlarge)
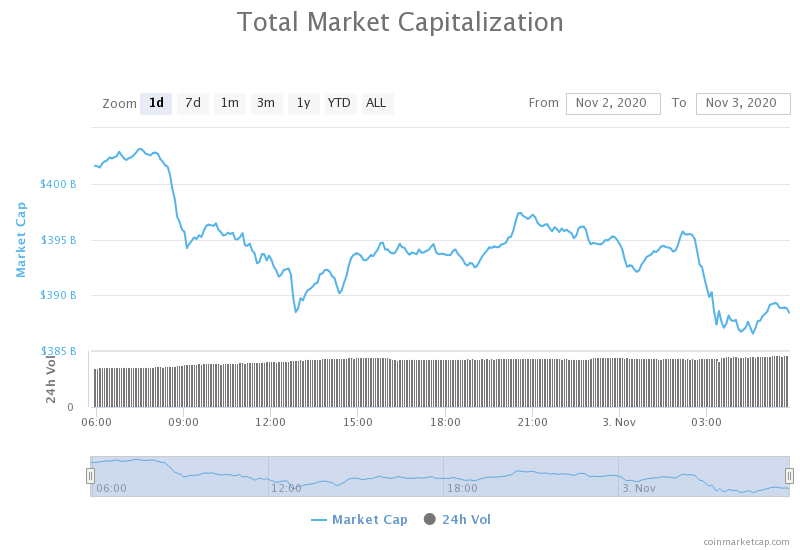
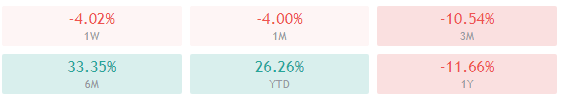
Bitcoin’s market dominance has increased slightly since we last reported, with its value is currently staying at 64.5%. This value represents a 0.6% difference to the upside compared to the value it had yesterday.
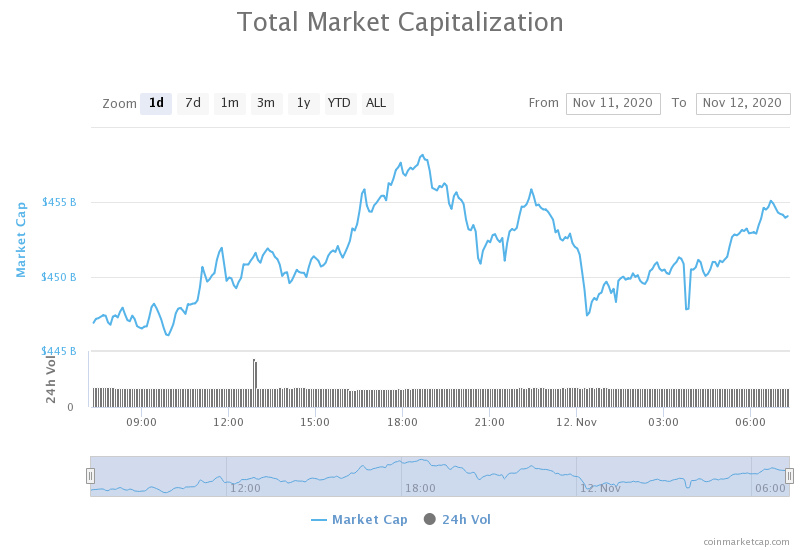
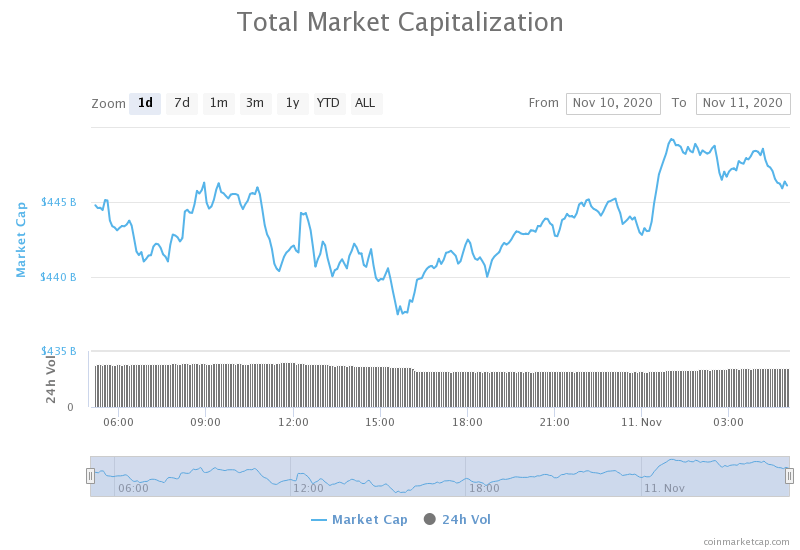
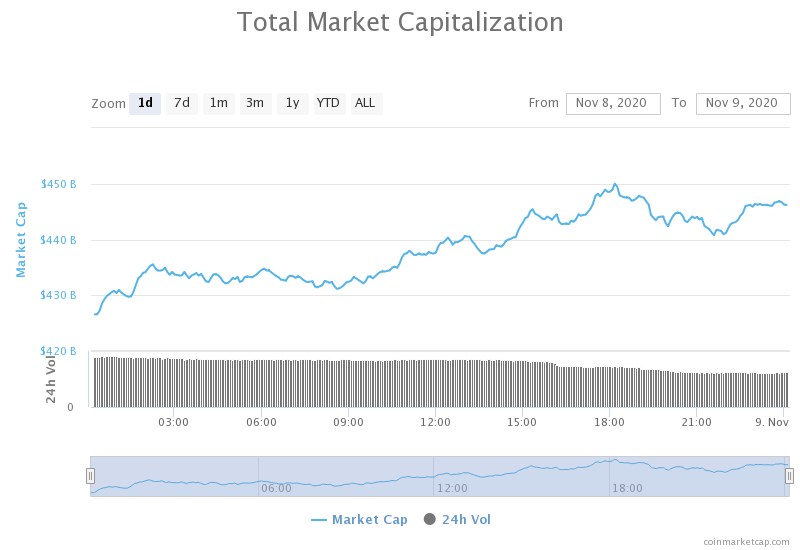
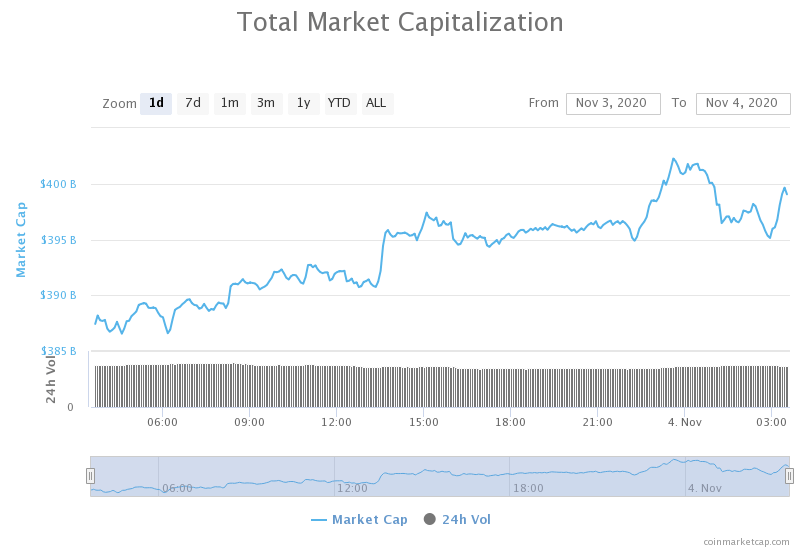
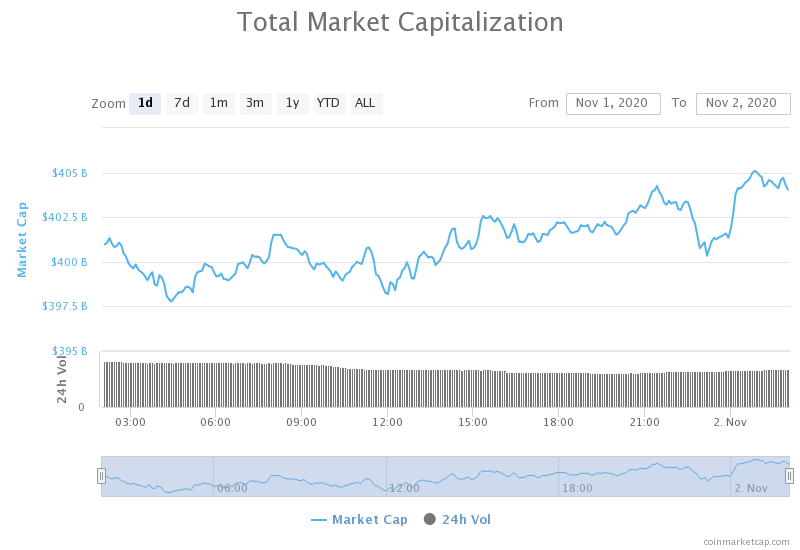
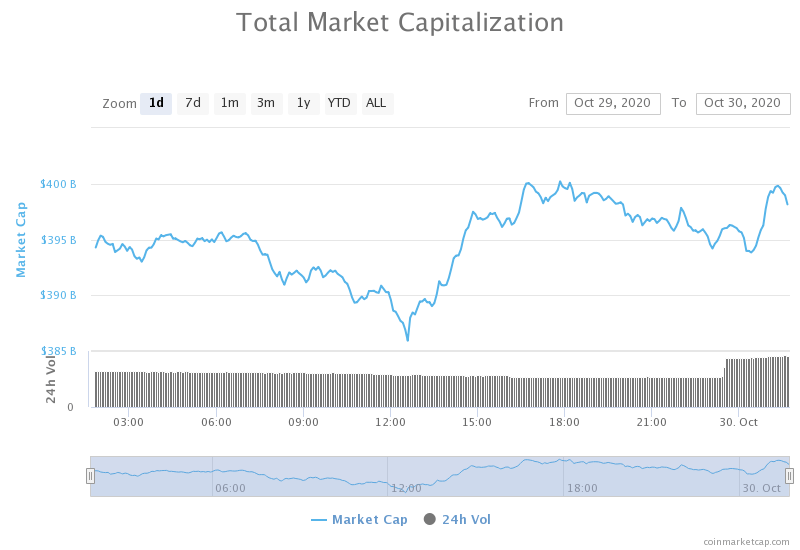
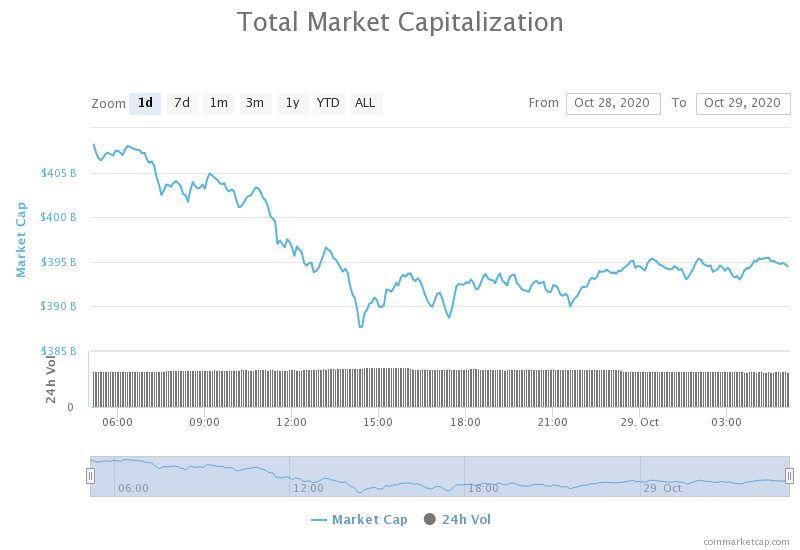
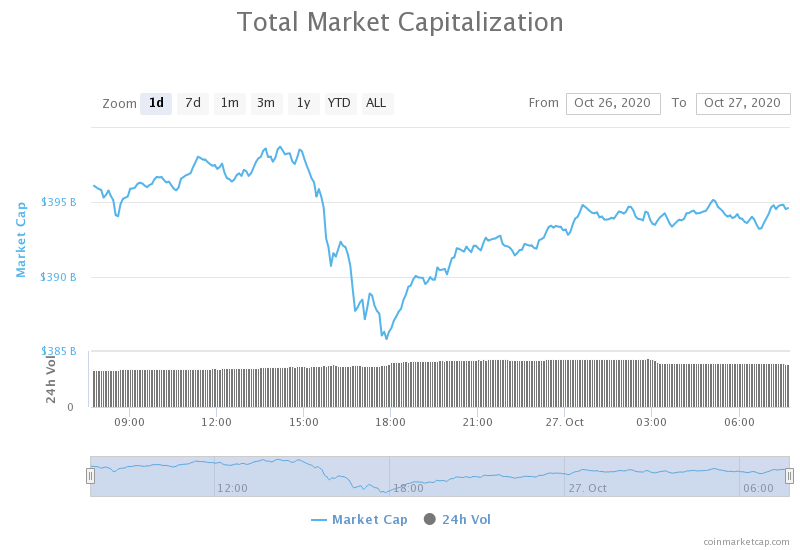
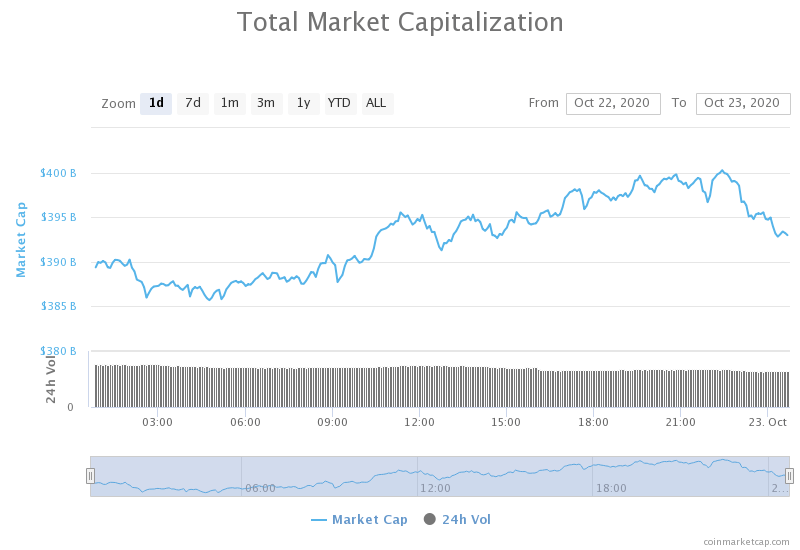
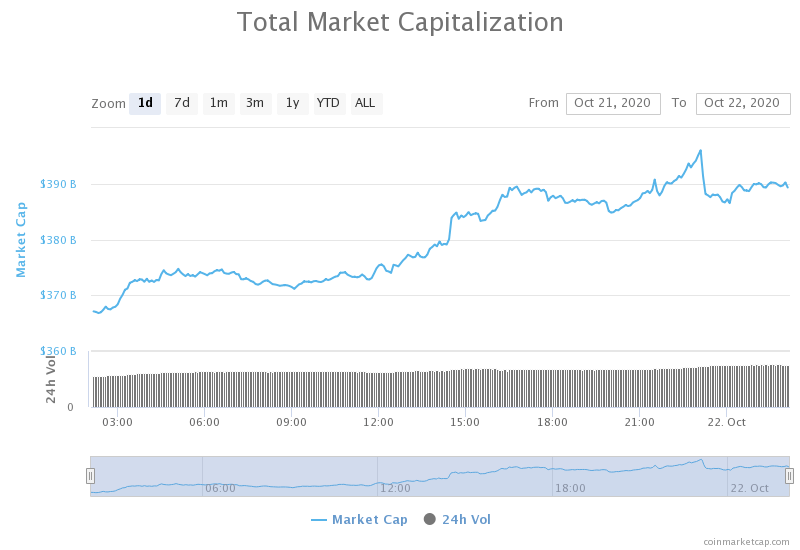
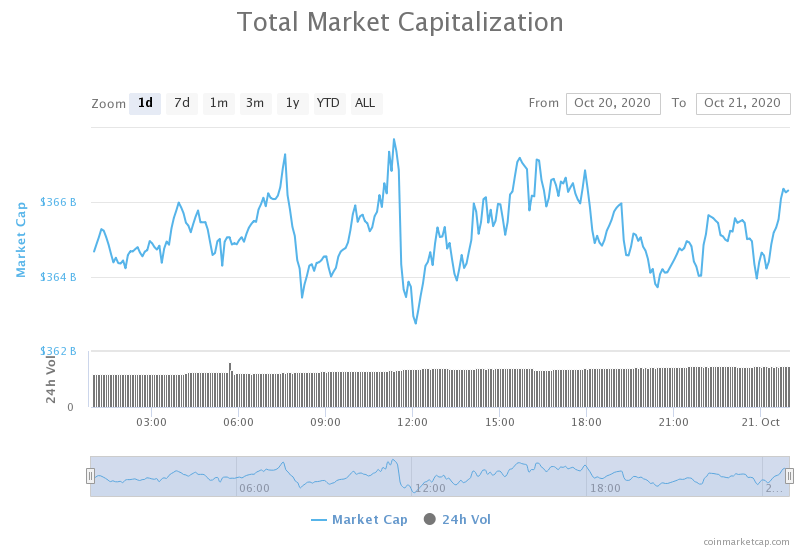
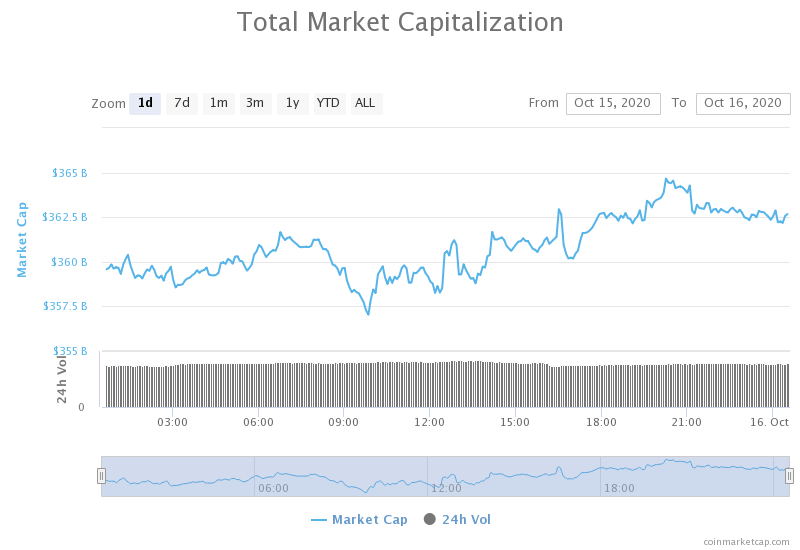
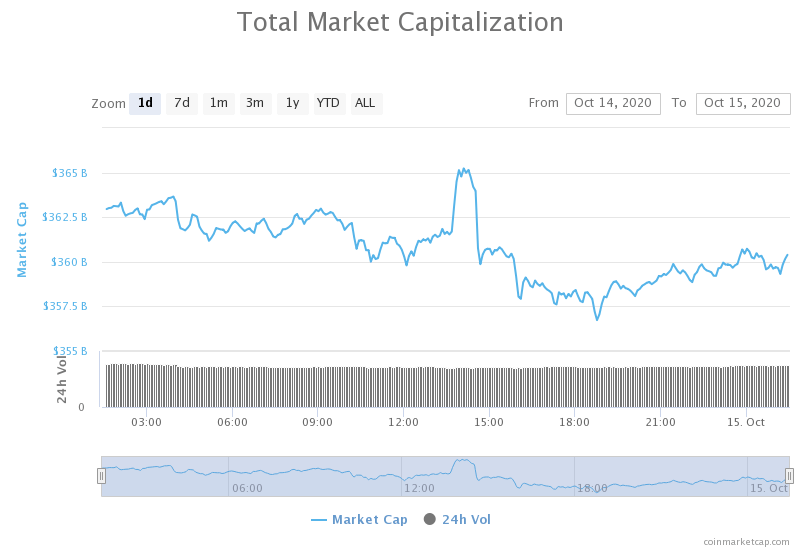
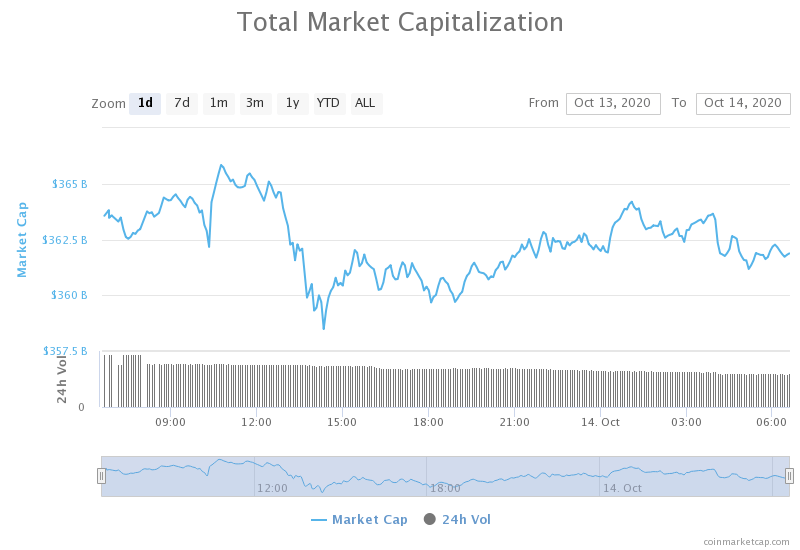
Daily Crypto Market Cap Chart
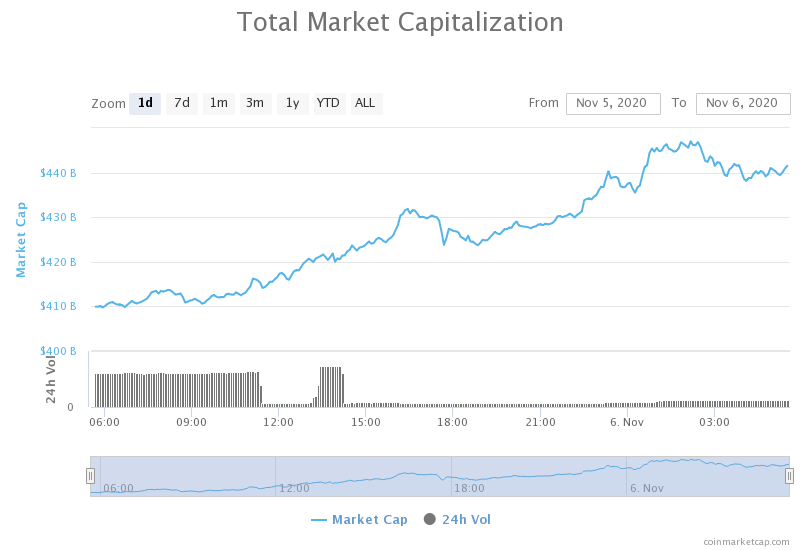
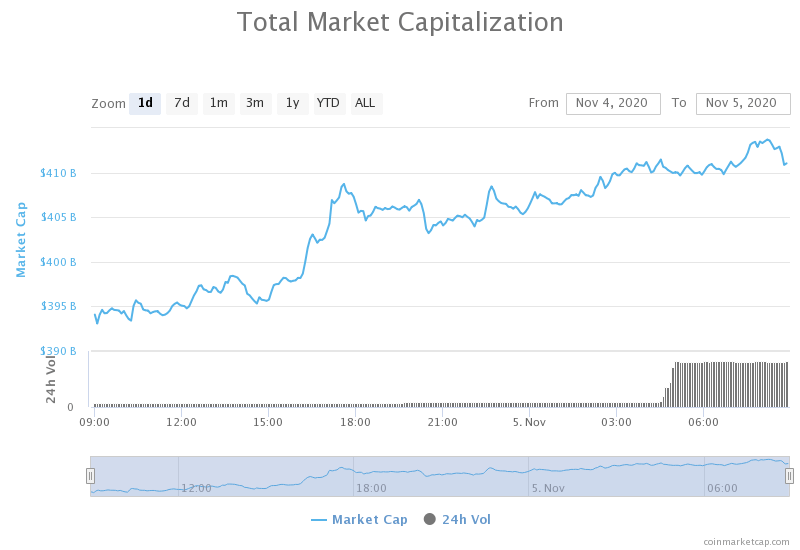
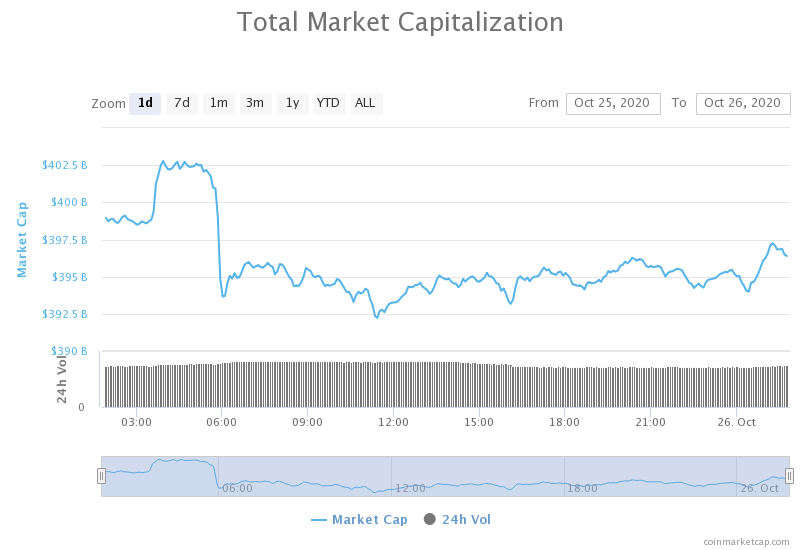
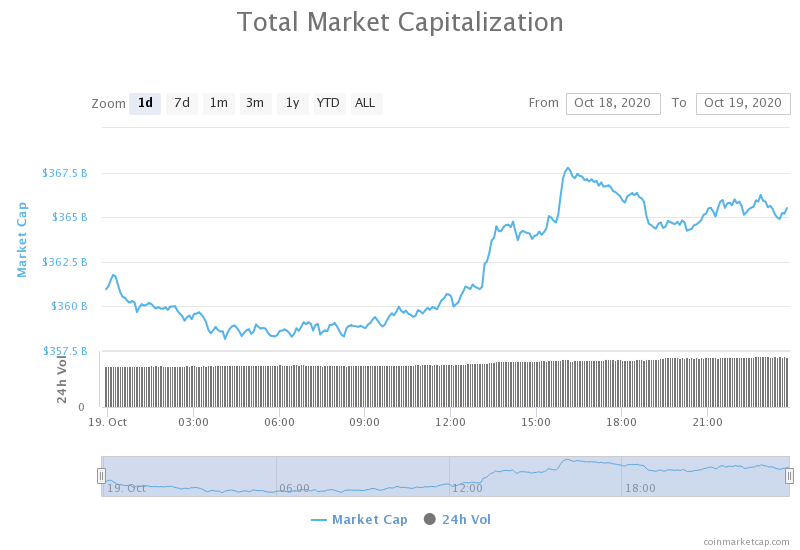
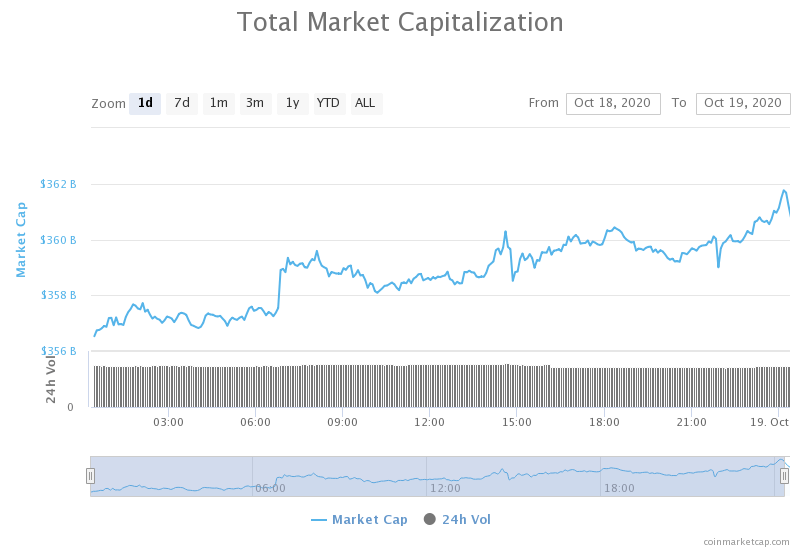
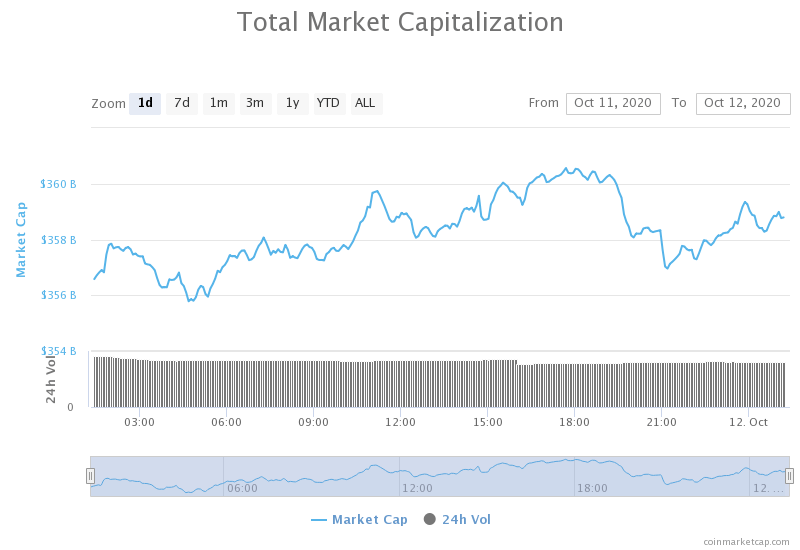
The crypto sector capitalization has gone up over the course of the day. Its current value is $454.16 billion, representing an $8.04 billion increase compared to our previous report.
_______________________________________________________________________
What happened in the past 24 hours?
_______________________________________________________________________
- Ethereum accidentally “hard forks” after Infura outage (Cryptoslate)
- Infura Outage Sparks Debate Over Ethereum’s Decentralization (Cryptobriefing)
- Behind the Shroud of Cred’s Tragic Bankruptcy (Cryptobriefing)
- BlockFi plots retail launches in Europe — but not the UK (The Block)
- Bridgewater’s Ray Dalio says bitcoin isn’t poised for the success its adopters hope (The Block)
- Ahead of Eth2 launch, a new lending initiative allows validators to borrow against their staked ETH (The Block)
- MakerDAO’s DAI Stablecoin Breaks $1B Market Cap (Coindesk)
- Institutional money is pumping the DeFi markets back up (Cointelegraph)
- 100 billion reasons Apple should get behind Bitcoin: Michael Saylor (Cointelegraph)
- ‘Slippery slope’ as new Bitcoin mining pool censors transactions (Cointelegraph)
Ethereum had quite a bad day, as its consensus reached an unexpected hard fork. This issue is considered the one holding the most weight ever since the DAO debacle from 4 years ago. The developers are still looking into the issue, and things will be fully understood at a later date.
Ethereum essentially hard forked right when its developers introduced a new update to the chain, and those who haven’t upgraded yet (including Blockchair, Infura, and other miners) got stuck in a minority chain for around 30 blocks (2 hours).
_______________________________________________________________________
Technical analysis
_______________________________________________________________________
Bitcoin
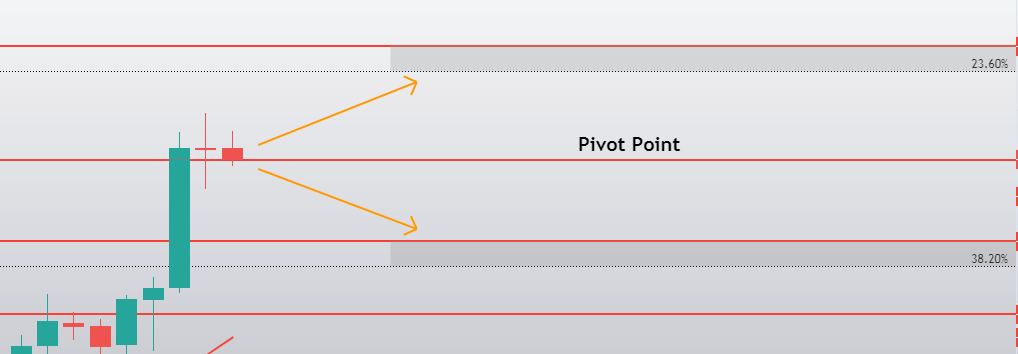
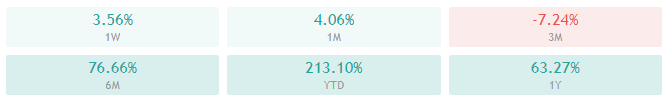
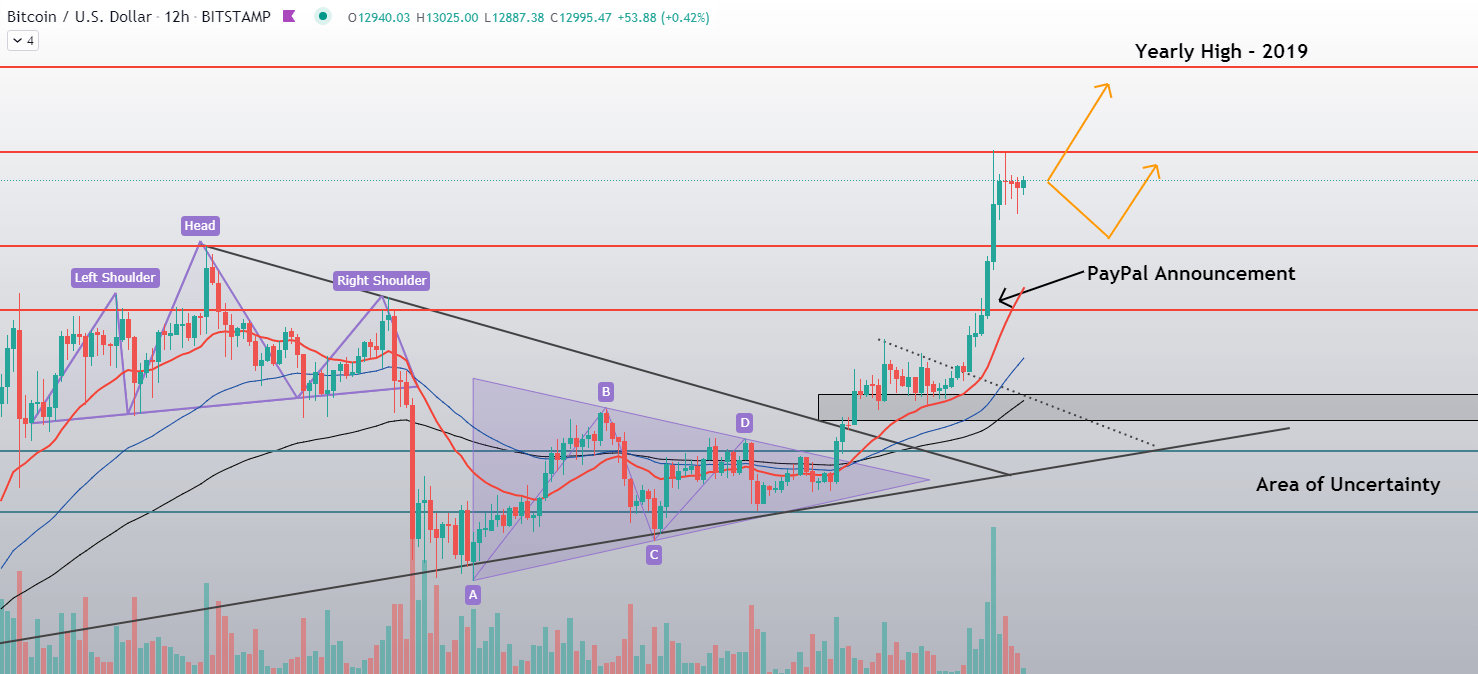
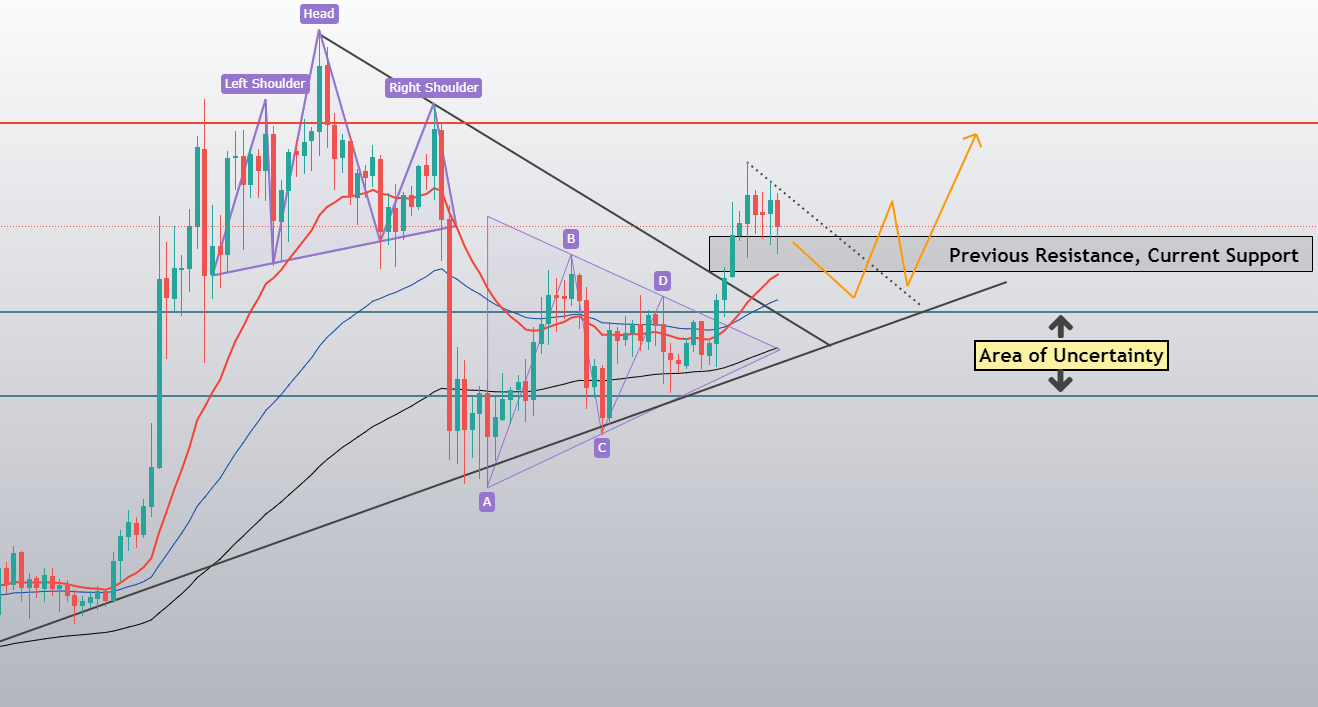
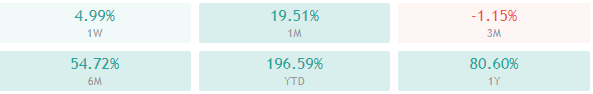
The largest cryptocurrency by market capitalization has pushed towards the upside, reaching as far as $15,990 but not being able to break the $16,000 mark. This failure to break its immediate resistance level has caused another (third) top to form, marking a possible short-term trend reversal as a possibility if Bitcoin doesn’t move up quickly.
Traders should trade carefully around this level and be prepared to trade the pullback or the spike. While these “, ride the trend” trades are hard to predict in terms of when they start, they are easy to trade once the entry happens.
BTC/USD 4-hour Chart
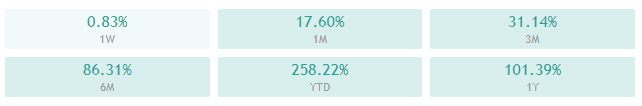
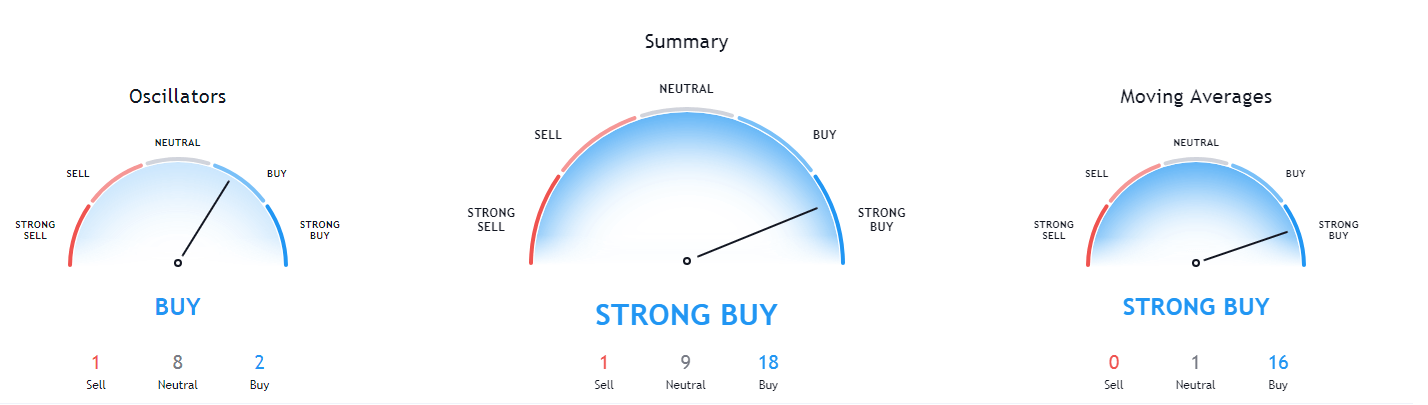
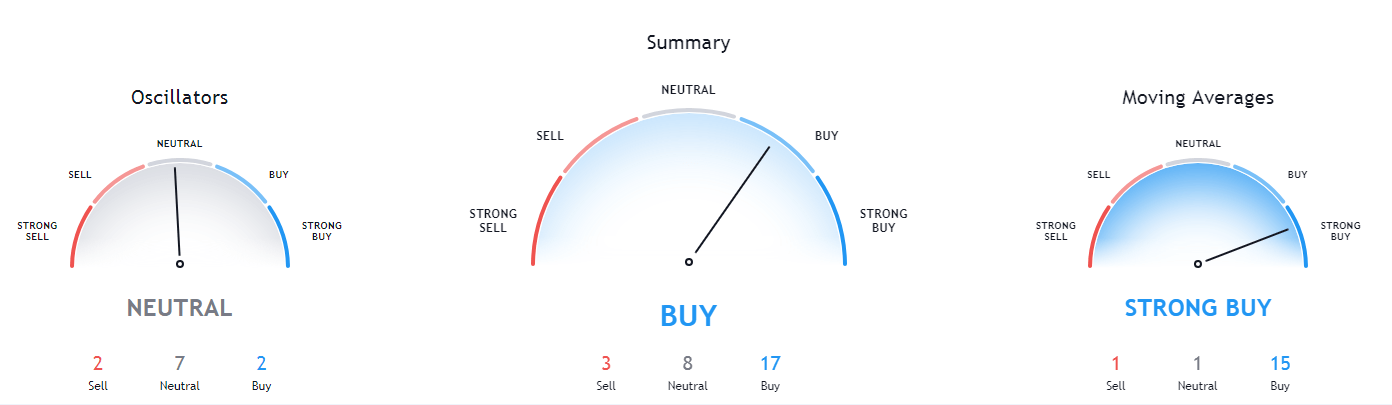
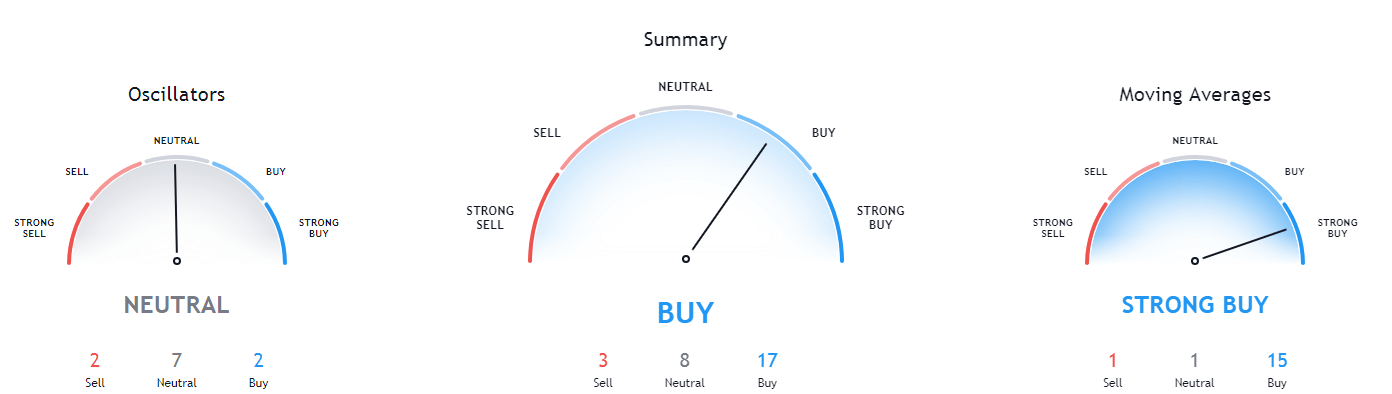
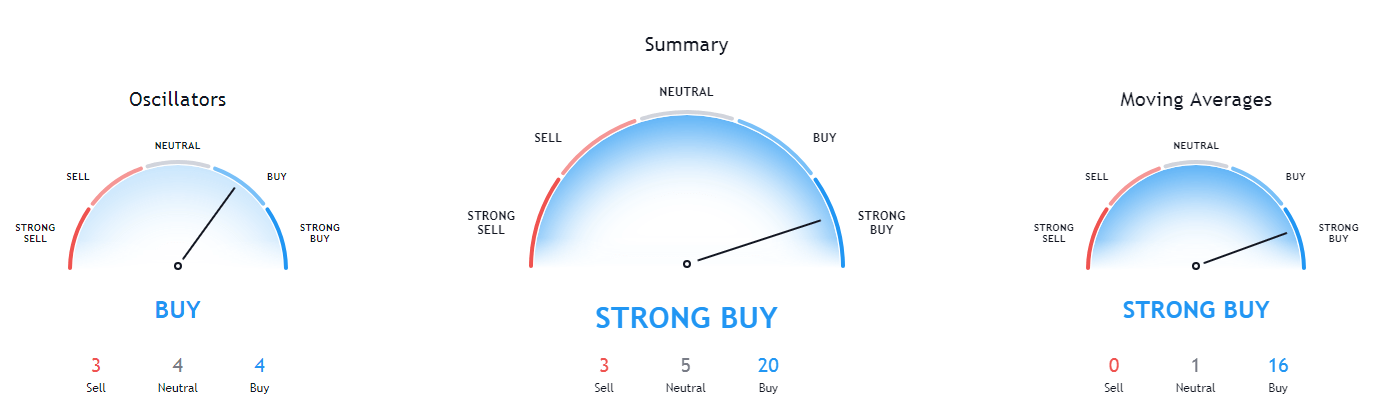
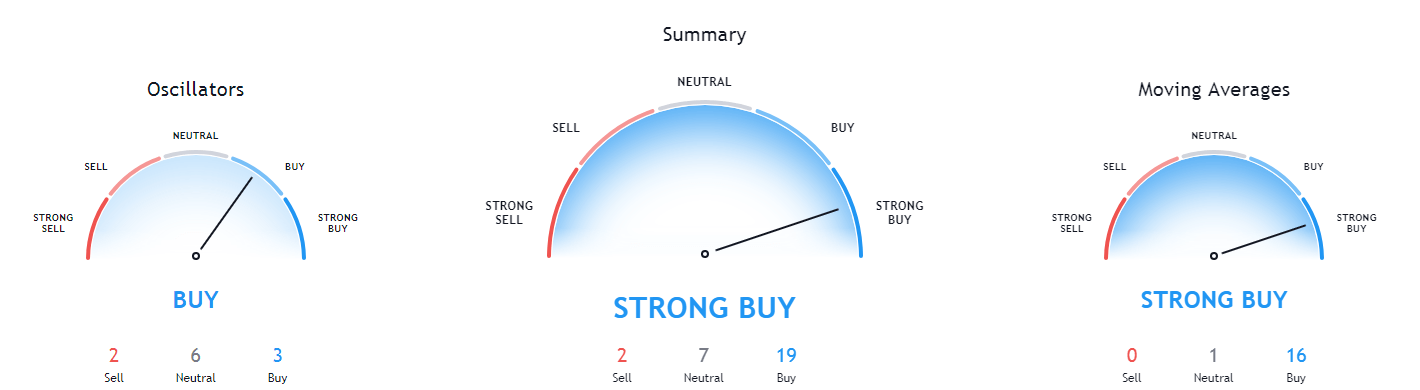
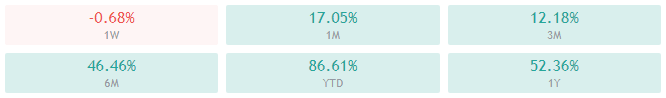
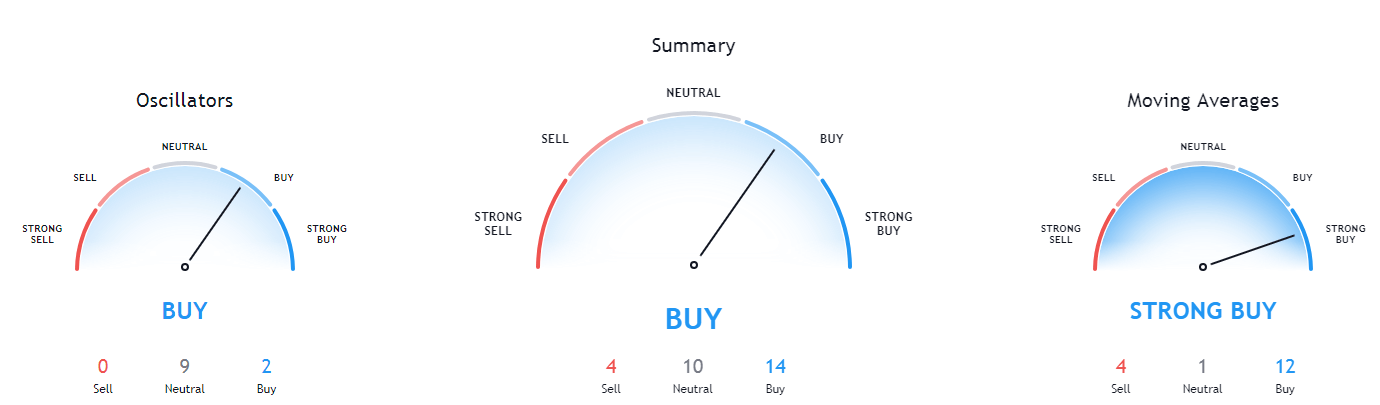
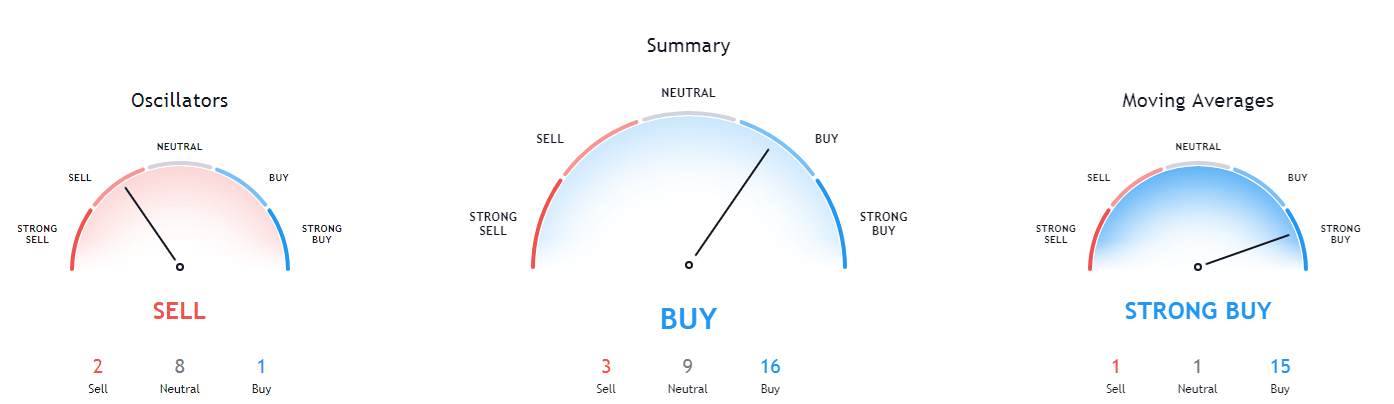
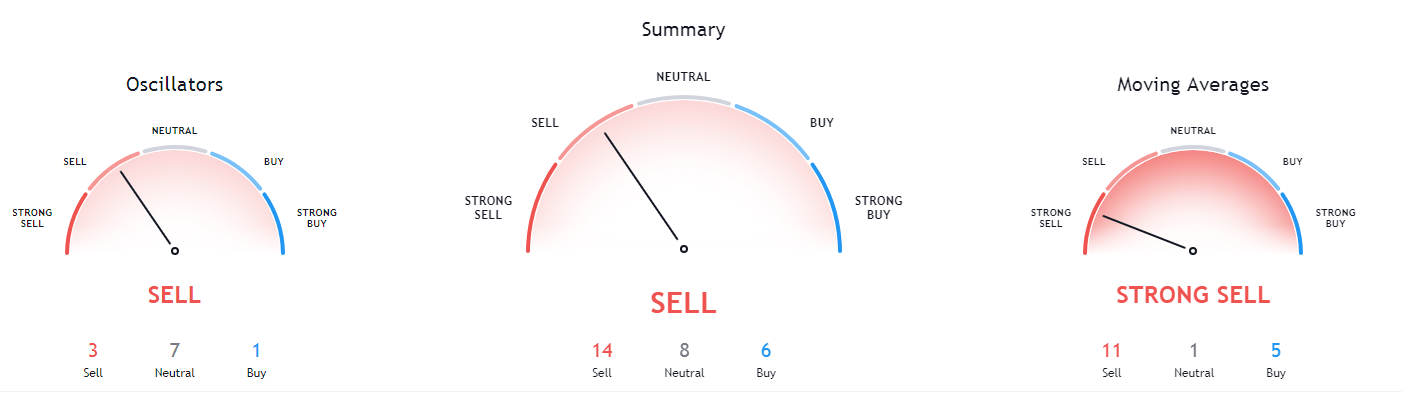
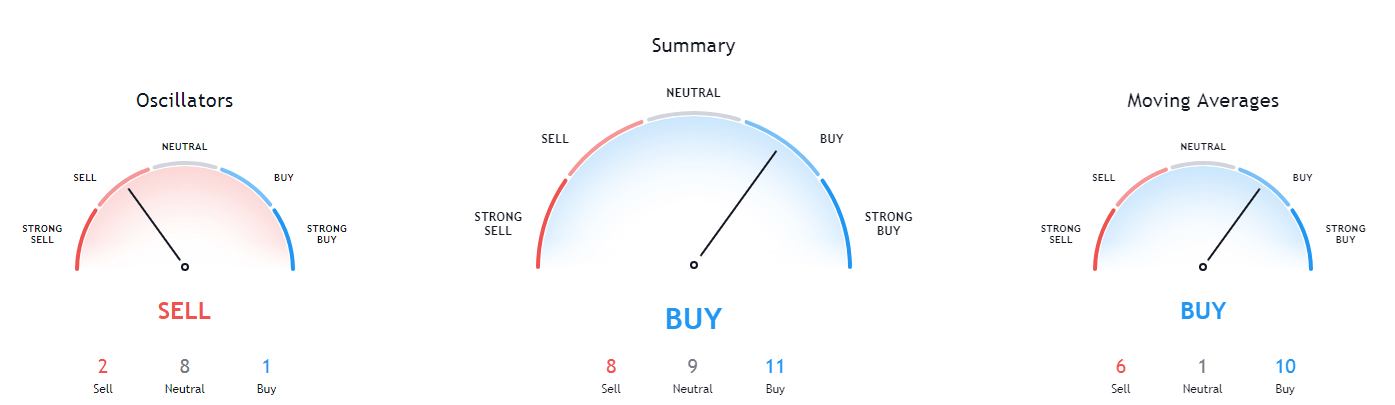
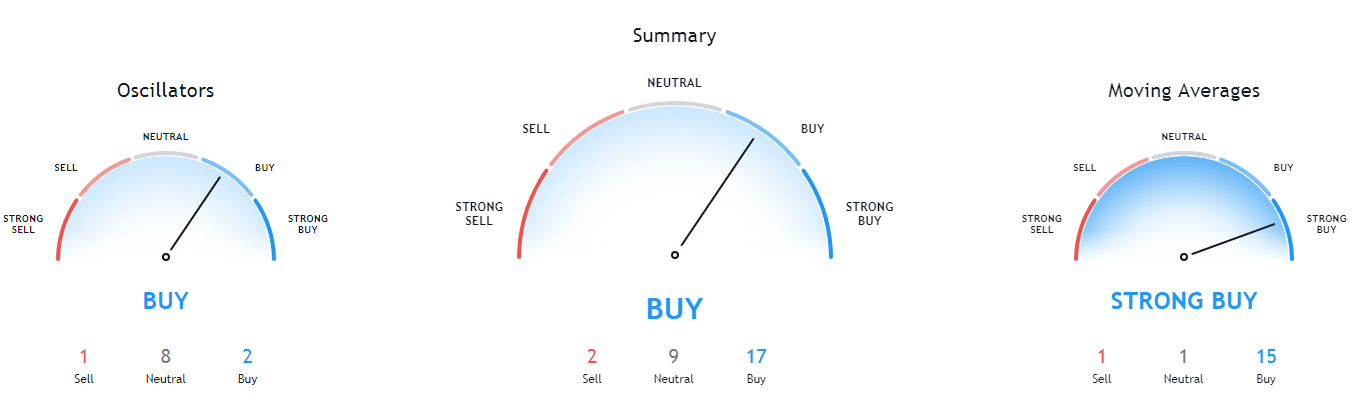
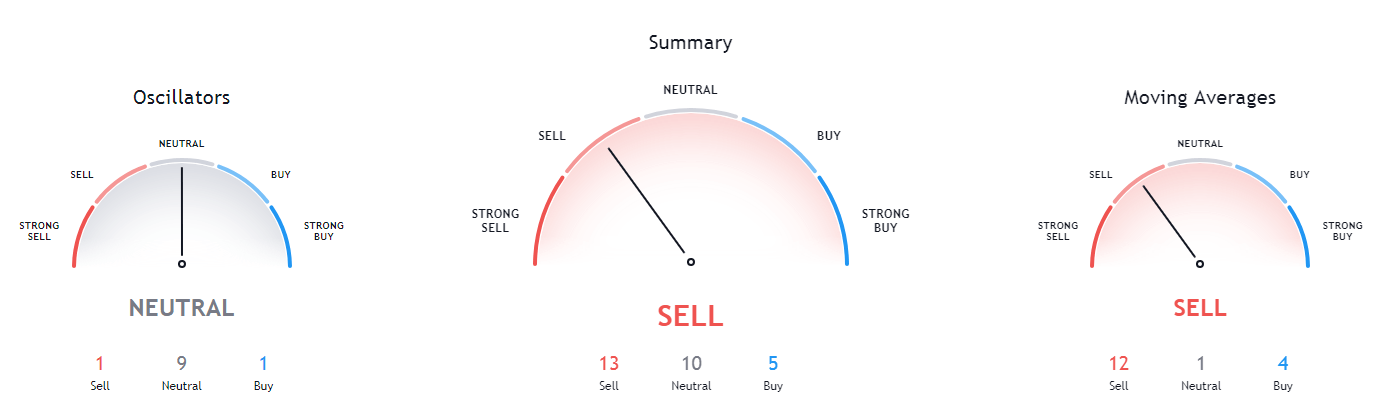
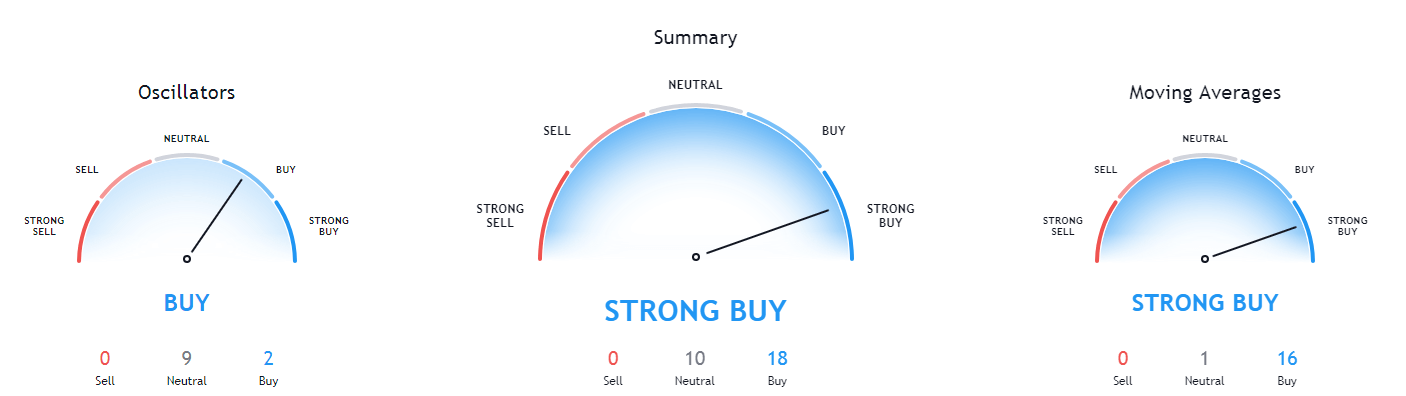
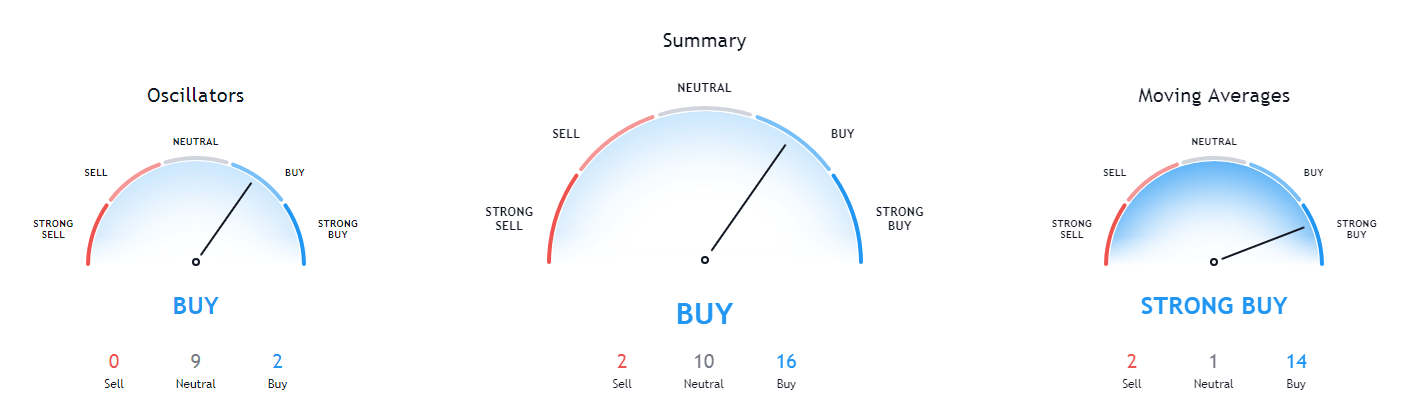
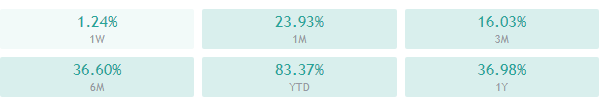
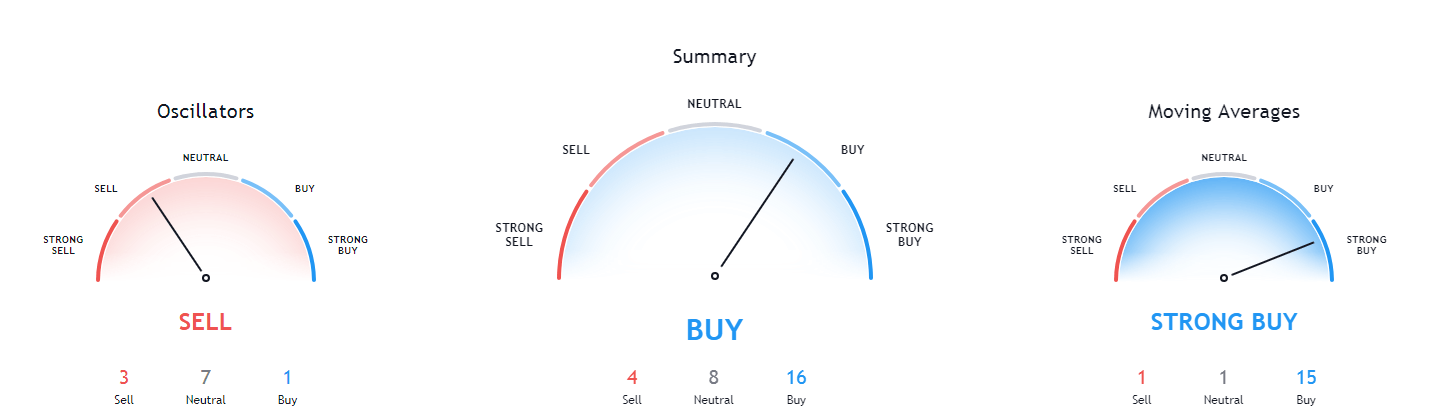
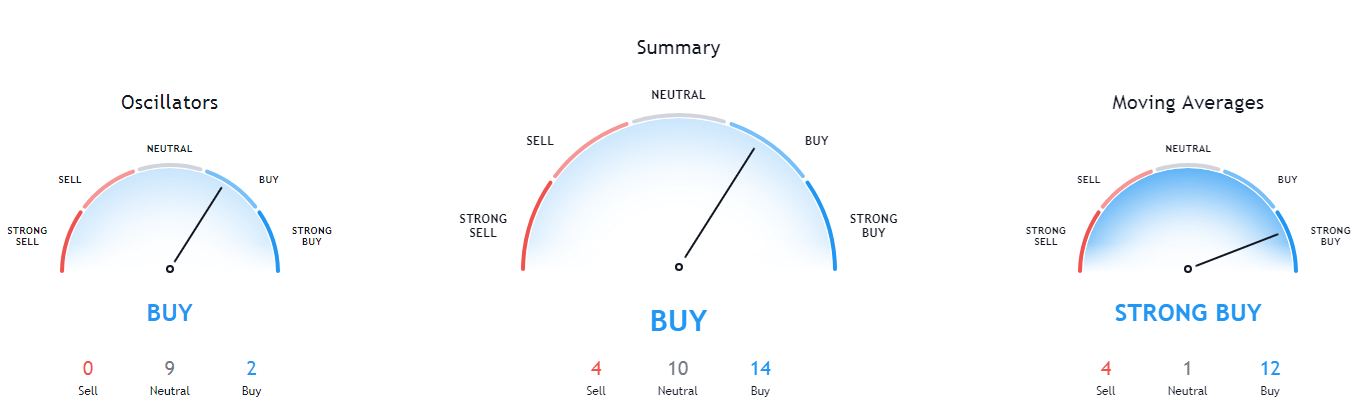
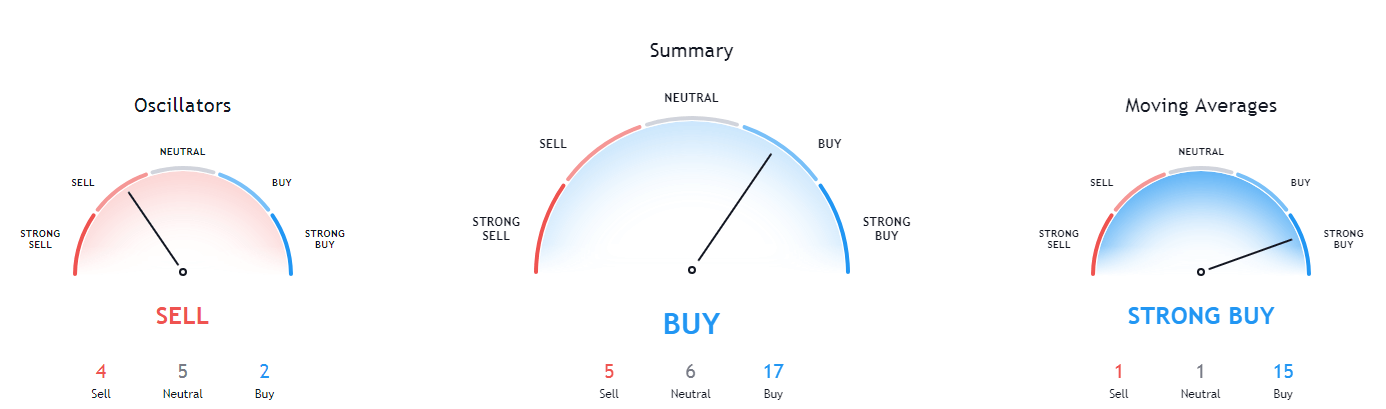
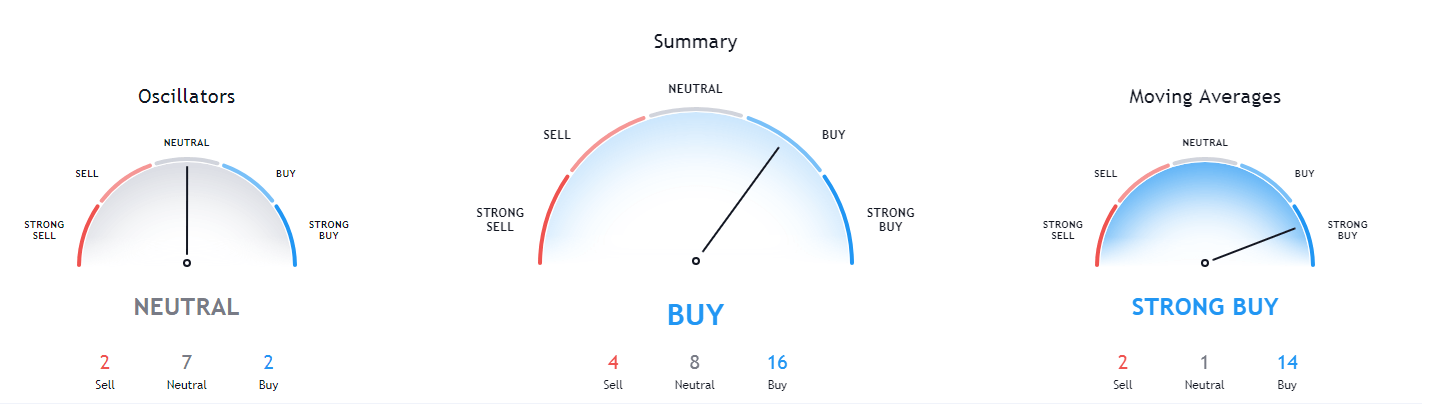
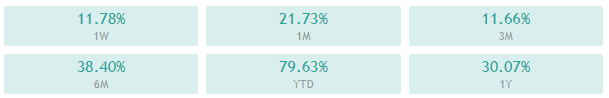
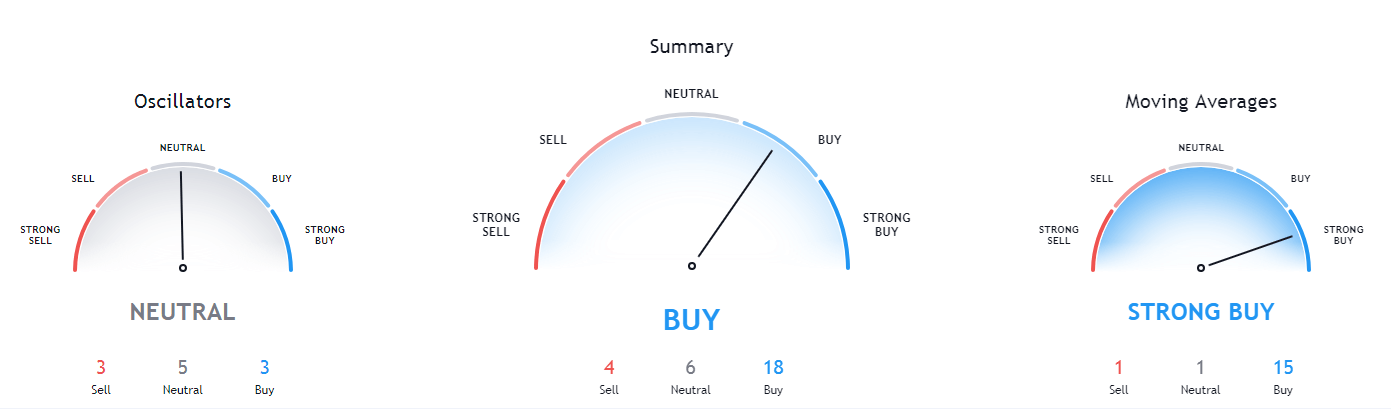
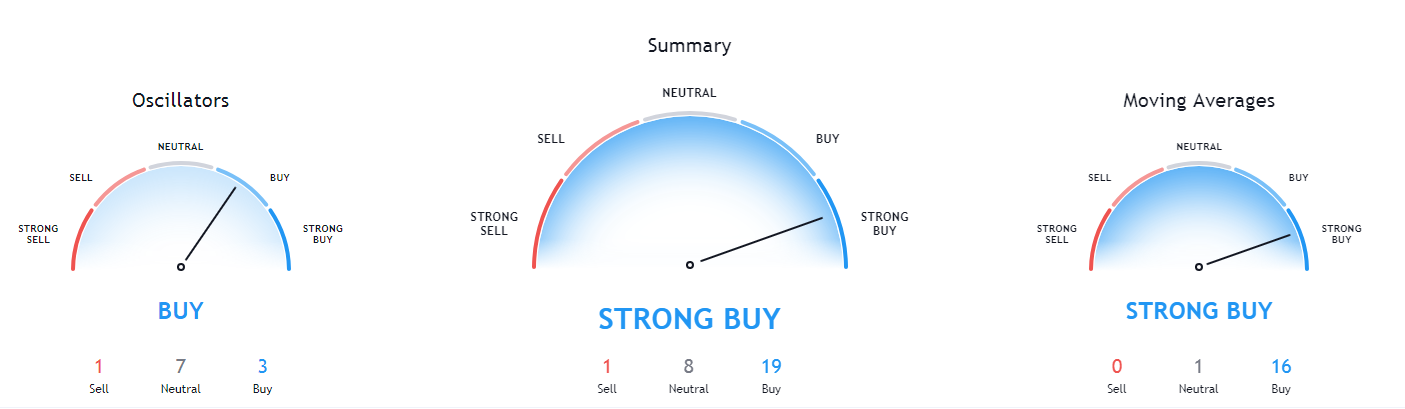
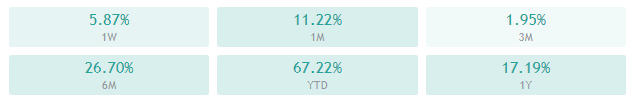
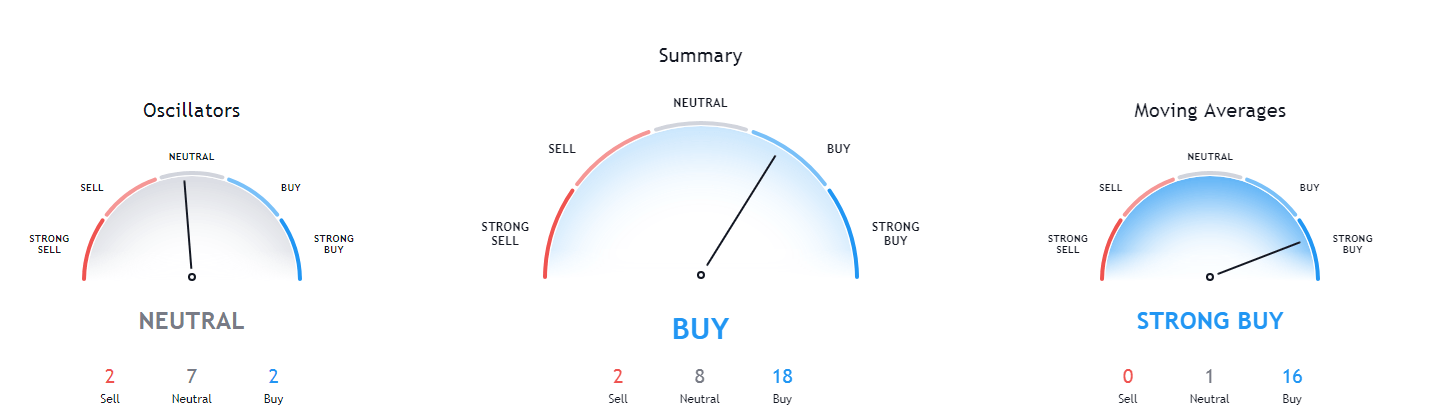
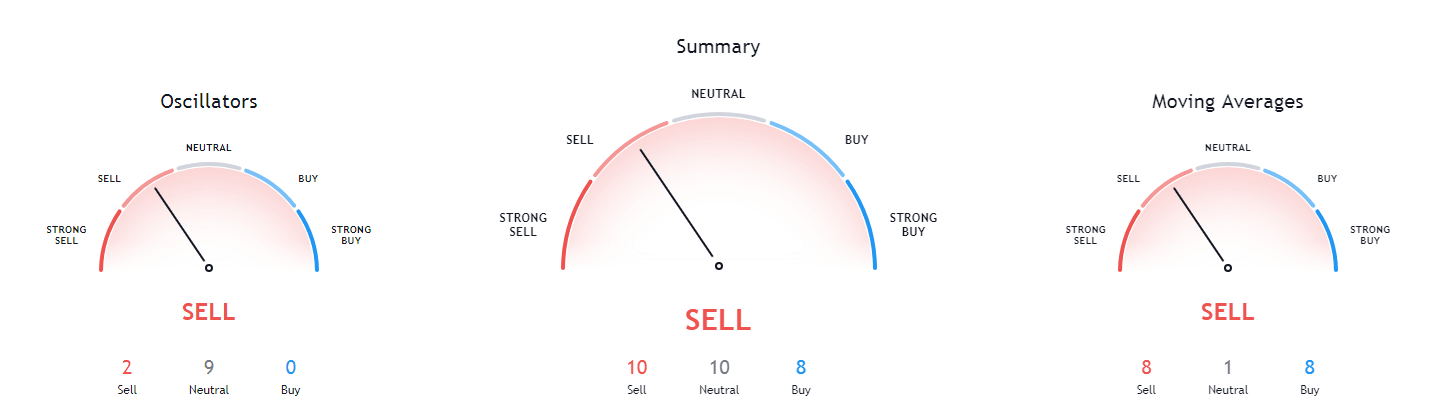
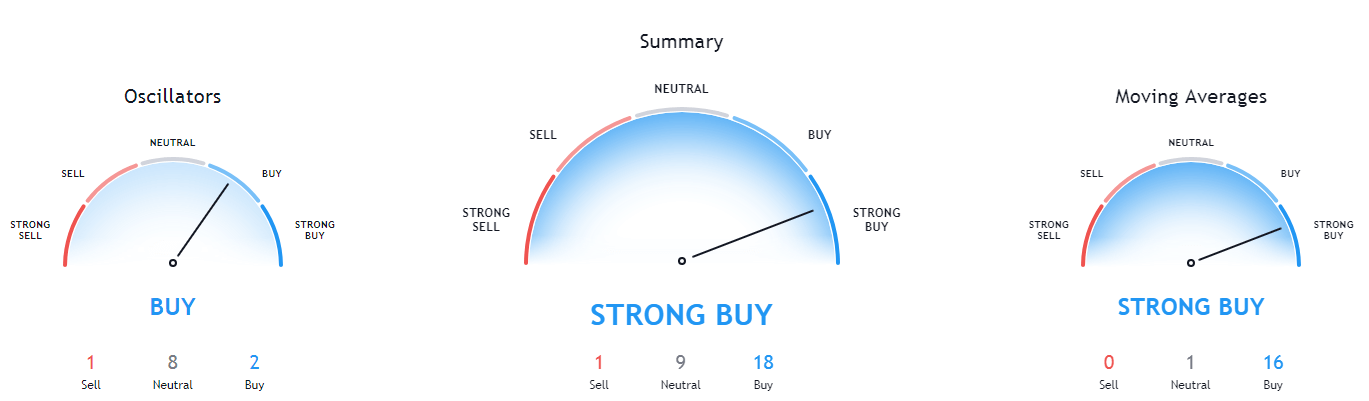
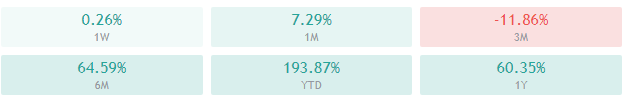
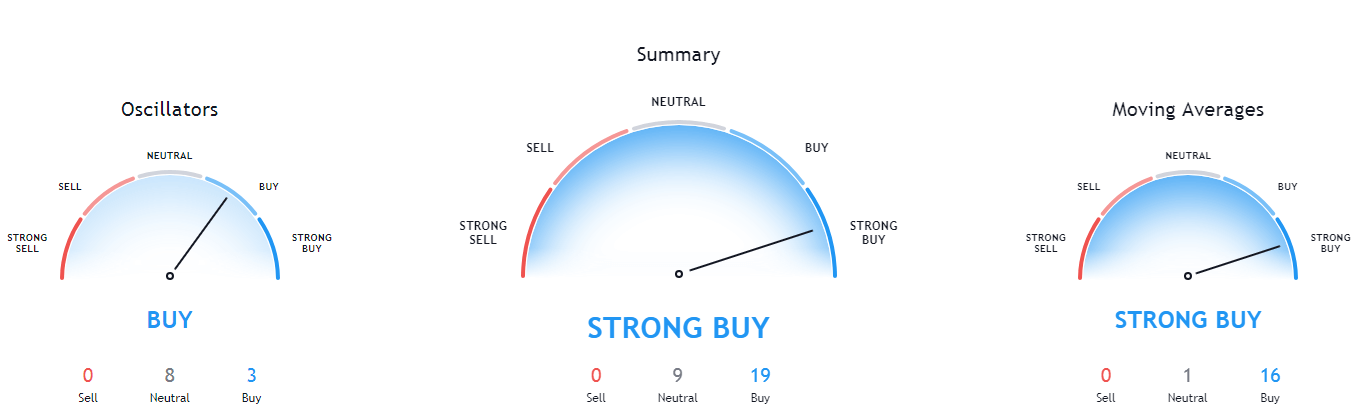
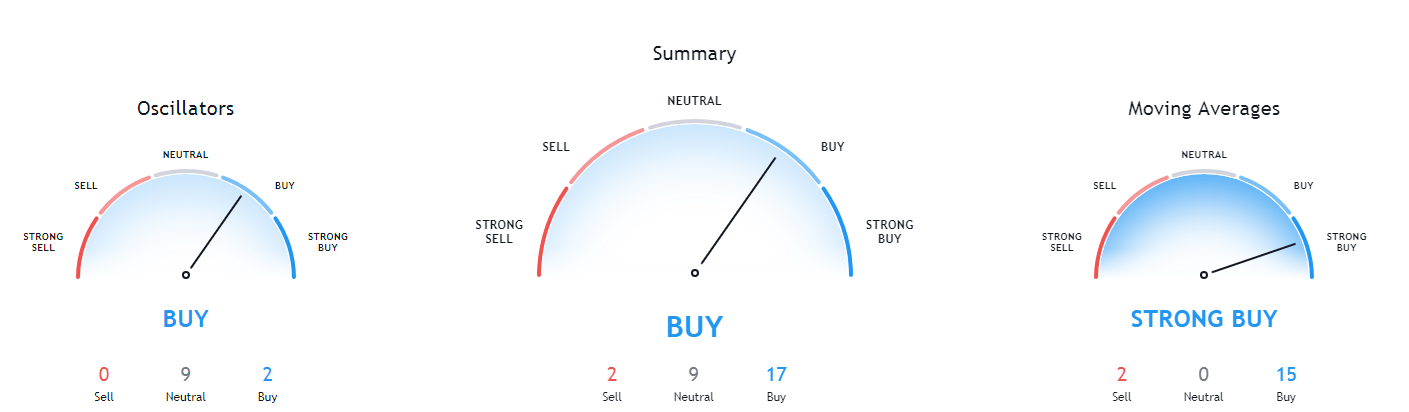
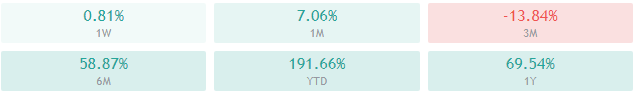
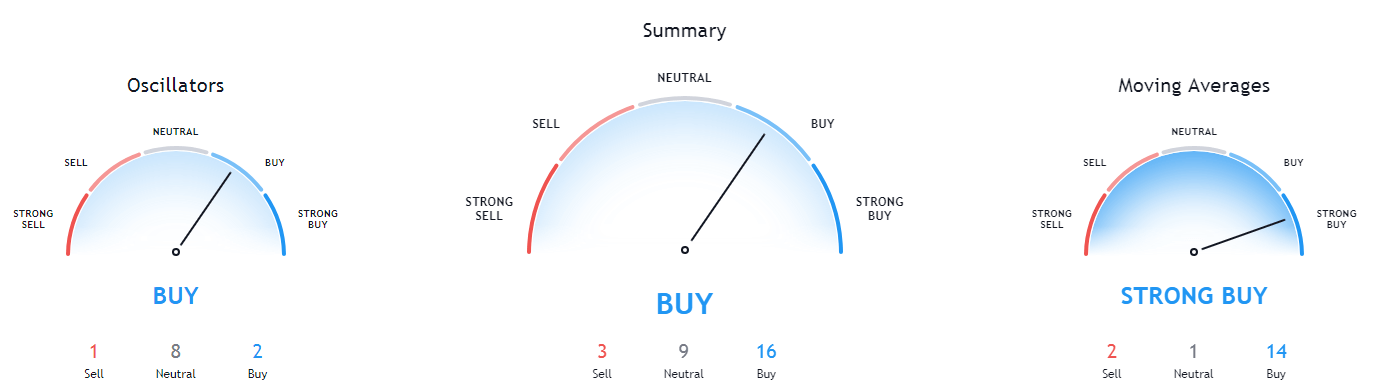
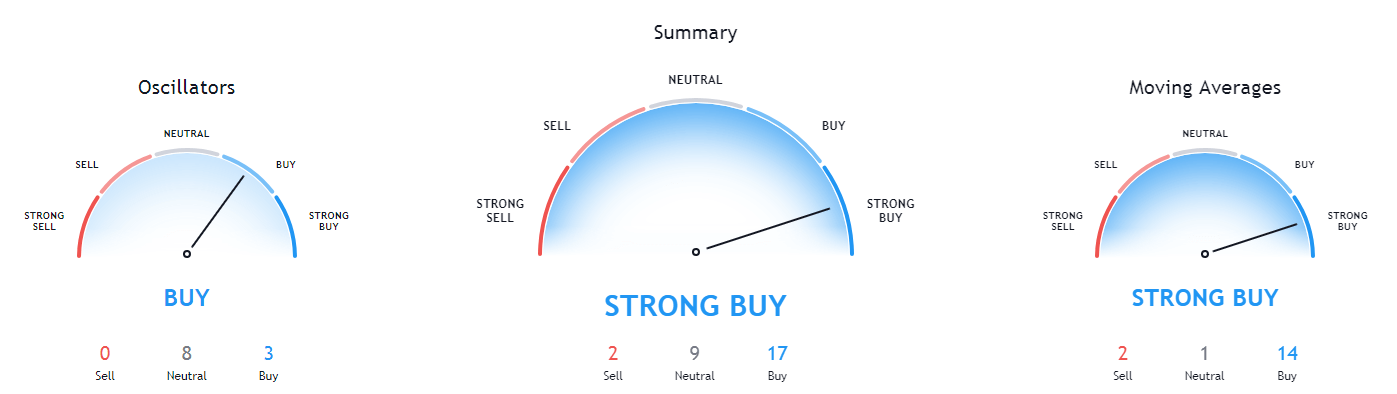
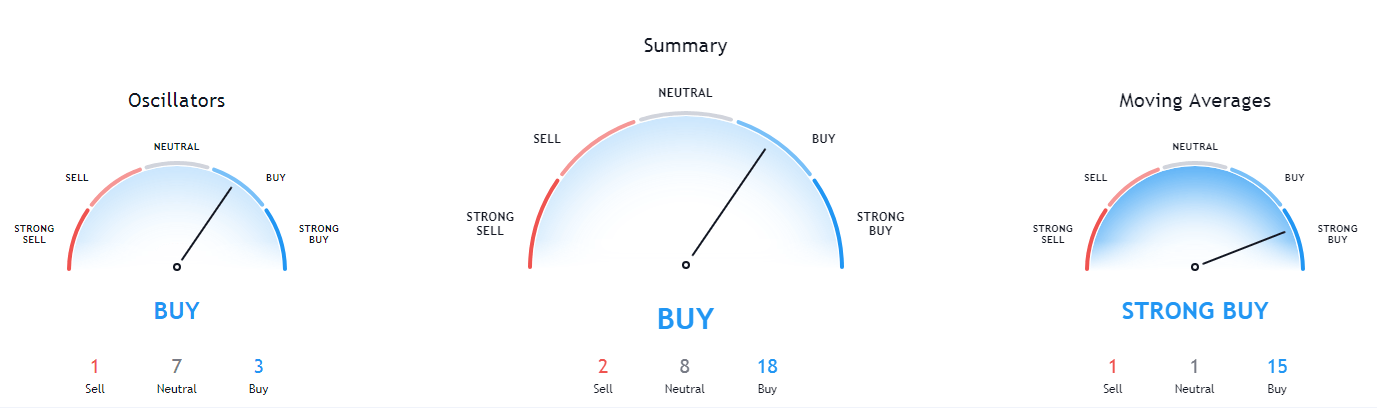
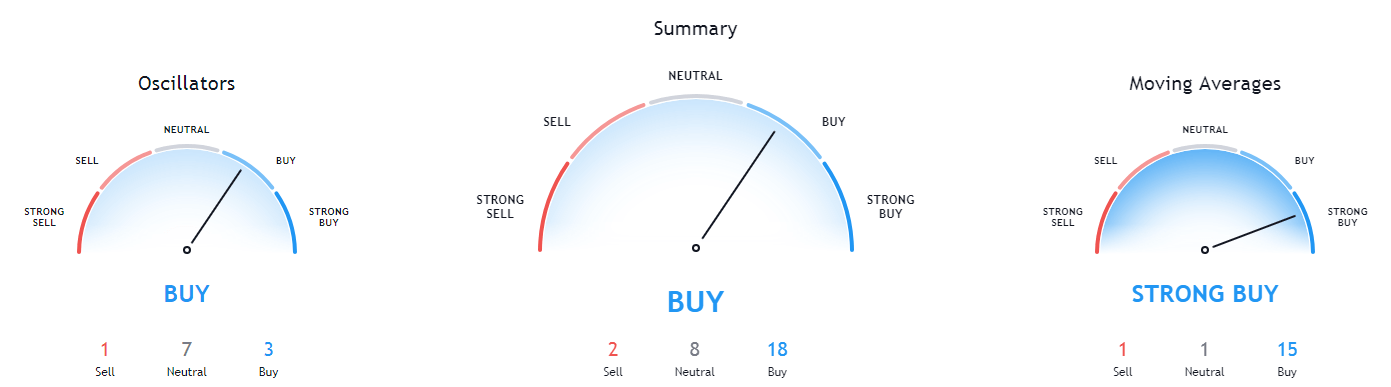
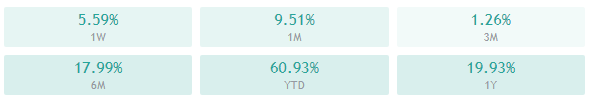
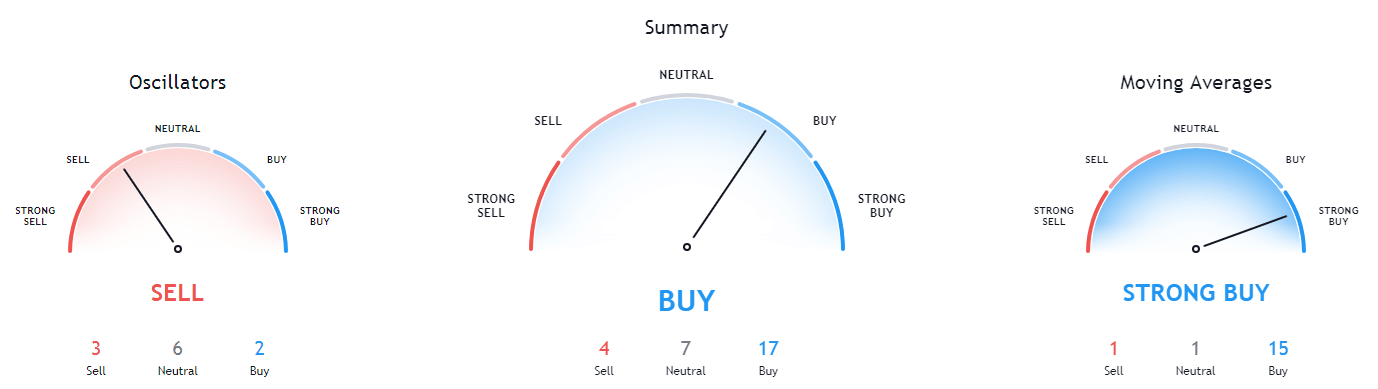
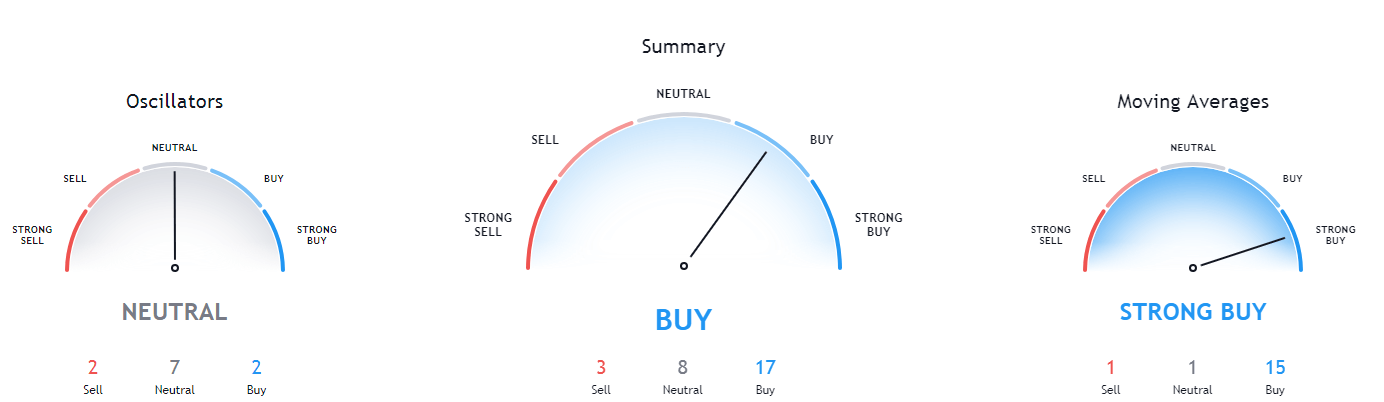
Bitcoin’s technicals are bullish on all time-frames. However, its 4-hour and monthly time-frames are completely bullish, while its daily and weekly overviews are showing signs of neutrality or even slight bear presence.

BTC/USD 1-day Technicals
Technical factors (4-hour Chart):
- Price is above its 50-period EMA and slightly above its 21-period EMA
- Price is slightly above its middle Bollinger band
- RSI is near the overbought territory (64.15)
- Volume is slightly above average
Key levels to the upside Key levels to the downside
1: $16,000 1: $15,480
2: $16,400 2: $14,640
3: $16,700 3: $14,100
Ethereum
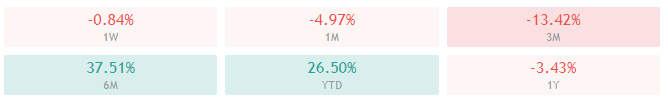
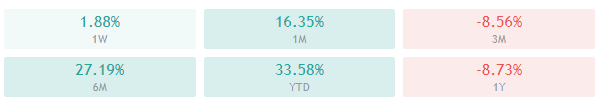
Ethereum has stayed above the top line of its ascending channel but could not break the resistance zone above $470. However, its price didn’t react negatively to the news of the algorithm failure and an unplanned mini hard fork, which is quite a bullish outcome of events.
Ethereum traders should watch out for how the second-largest cryptocurrency by market cap navigates the range between the top line of the ascending channel and its $470 resistance level.
ETH/USD 4-hour Chart
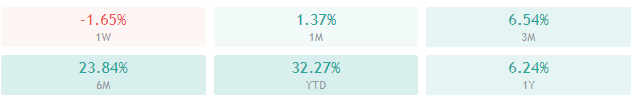
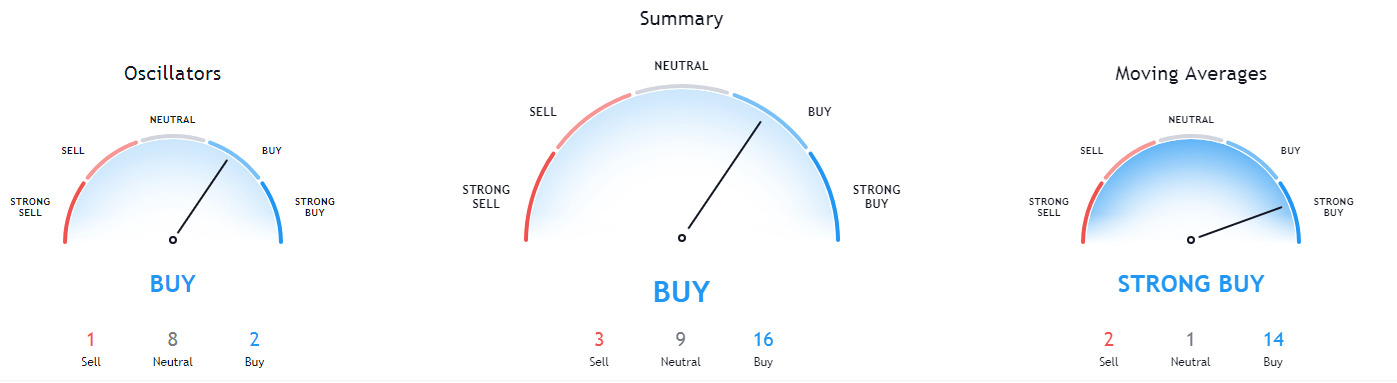
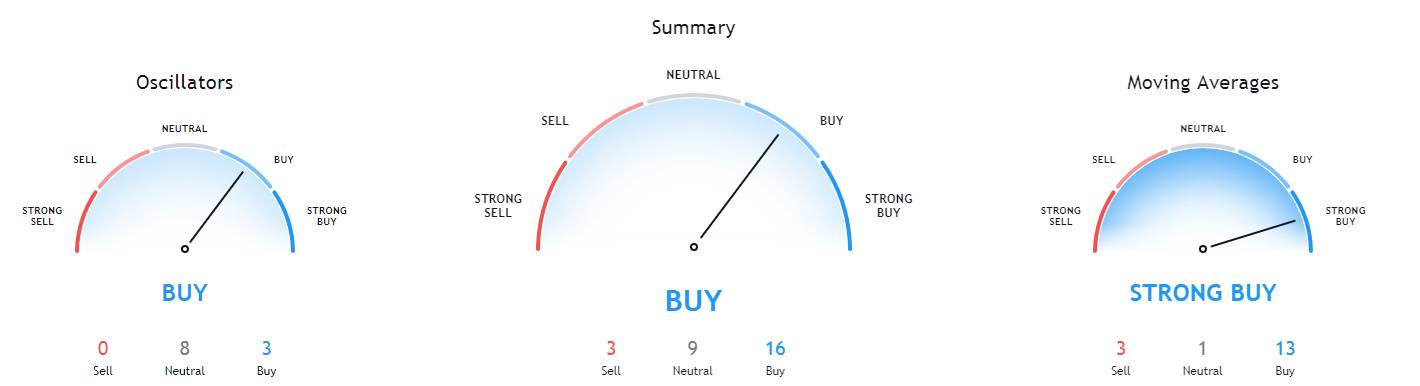
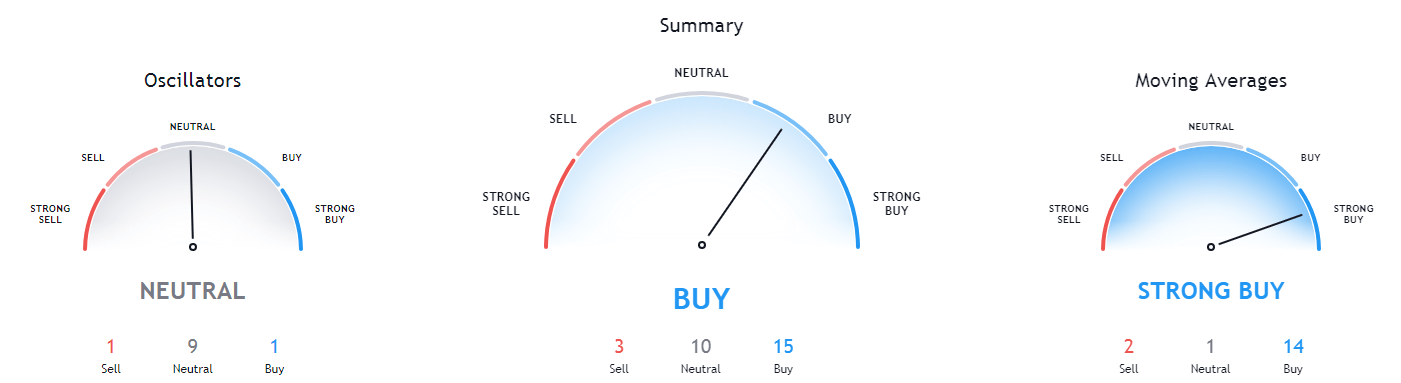
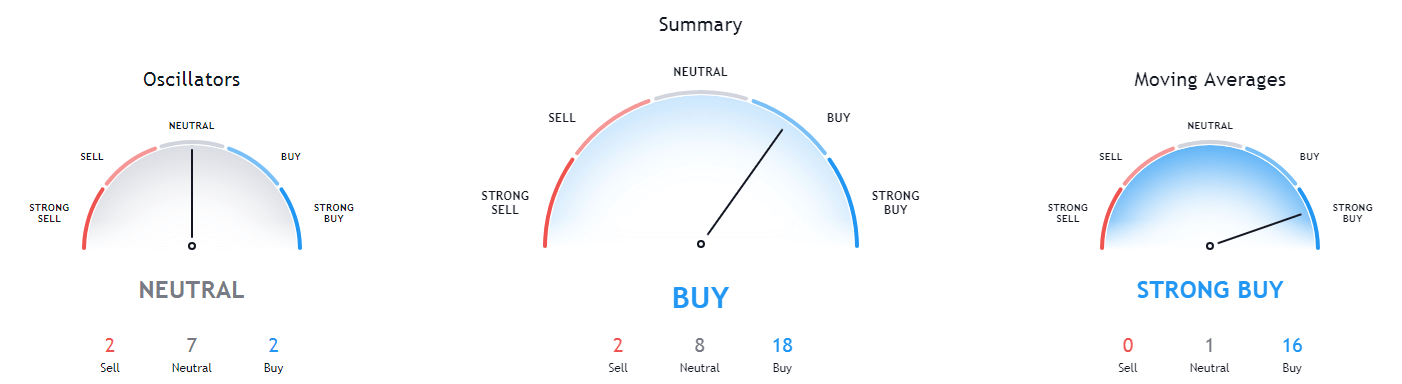
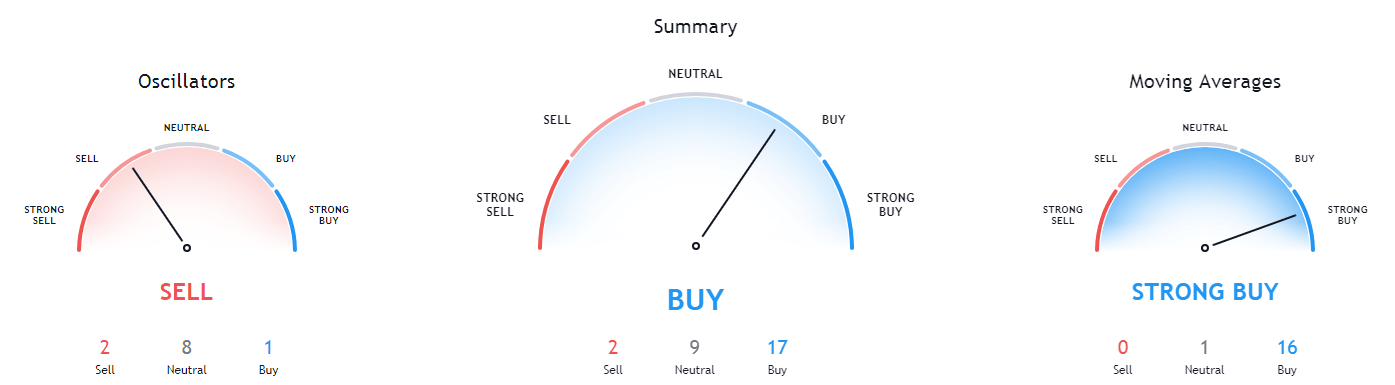
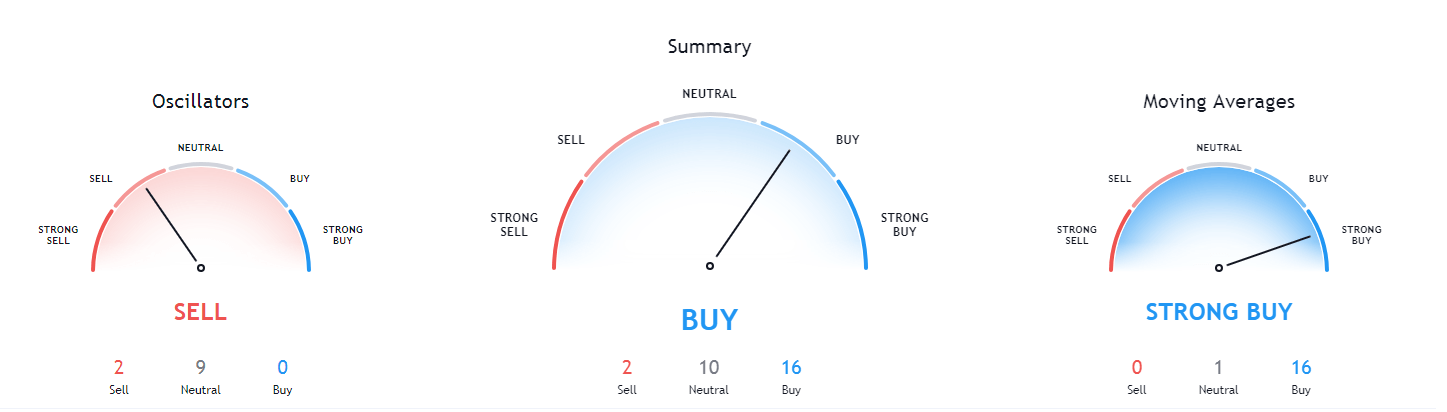
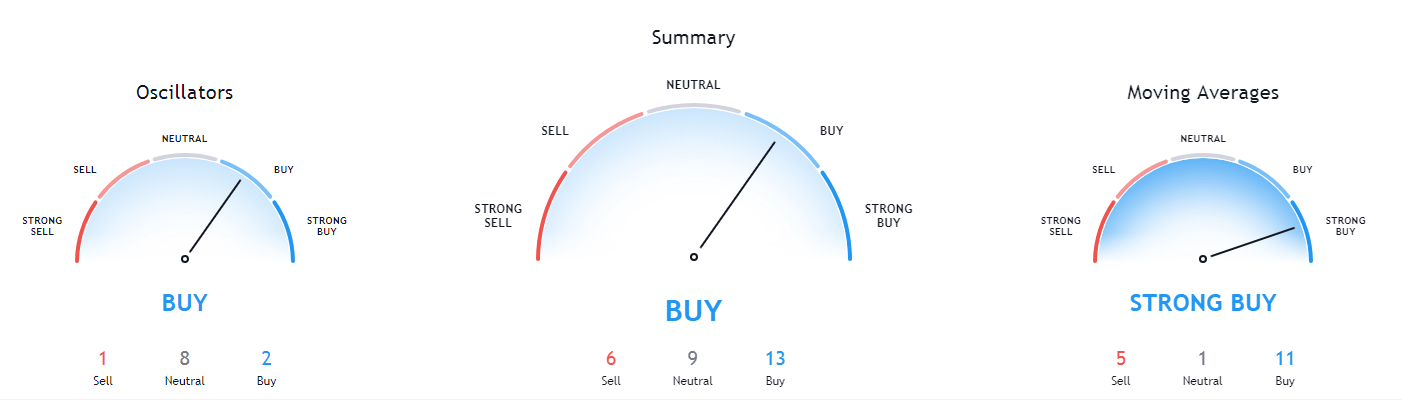
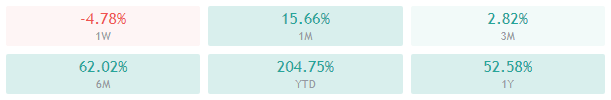
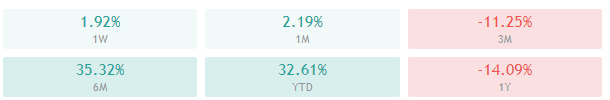
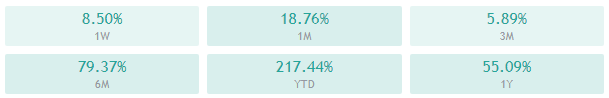
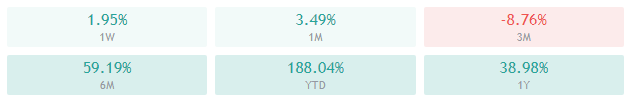
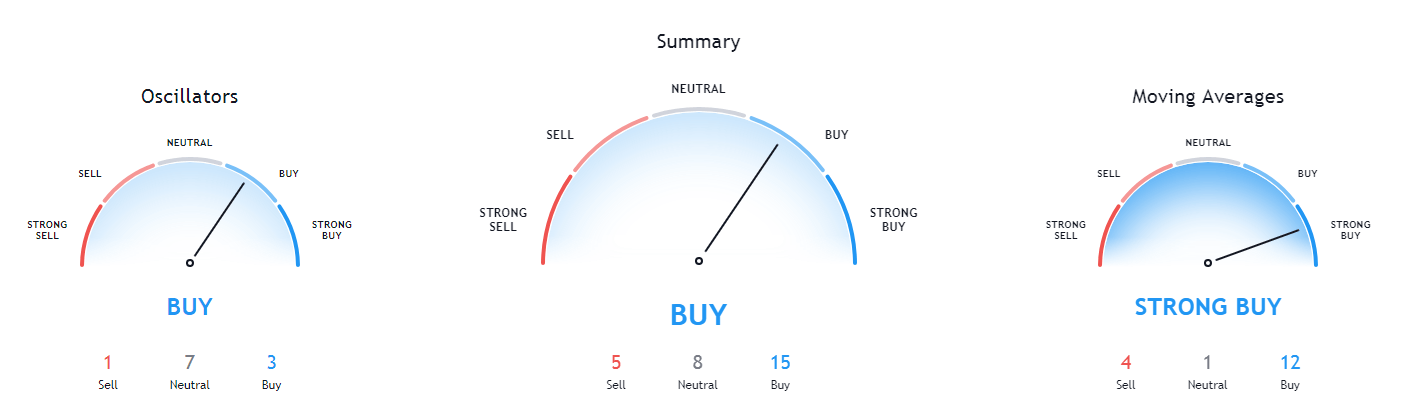
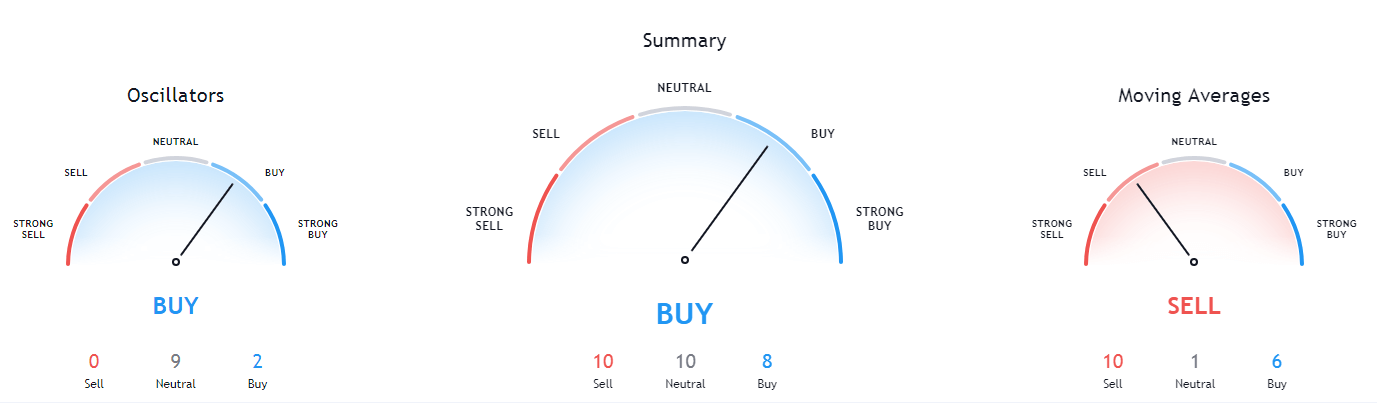
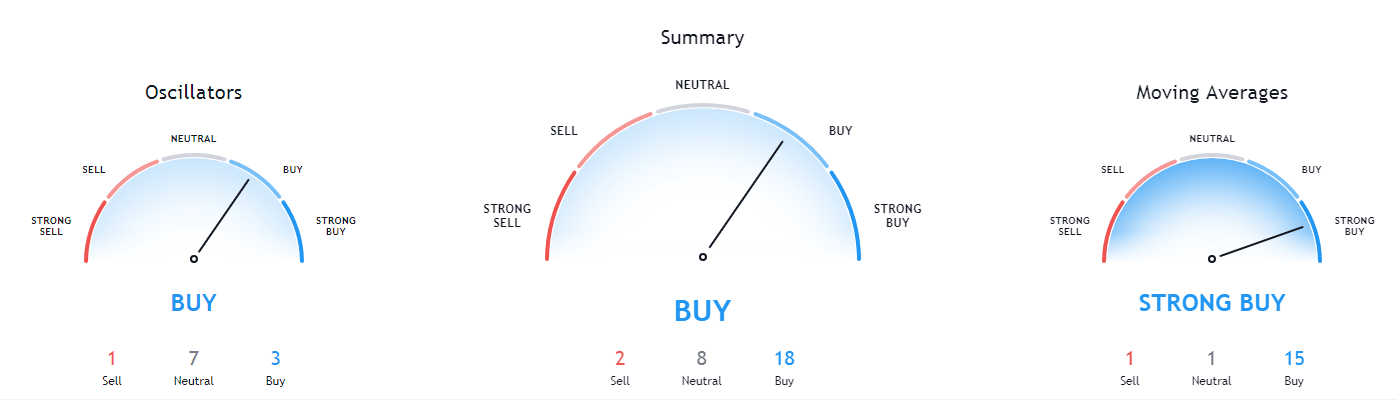
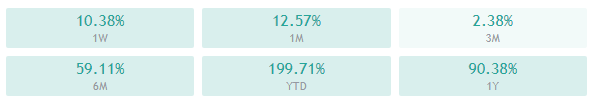
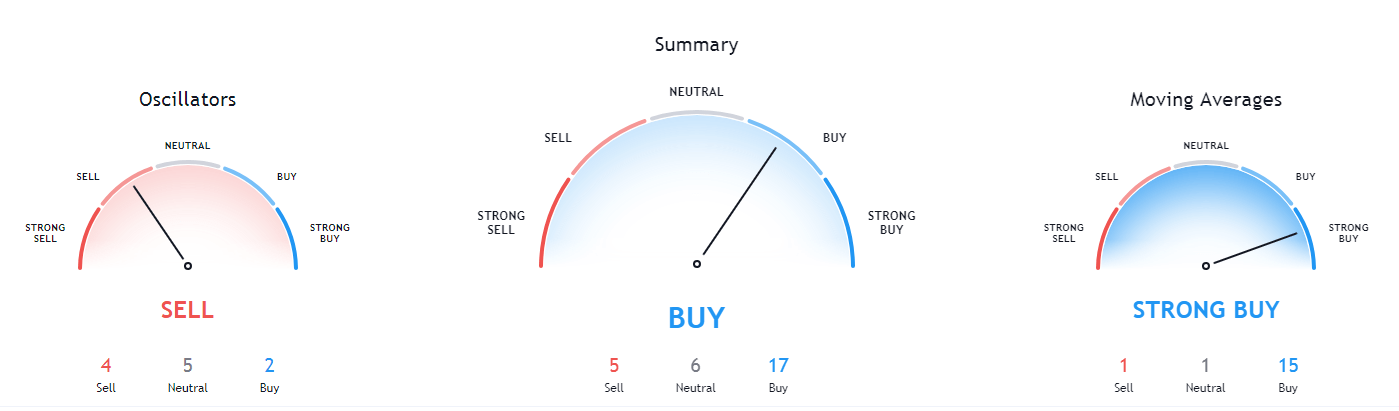
Ethereum’s technicals are bullish on all time-frames, with its 4-hour and monthly time-frames being completely bullish and its daily and weekly overviews showing signs of neutrality or even slight bear presence.

ETH/USD 1-day Technicals
Technical Factors (4-hour Chart):
- The price is above its 50-period and slightly above its 21-period EMA
- Price is above its middle Bollinger band
- RSI is neutral (60.34)
- Volume is average
Key levels to the upside Key levels to the downside
1: $470 1: $451
2: $490 2: $445
3: $500 3: $420
Ripple

The fourth-largest cryptocurrency by market cap has suffered a minor pullback after failing to break its immediate resistance level ($0.26). XRP is still trading within a range bound by $0.2454 to the downside and $0.26 to the upside, while its range is even more narrow lately, as its price is hovering only the top portion of the range.
Traders still have the opportunity to trade XRP’s sideways action without much risk. On the other hand, if the volume does increase drastically, a move towards the upside is much more likely, unless Bitcoin’s potential move down brings every other crypto down with it.
XRP/USD 4-hour Chart
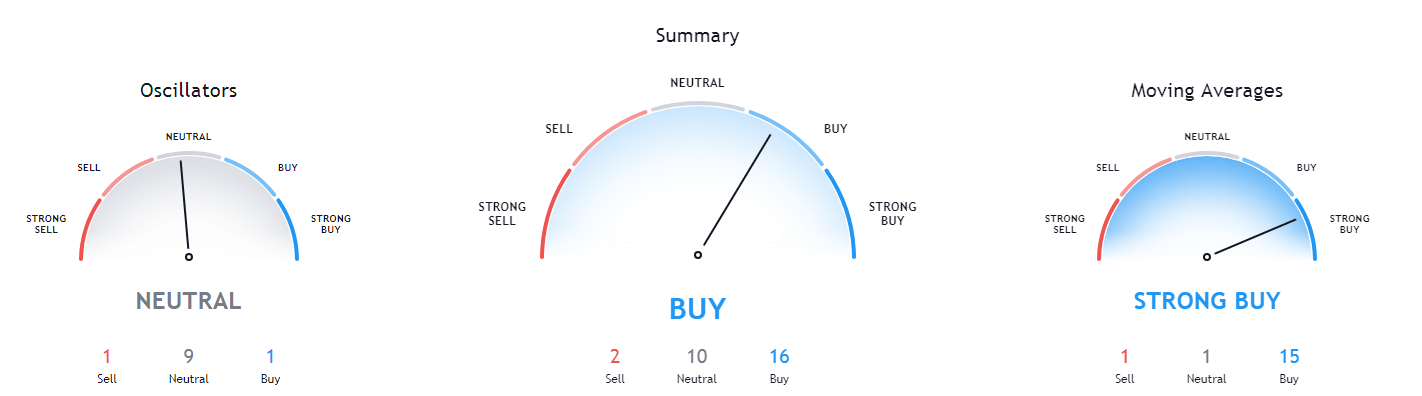
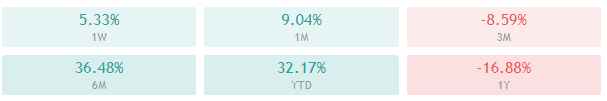
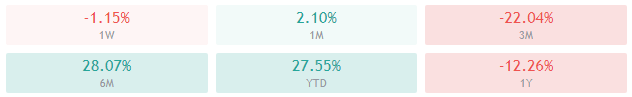
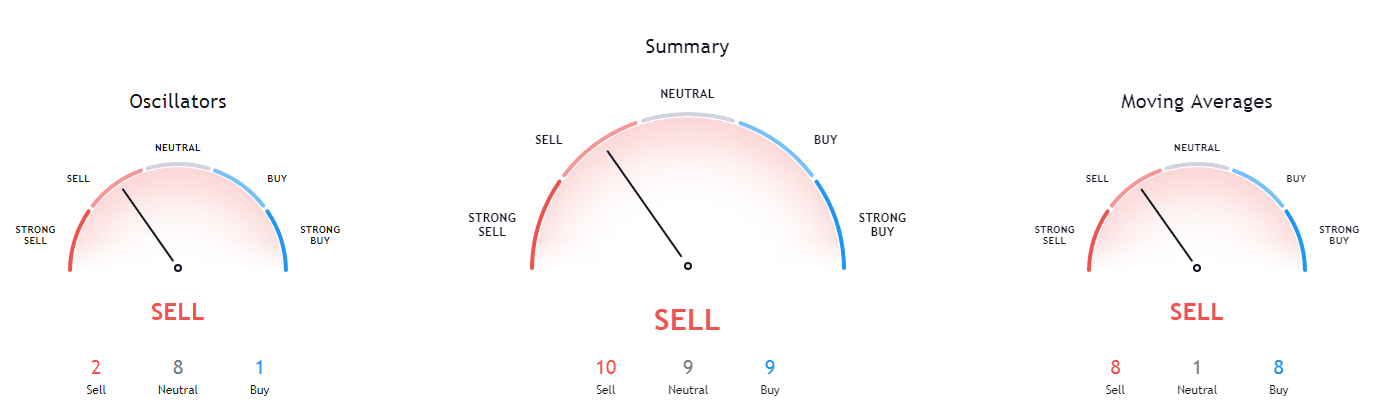
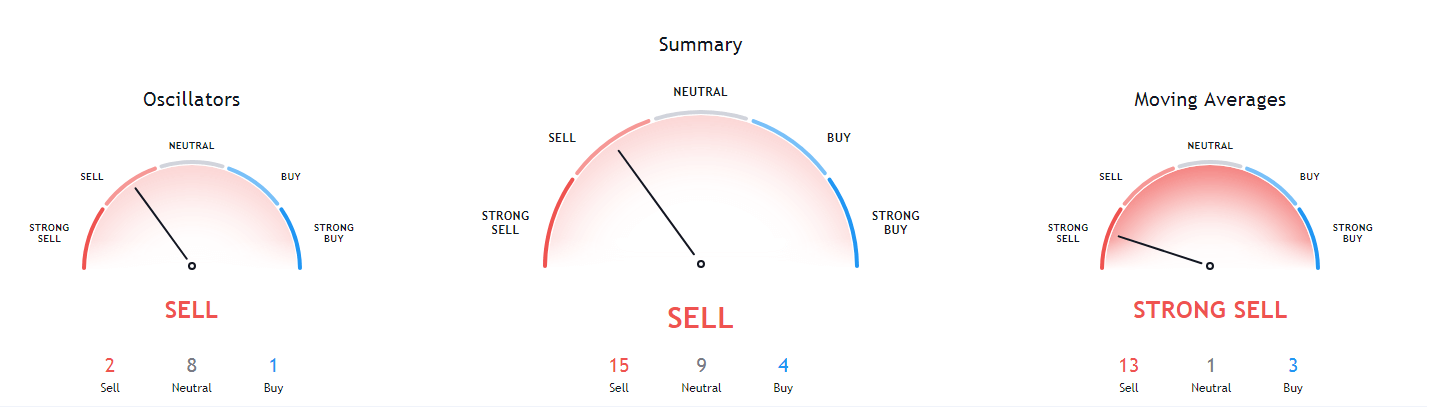
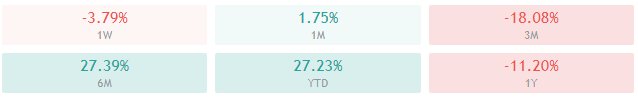
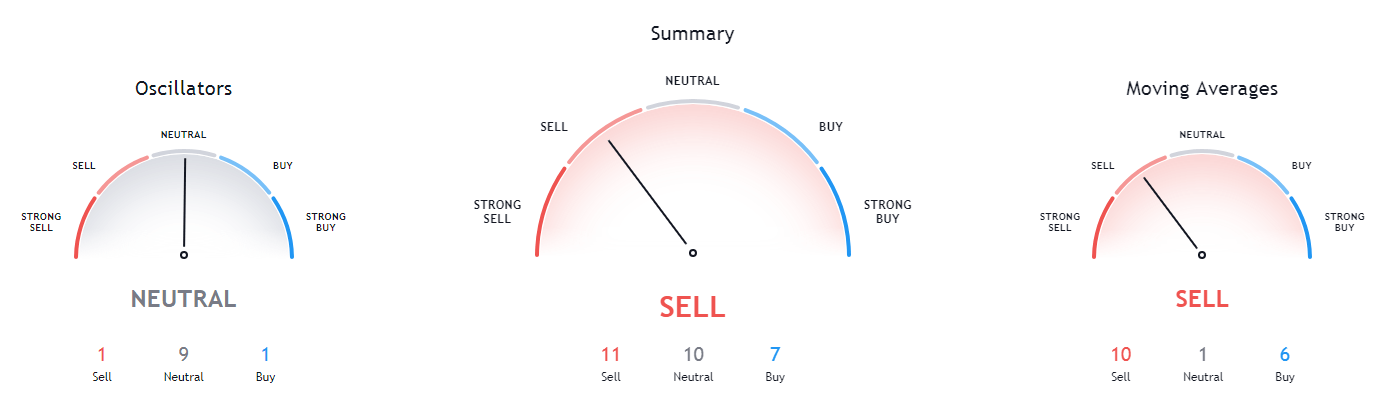
XRP’s technicals on the 4-hour, daily, and weekly time-frame are bullish with slight hints of neutrality. On the other hand, its monthly overview is heavily tilted towards the sell-side.

XRP/USD 1-day Technicals
Technical factors (4-hour Chart):
- The price above its 50-period EMA and slightly above its 21-period EMA
- Price is slightly above its middle Bollinger band
- RSI is neutral (55.12)
- Volume is average
Key levels to the upside Key levels to the downside
1: $0.26 1: $0.2454
2: $0.266 2: $0.235
3: $0.27 3: $0.227