
The cryptocurrency sector has spent the day trying to find a point of consolidation. However, most cryptocurrencies did end up in the red. Bitcoin is currently trading for $11,412, representing a decrease of 0.38% on the day. Meanwhile, Ethereum lost 1.28% on the day, while XRP lost 3.36%.

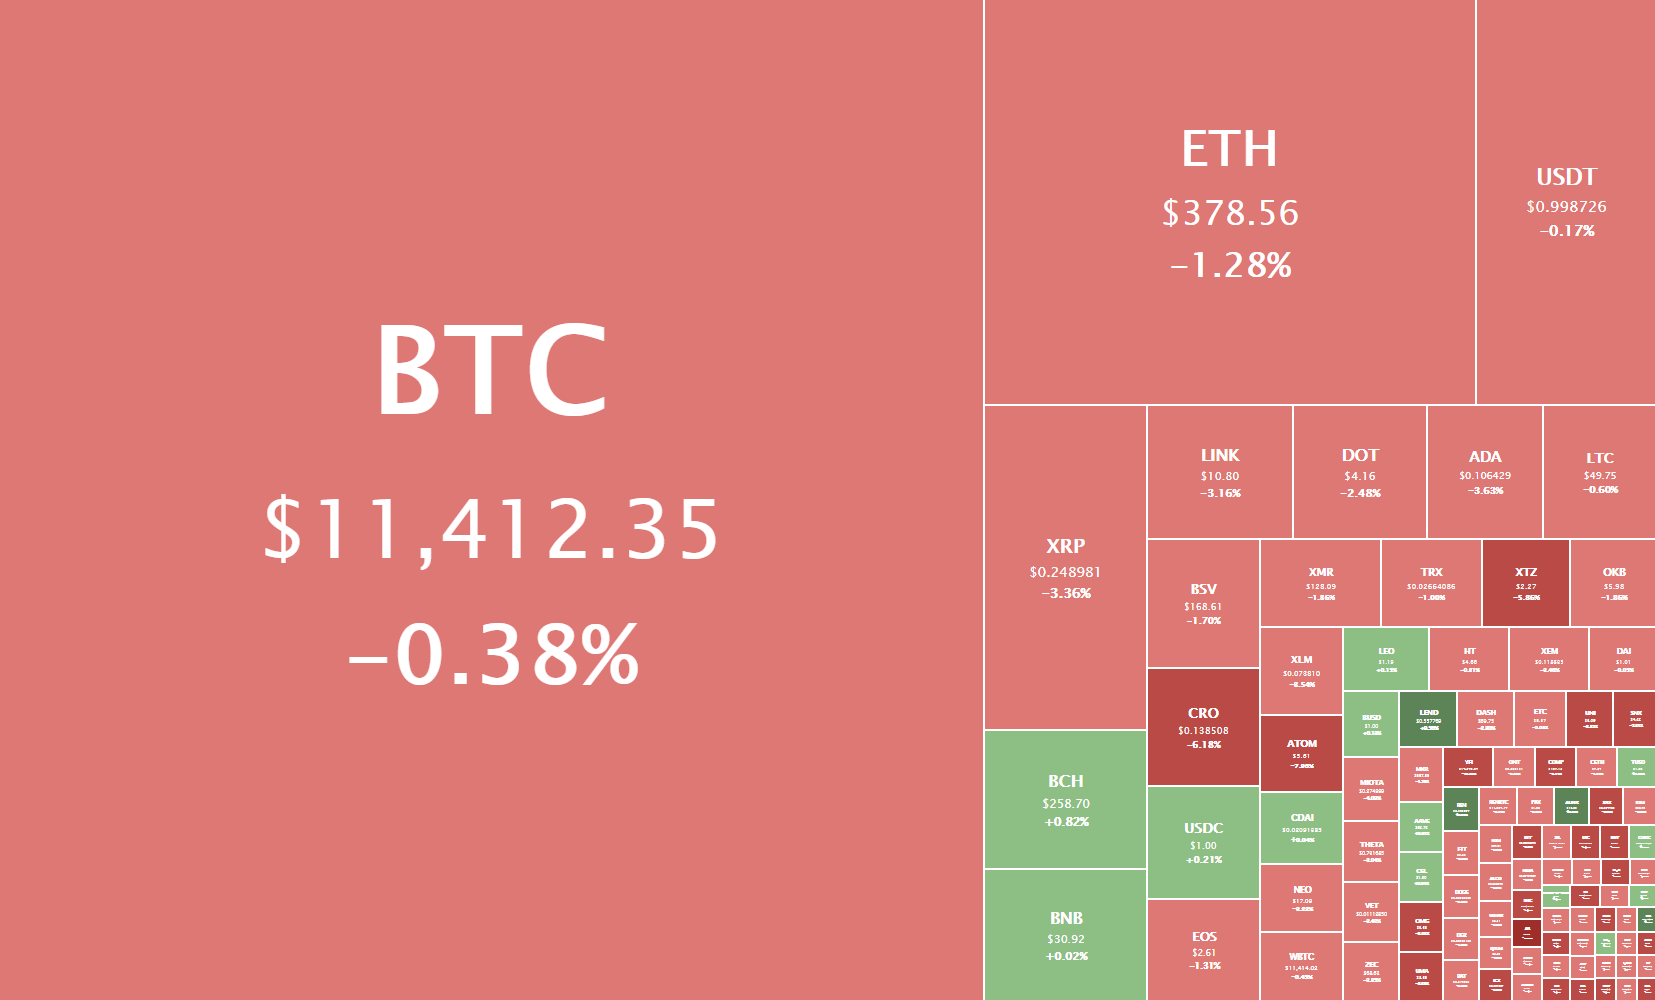
Daily Crypto Sector Heat Map
If we look at the top 100 cryptocurrencies, we can see that ABBC Coin gained 21.28% in the past 24 hours, making it the top daily gainer. Reserve Rights (19.41%) and Ren (13.61%) also did great. On the other hand, Storj lost 13.98%, making it the most prominent daily loser. It is followed by Uniswap’s loss of 12.63% and Energy Web Token’s loss of 9.94%.
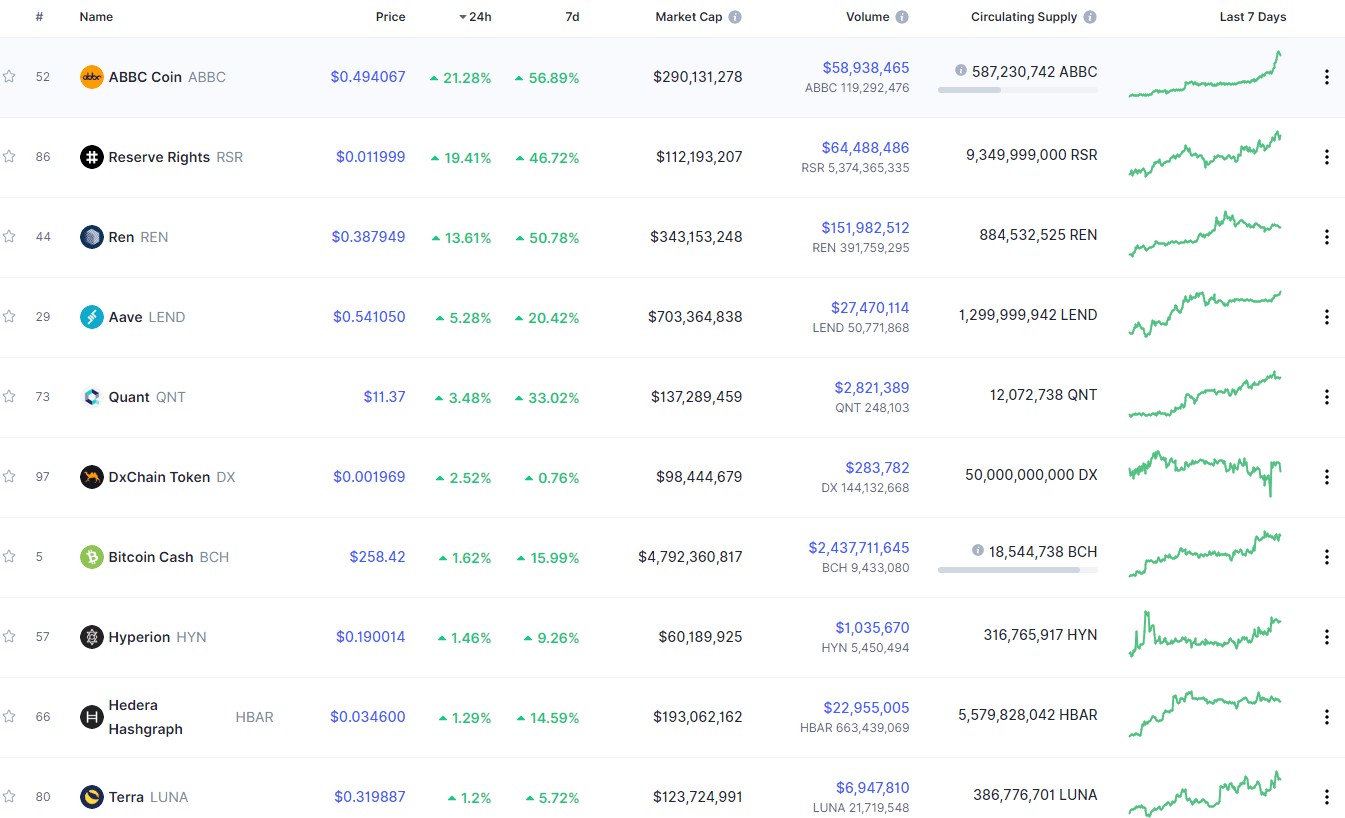
Top 10 24-hour Performers (Click to enlarge)
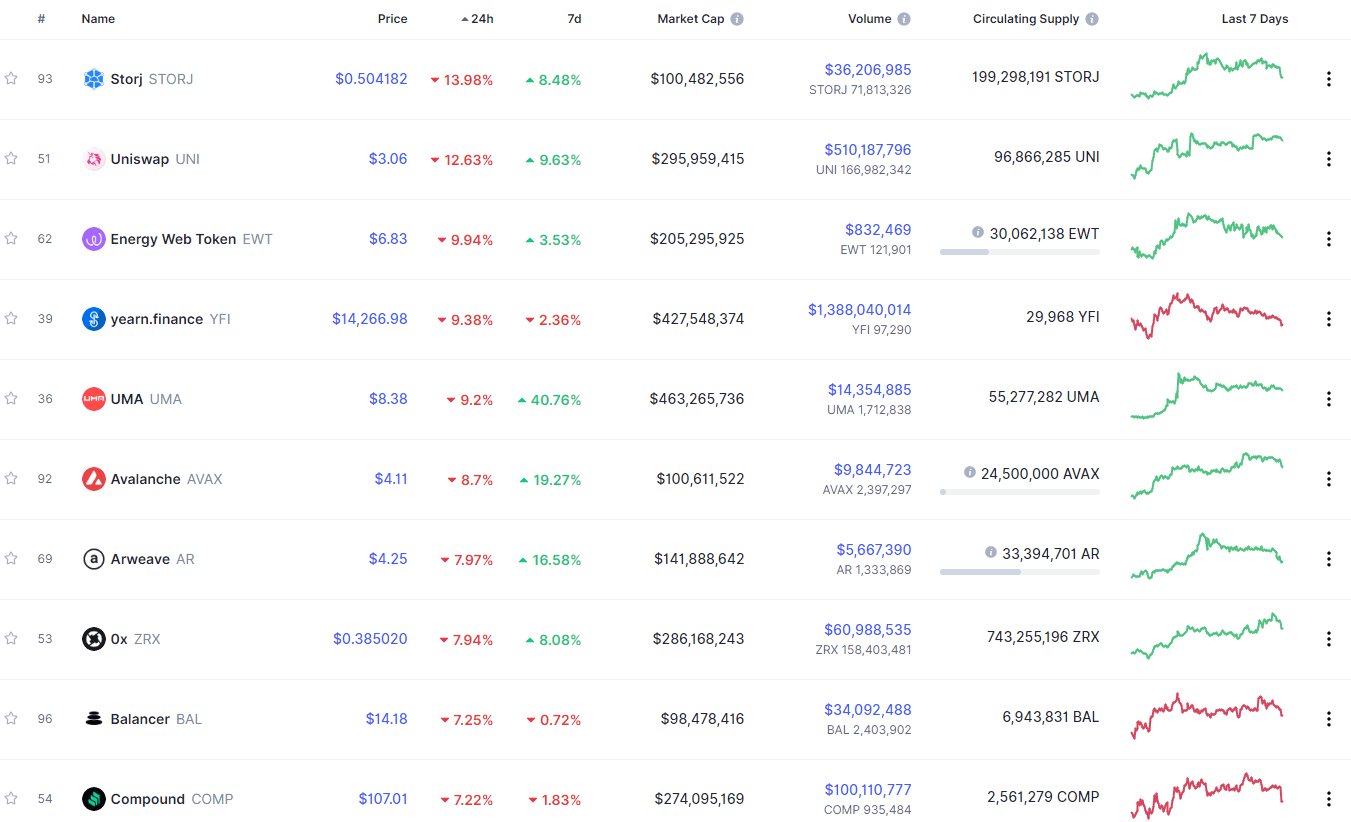
Bottom 10 24-hour Performers (Click to enlarge)
Bitcoin’s market dominance level has decreased since our last report, with its value currently being 58.7%. This value represents a 2.54% difference to the downside when compared to when we last reported.
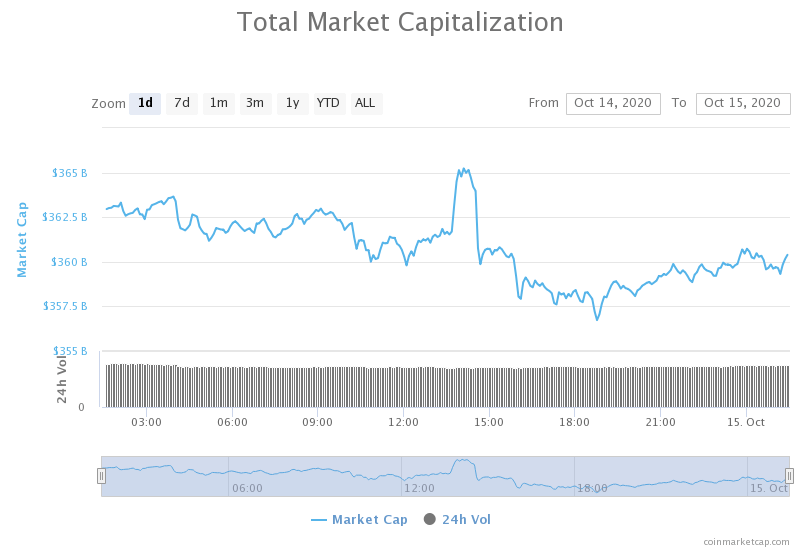
Daily Crypto Market Cap Chart
The crypto sector capitalization has lost a bit of its value over the course of the past 24 hours. Its current value is $360.10 billion, representing a decrease of $1.88 billion compared to our previous report.
_______________________________________________________________________
What happened in the past 24 hours?
_______________________________________________________________________
- CoinList mints largest ever single-day quantity of WBTC (The Block)
- How crypto firms and traders in the UK might get around the new derivatives ban (The Block)
- ARK Invest’s crypto analyst says bitcoin market cap could hit $3 trillion by 2025 (The Block)
- Yearn.finance founder launched a new Ethereum experiment, gained $6m in hours (Cryptoslate)
- Institutions Rush to Bitcoin, Grayscale’s Record-Breaking Q3 (Cryptobriefing)
- Following OECD Report, Member Country Spain Clamps Down on Crypto Users (Cryptobriefing)
- Litecoin One Step Closer to Cardano Partnership and “Velvet Fork” (Cryptobriefing)
- Ethereum’s Vitalik Buterin Calls on Power Users to Move to Layer 2 Scaling (Coindesk)
- Surging Bitcoin futures volume highlights increasing institutional interest (Cointelegraph)
- JPMorgan says Bitcoin slightly overvalued as a commodity (Cointelegraph)
_______________________________________________________________________
Technical analysis
_______________________________________________________________________
Bitcoin
The largest cryptocurrency by market cap spent the past 24 hours stuck within a range bound by the $11,300 support level and $11,500 resistance level. The price entered a state of enormous volatility at one point, where Bitcoin tried to break both to the upside and downside. However, the move to the upside was quickly shut down, while the move towards the downside took a bit more time but failed as well. This left Bitcoin in a narrow range, which it will come out of as soon as the bulls and bears stabilize. Its decreasing RSI and volume are proof of future possible, sideways trading, as well as a big move up ahead.
BTC/USD 1-day Chart
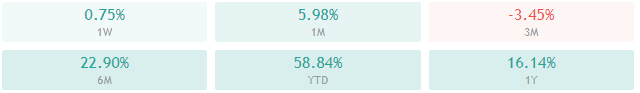
Bitcoin’s technical overview is extremely bullish on every single time-frame, with longer time-frames showing full tilt towards the buy-side, while the shorter ones are slightly tilted towards the buy-side.
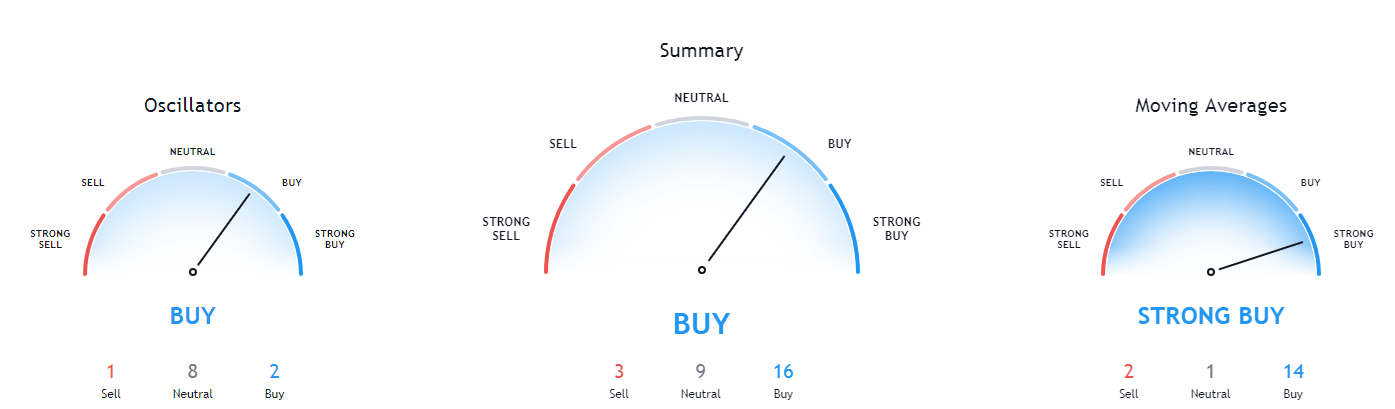
BTC/USD 1-day Technicals
Technical factors (4-hour Chart):
- Price is above its 50-period EMA and at its 21-period EMA
- Price is at the middle Bollinger band
- RSI is neutral and descending (53.49)
- Volume is average
Key levels to the upside Key levels to the downside
1: $11,500 1: $11,300
2: $11,630 2: $11,180
3: $12,000 3: $11,000
Ethereum

Ethereum (just like Bitcoin) tried to find a consolidation price but failed to do so. The second-largest cryptocurrency by market cap faced an upward-facing trend line which it could not follow anymore that triggered a selloff and a drop below the line as well as the $378 support level. While Ethereum is still fighting for the support (now resistance) level, the price will most likely stay above this line.
ETH/USD 4-hour Chart
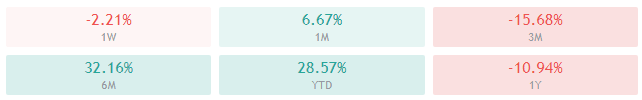
Ethereum’s technicals on all time-frames are bullish, with longer time-frames having a stronger bullish sentiment than the shorter ones. However, its monthly overview’s oscillators are showing indecisiveness, as they are neutral.
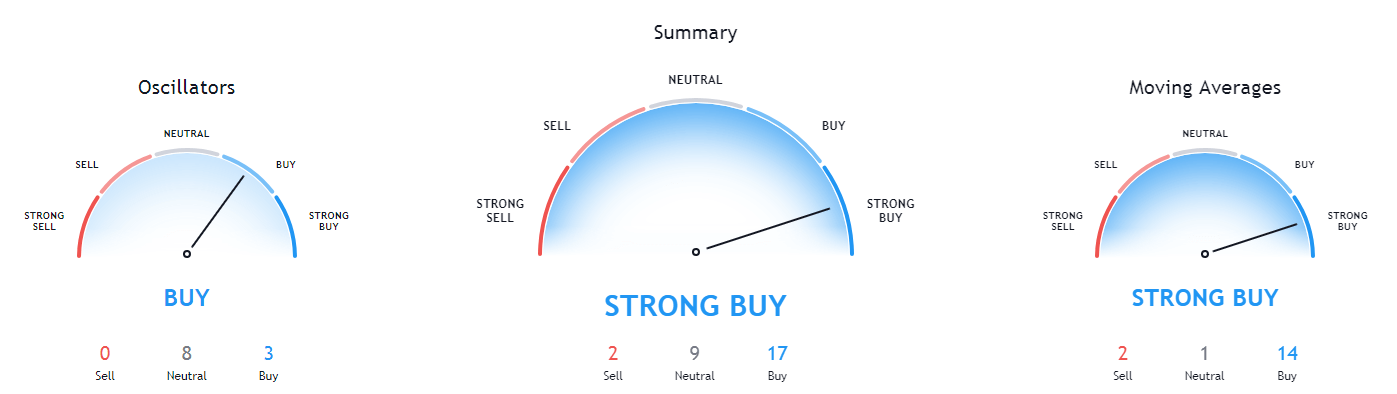
ETH/USD 1-day Technicals
Technical Factors (4-hour Chart):
- The price is above its 50-period and at its 21-period EMA
- The price at its middle Bollinger band
- RSI is neutral (51.89)
- Volume is average
Key levels to the upside Key levels to the downside
1: $378 1: $371
2: $400 2: $360
3: $415 3: $334
Ripple
XRP had the worst day performance-wise out of the three cryptocurrencies we are covering. The third-largest cryptocurrency by market cap has dropped below its ascending support trend line, which extended the push towards the downside. The price reached as low as the $0.2454 support level, which is where the bulls picked up the pace and pushed the price up slightly.
Traders should pay attention to how XRP’s price moves around the ascending (yellow) resistance line, as well as the $0.2454 support level.
XRP/USD 4-hour Chart
XRP’s technicals are quite inconsistent, with its 4-hour and monthly technicals being tilted towards the sell-side. On the other hand, its weekly overview is bullish, while its daily overview is tilted more towards the bull side, with moving averages still having a hint of bearish sentiment.
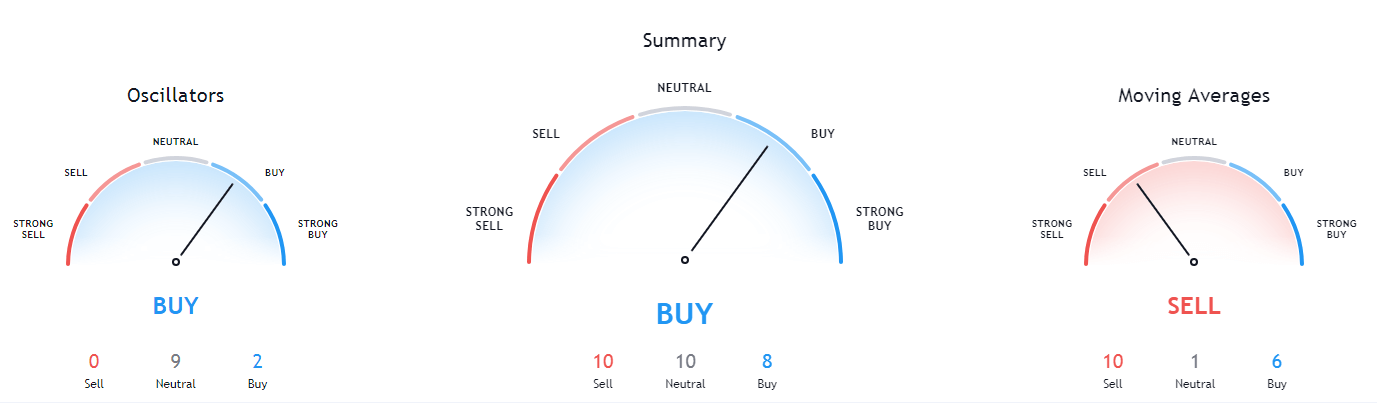
XRP/USD 1-day Technicals
Technical factors (4-hour Chart):
- The price is below both its 50-period EMA as well as its 21-period EMA
- Price is at its lower Bollinger band
- RSI is pushing towards the oversold area (38.64)
- Volume is average (with the exception of one huge volume candle)
Key levels to the upside Key levels to the downside
1: $0.266 1: $0.2454
2: $0.27 2: $0.235
3: $0.273 3: $0.227
Related posts
 Daily Crypto Review, July 24 – Bitcoin Above $10,000; Ethereum Passing $300
 Daily Crypto Review, July 28 – Bitcoin Spikes to $11,000; Over $300 Million Liquidated
 Daily Crypto Review, August 11 – yEarn Finance Token Explodes After Binance Listing; BTC Hashrate Unaffected by the Price Upswing
 Daily Crypto Review, Dec 18 – Bitcoin at $23,000; Crypto Sector Preparing for the Next Move