Categories
Crypto Crypto Education

Cryptocurrency Trading: Expectation Vs. Reality

Cryptocurrency trading is starting to take off, it is becoming more and more accessible with far more brokers now beginning to offer it as a tradable asset. While it is very similar in its function to forex trading, coming over from forex to cryptocurrency trading can have a lot of changes and a lot of differences than you may not be expecting. The same with looking at it from the outside, it may look like one thing but actually behave in a very different way. Due to this, we are going to be looking at some of the differences between the expectations and the realities of trading cryptocurrencies that you may think of or experience when eventually starting out.

Expectation 1: Huge profits

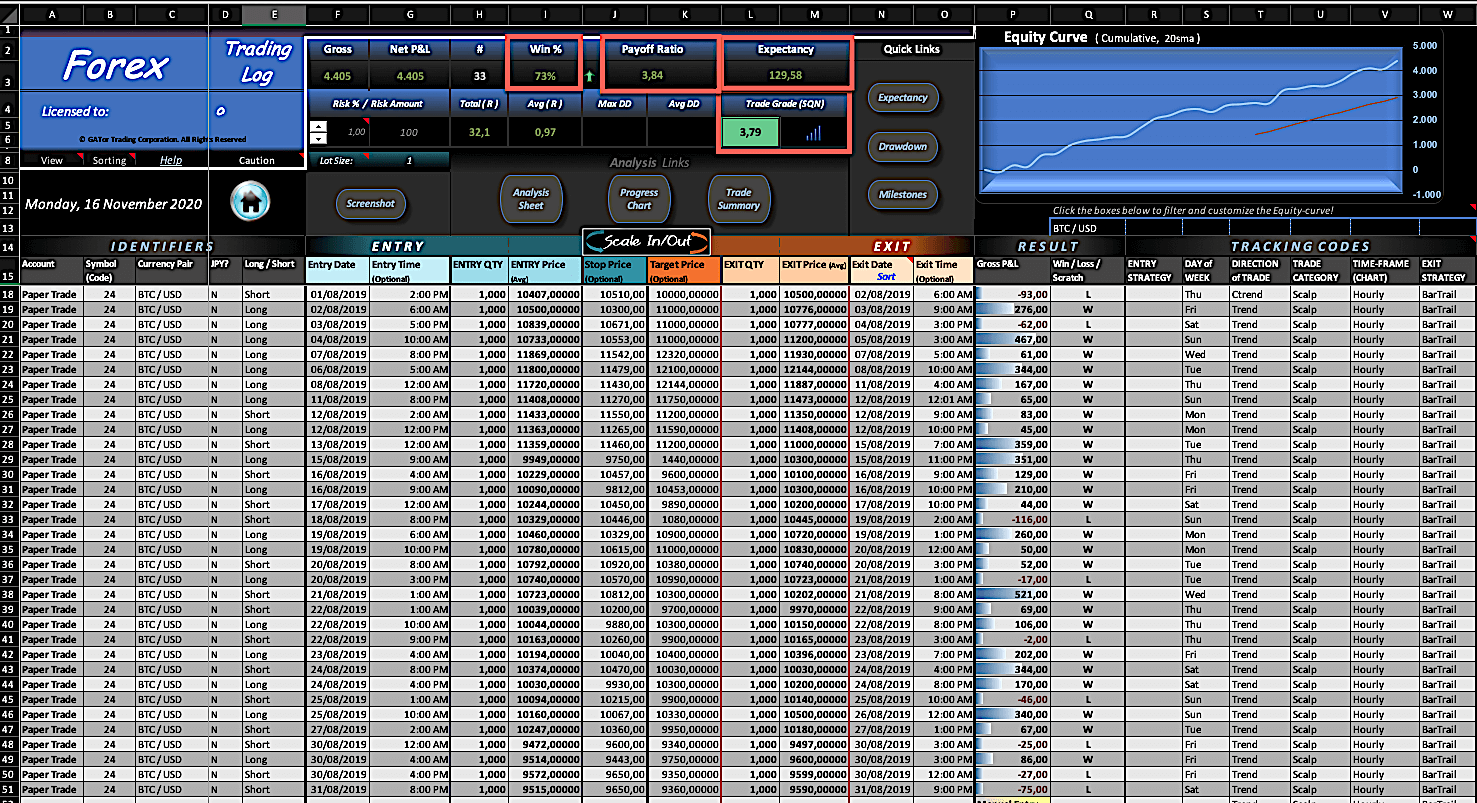
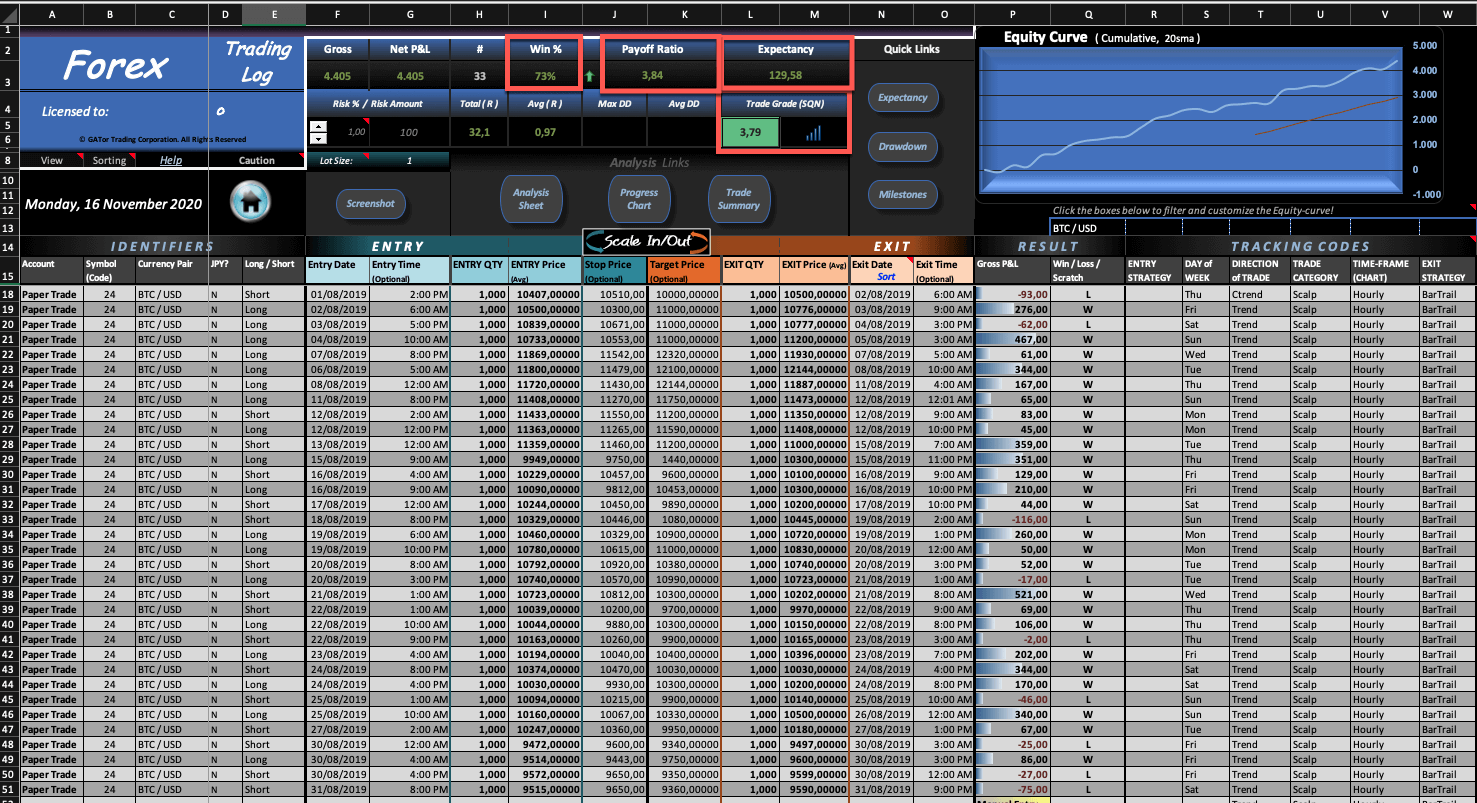
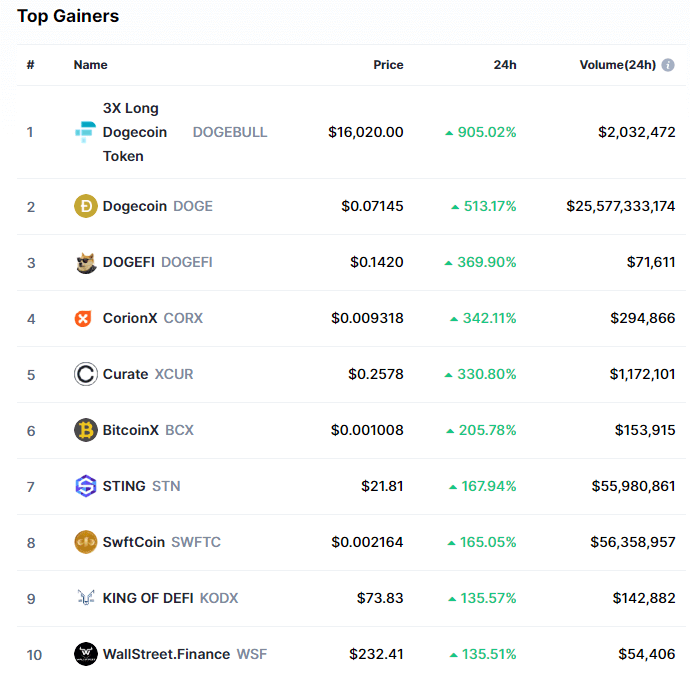
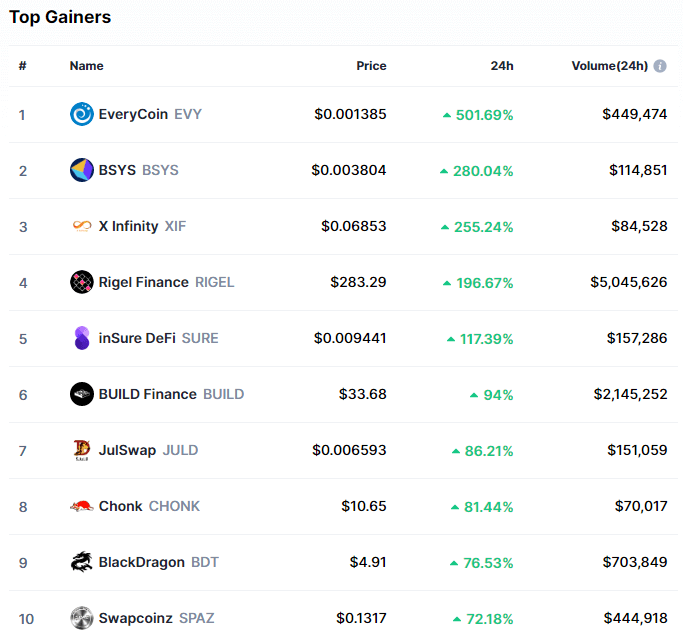
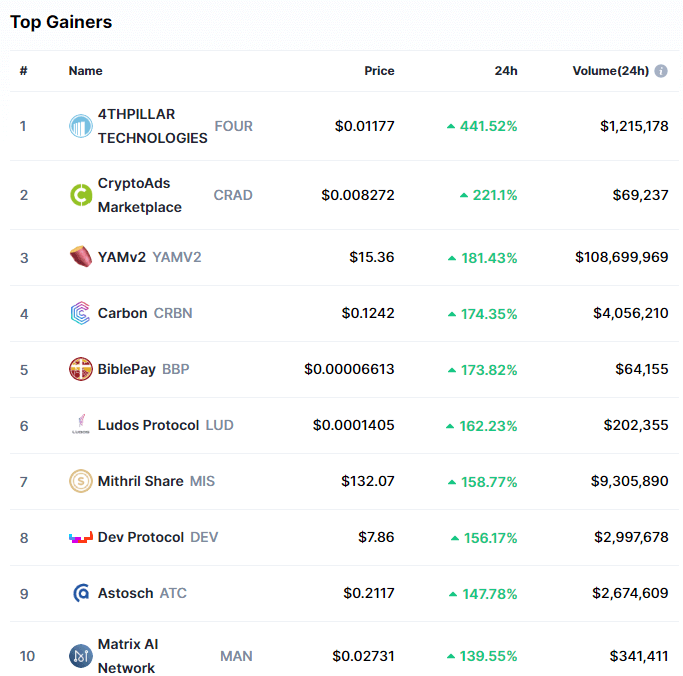
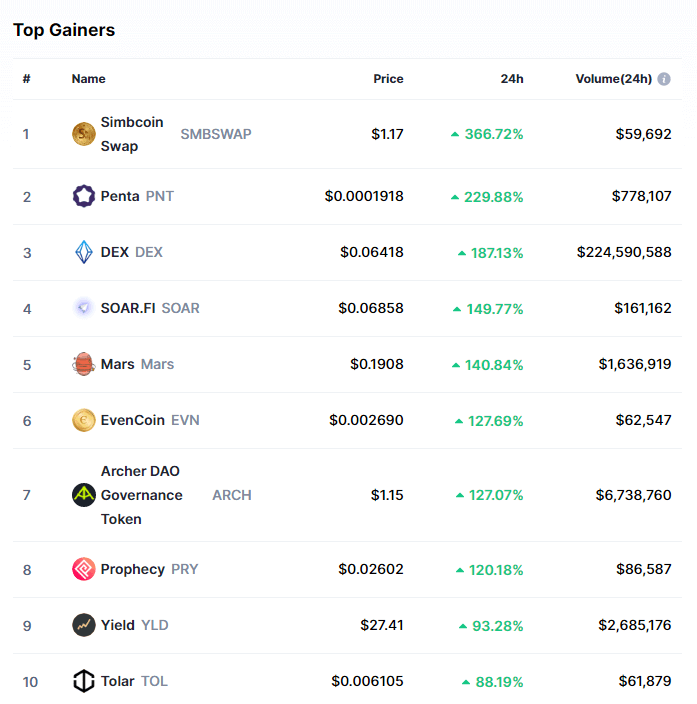
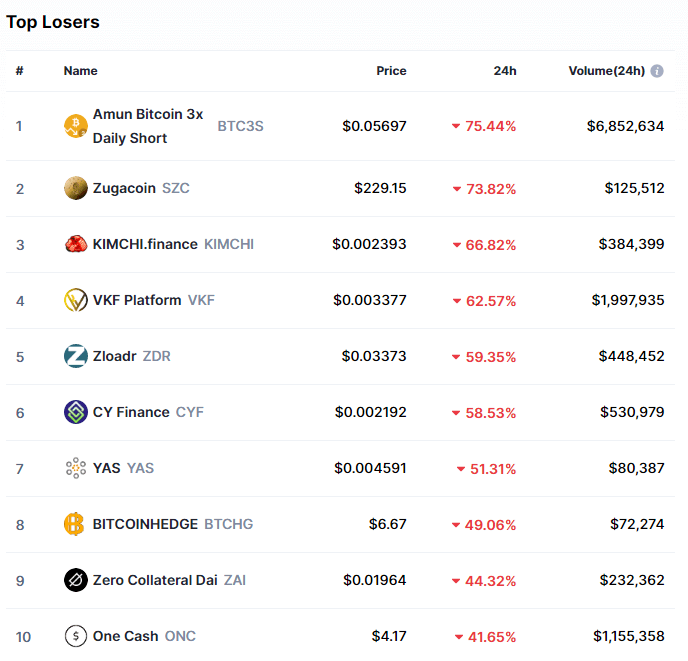
A lot of people believe that trading cryptocurrencies can bring a lot of profits, huge profits, especially when comparing it to things like forex. From the outside, when you look at things like social media, you can see people posting pictures of their supposed results, some of them are ridiculous making thousands per day. While it is possible, the majority of these screenshots will be fake or on demo accounts. There are those that can make a lot, and we mean a lot, but those cases are a lot rarer than they may look like or from what you are being told.

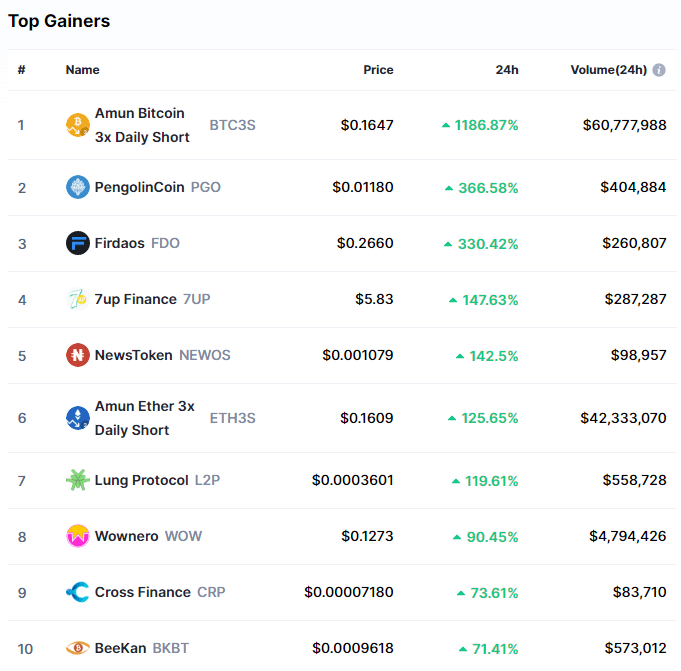
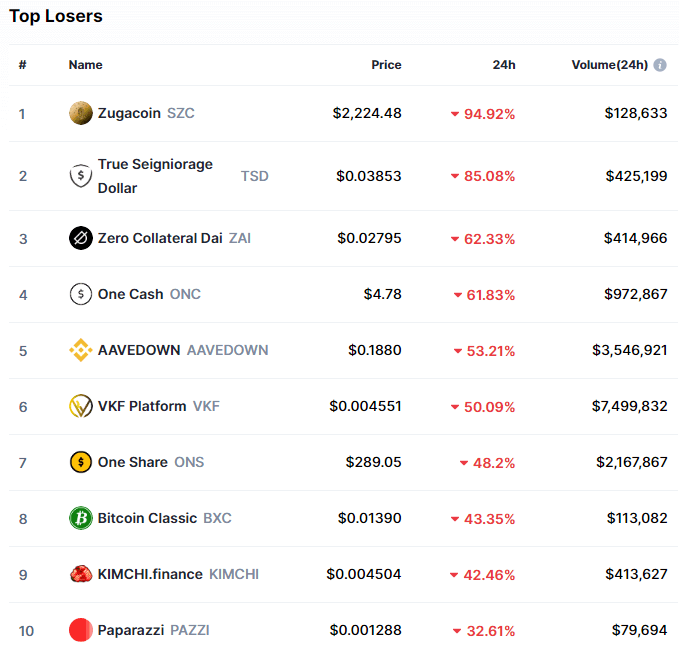
Reality 1: Big profits, big risks

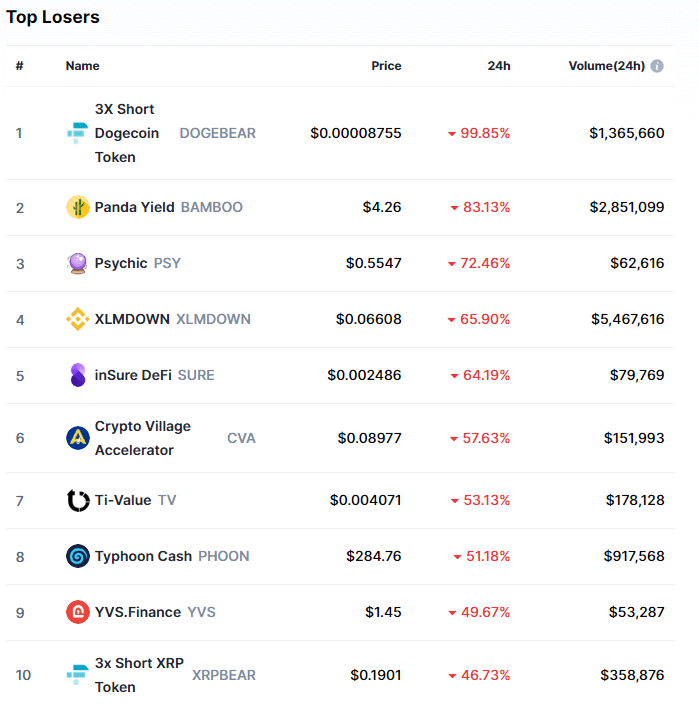
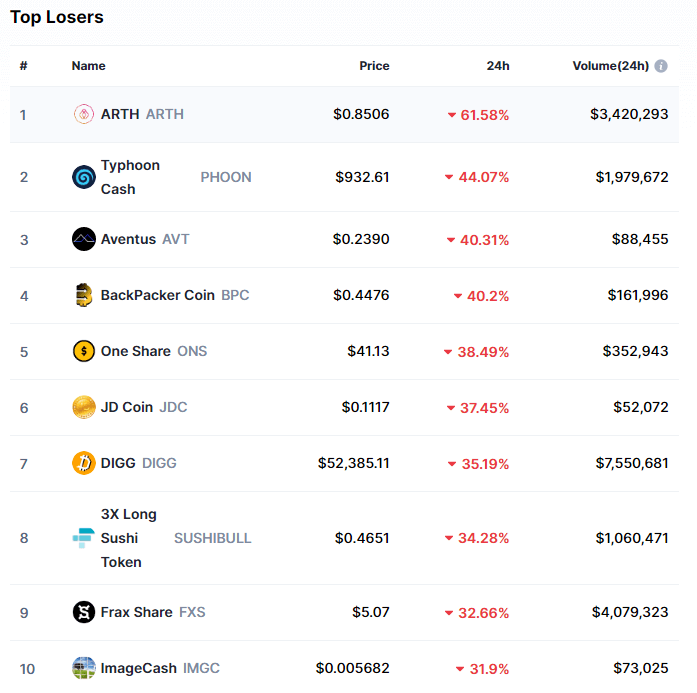
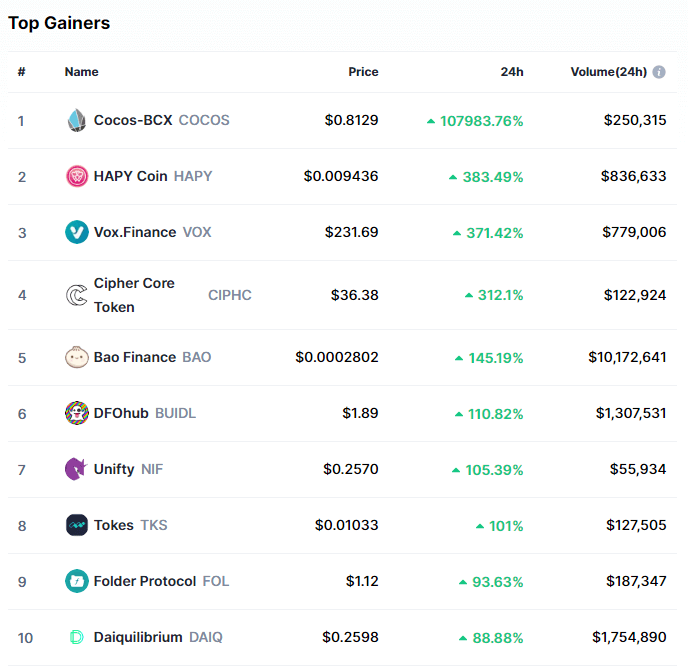
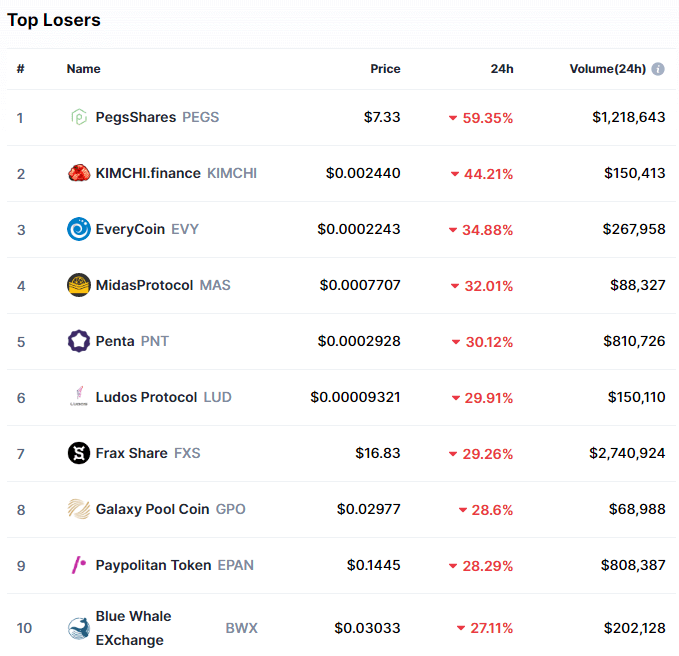
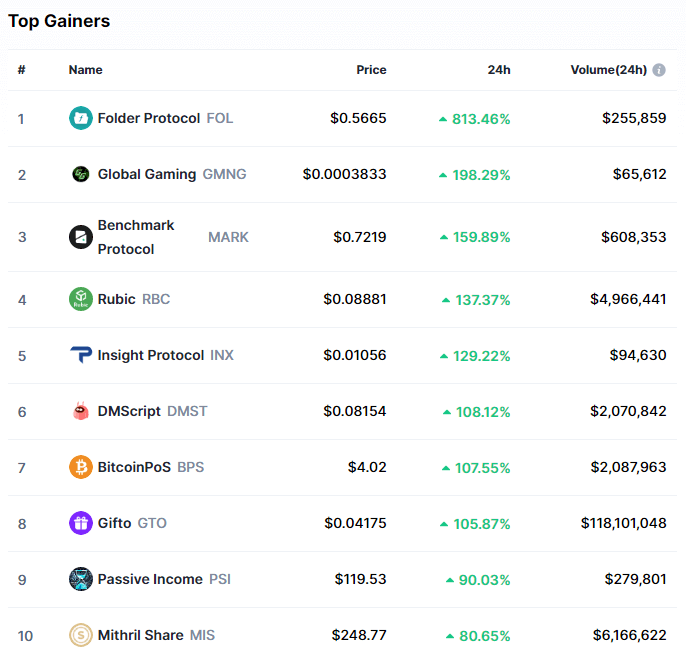
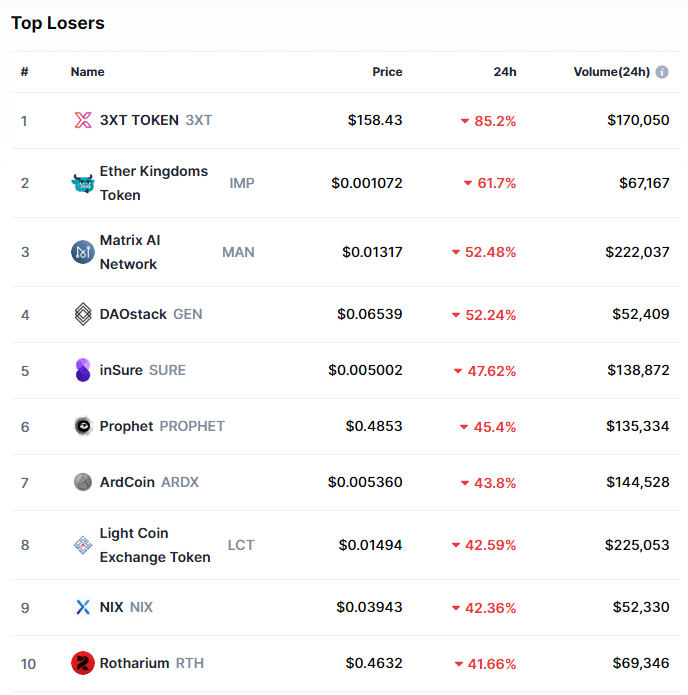
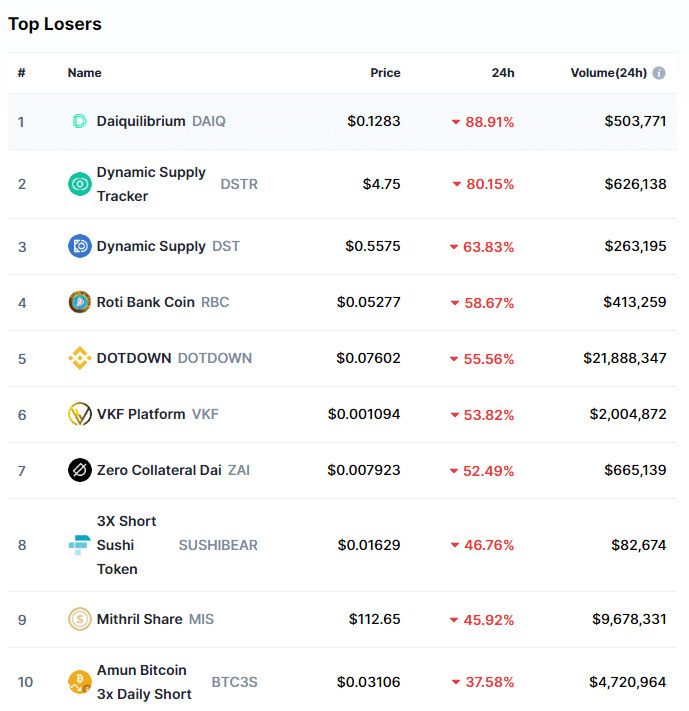
There Are some big profits to be made, some very big profits especially if you manage to catch one of the cryptocurrencies when they are on one of their large and long trends. The problem is that in order to make a lot of money, you will also need to risk a lot. The more you trade the more you can make, but then again, the more you trade the more you can lose. Those that are making a lot of money either have very large balances or they are risking far more than they should be with each trade and they could very easily lose it all rather than make a profit. So yes, profits can be large, but you will be risking a lot to get them.

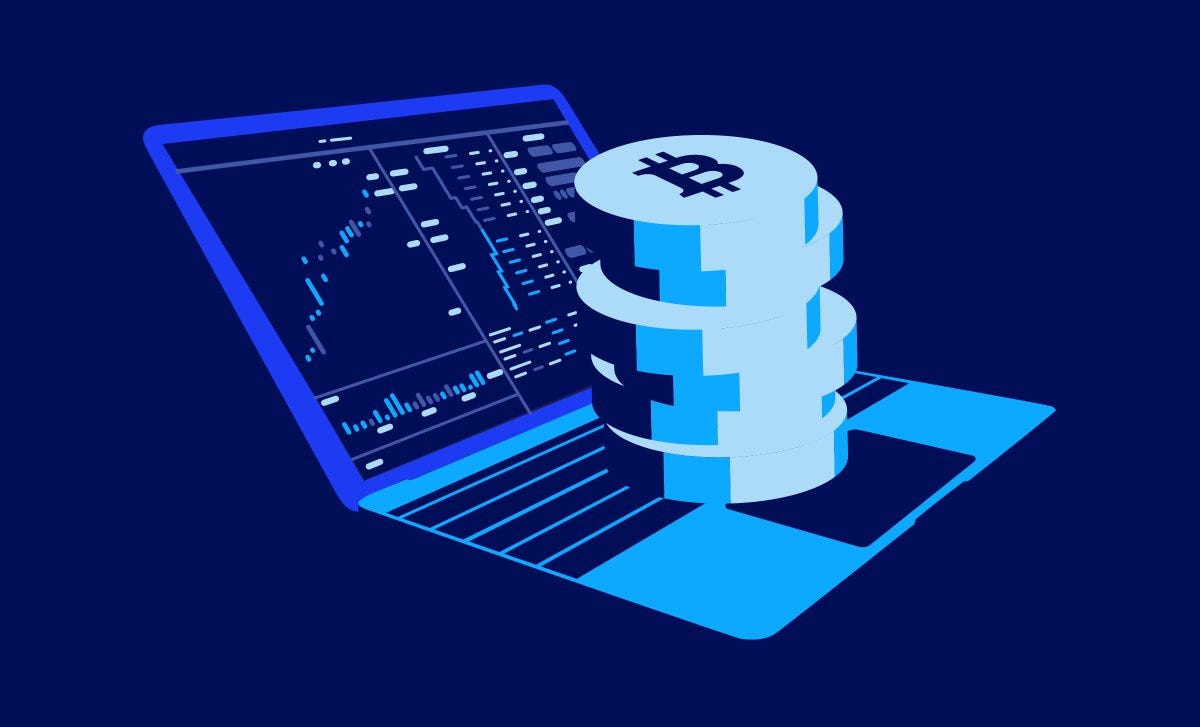
Expectation 2: Only bitcoin to trade

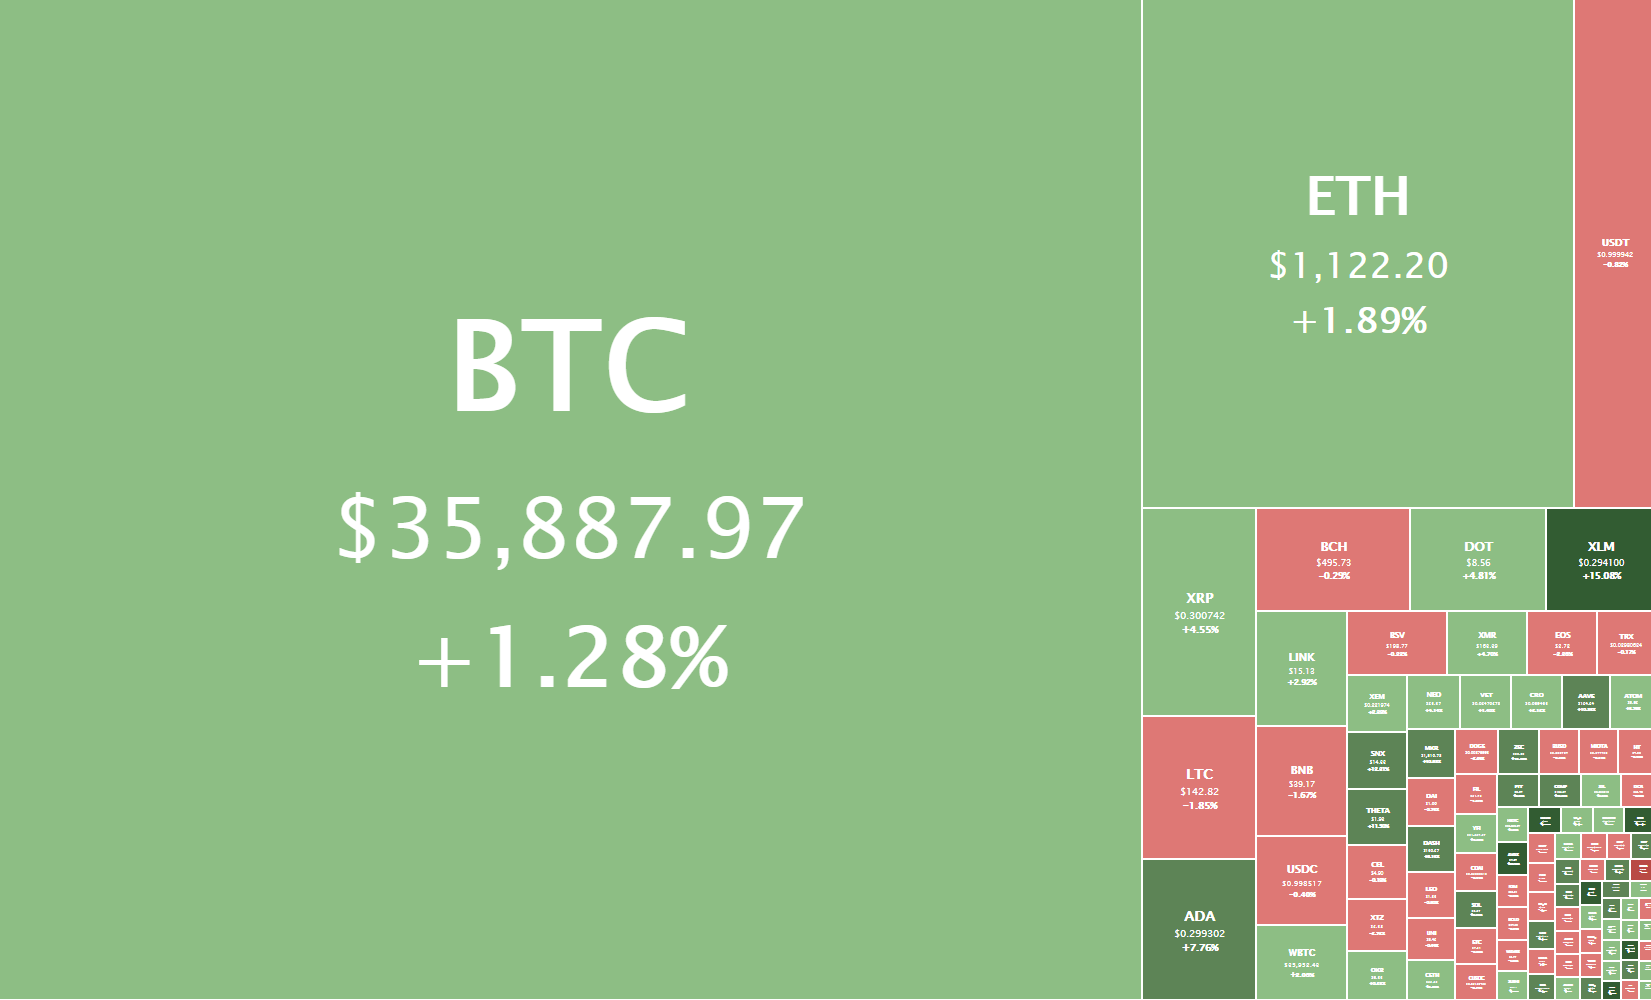
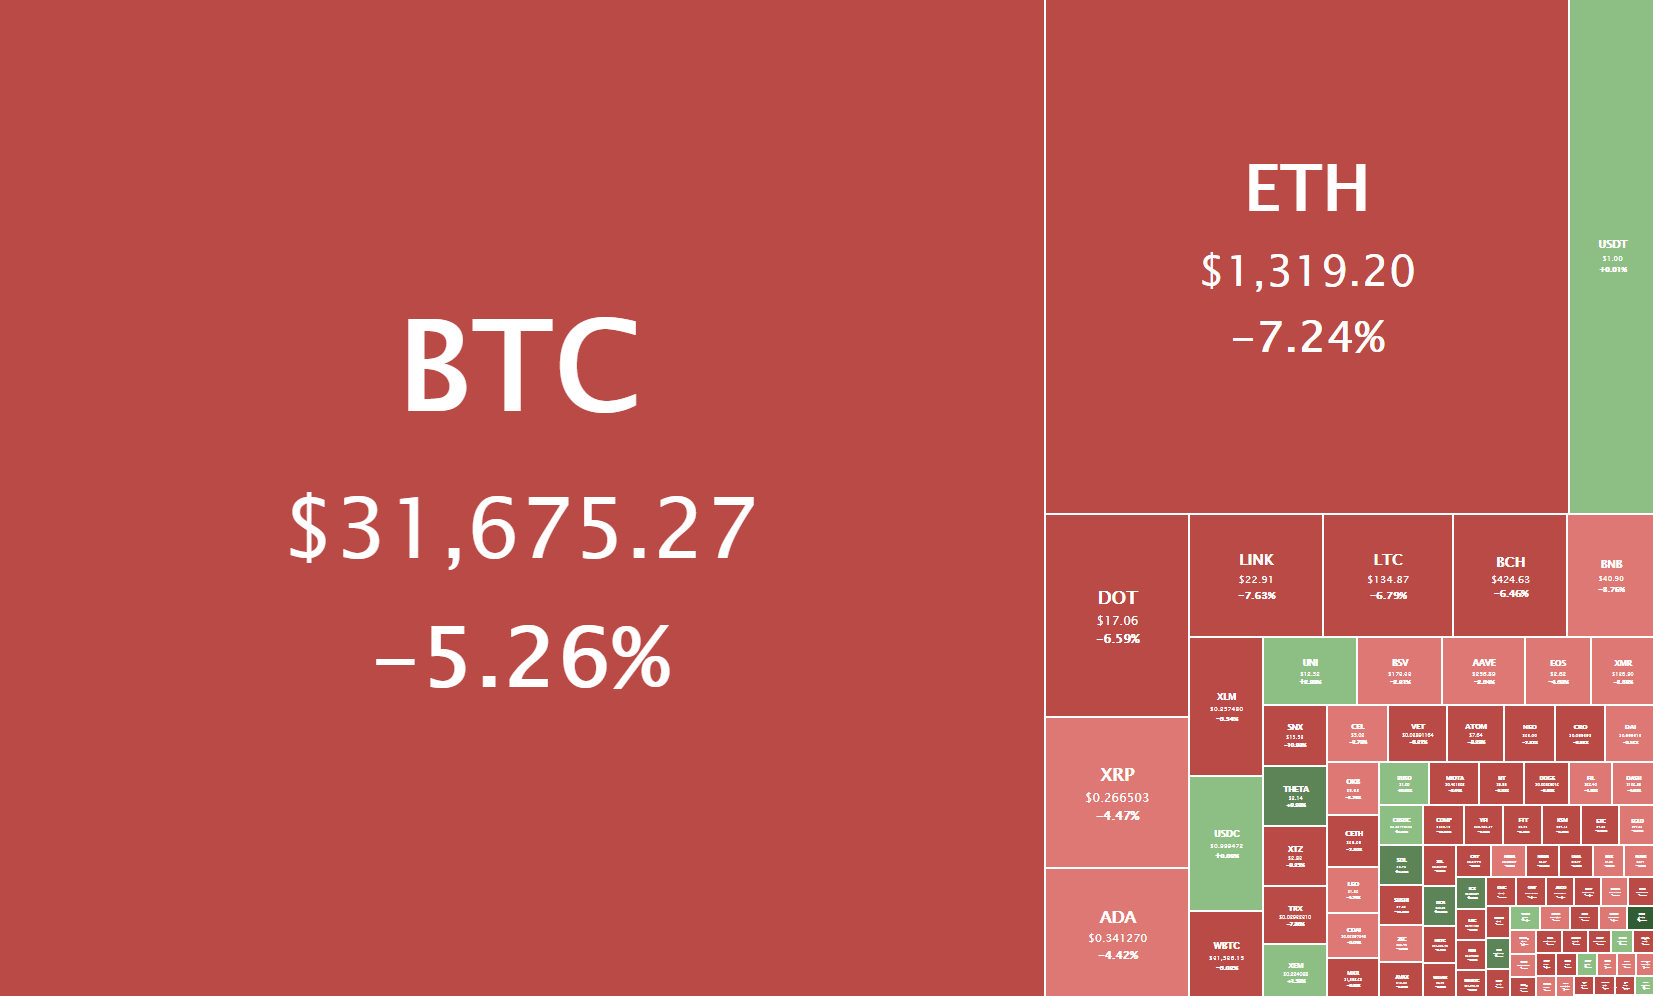
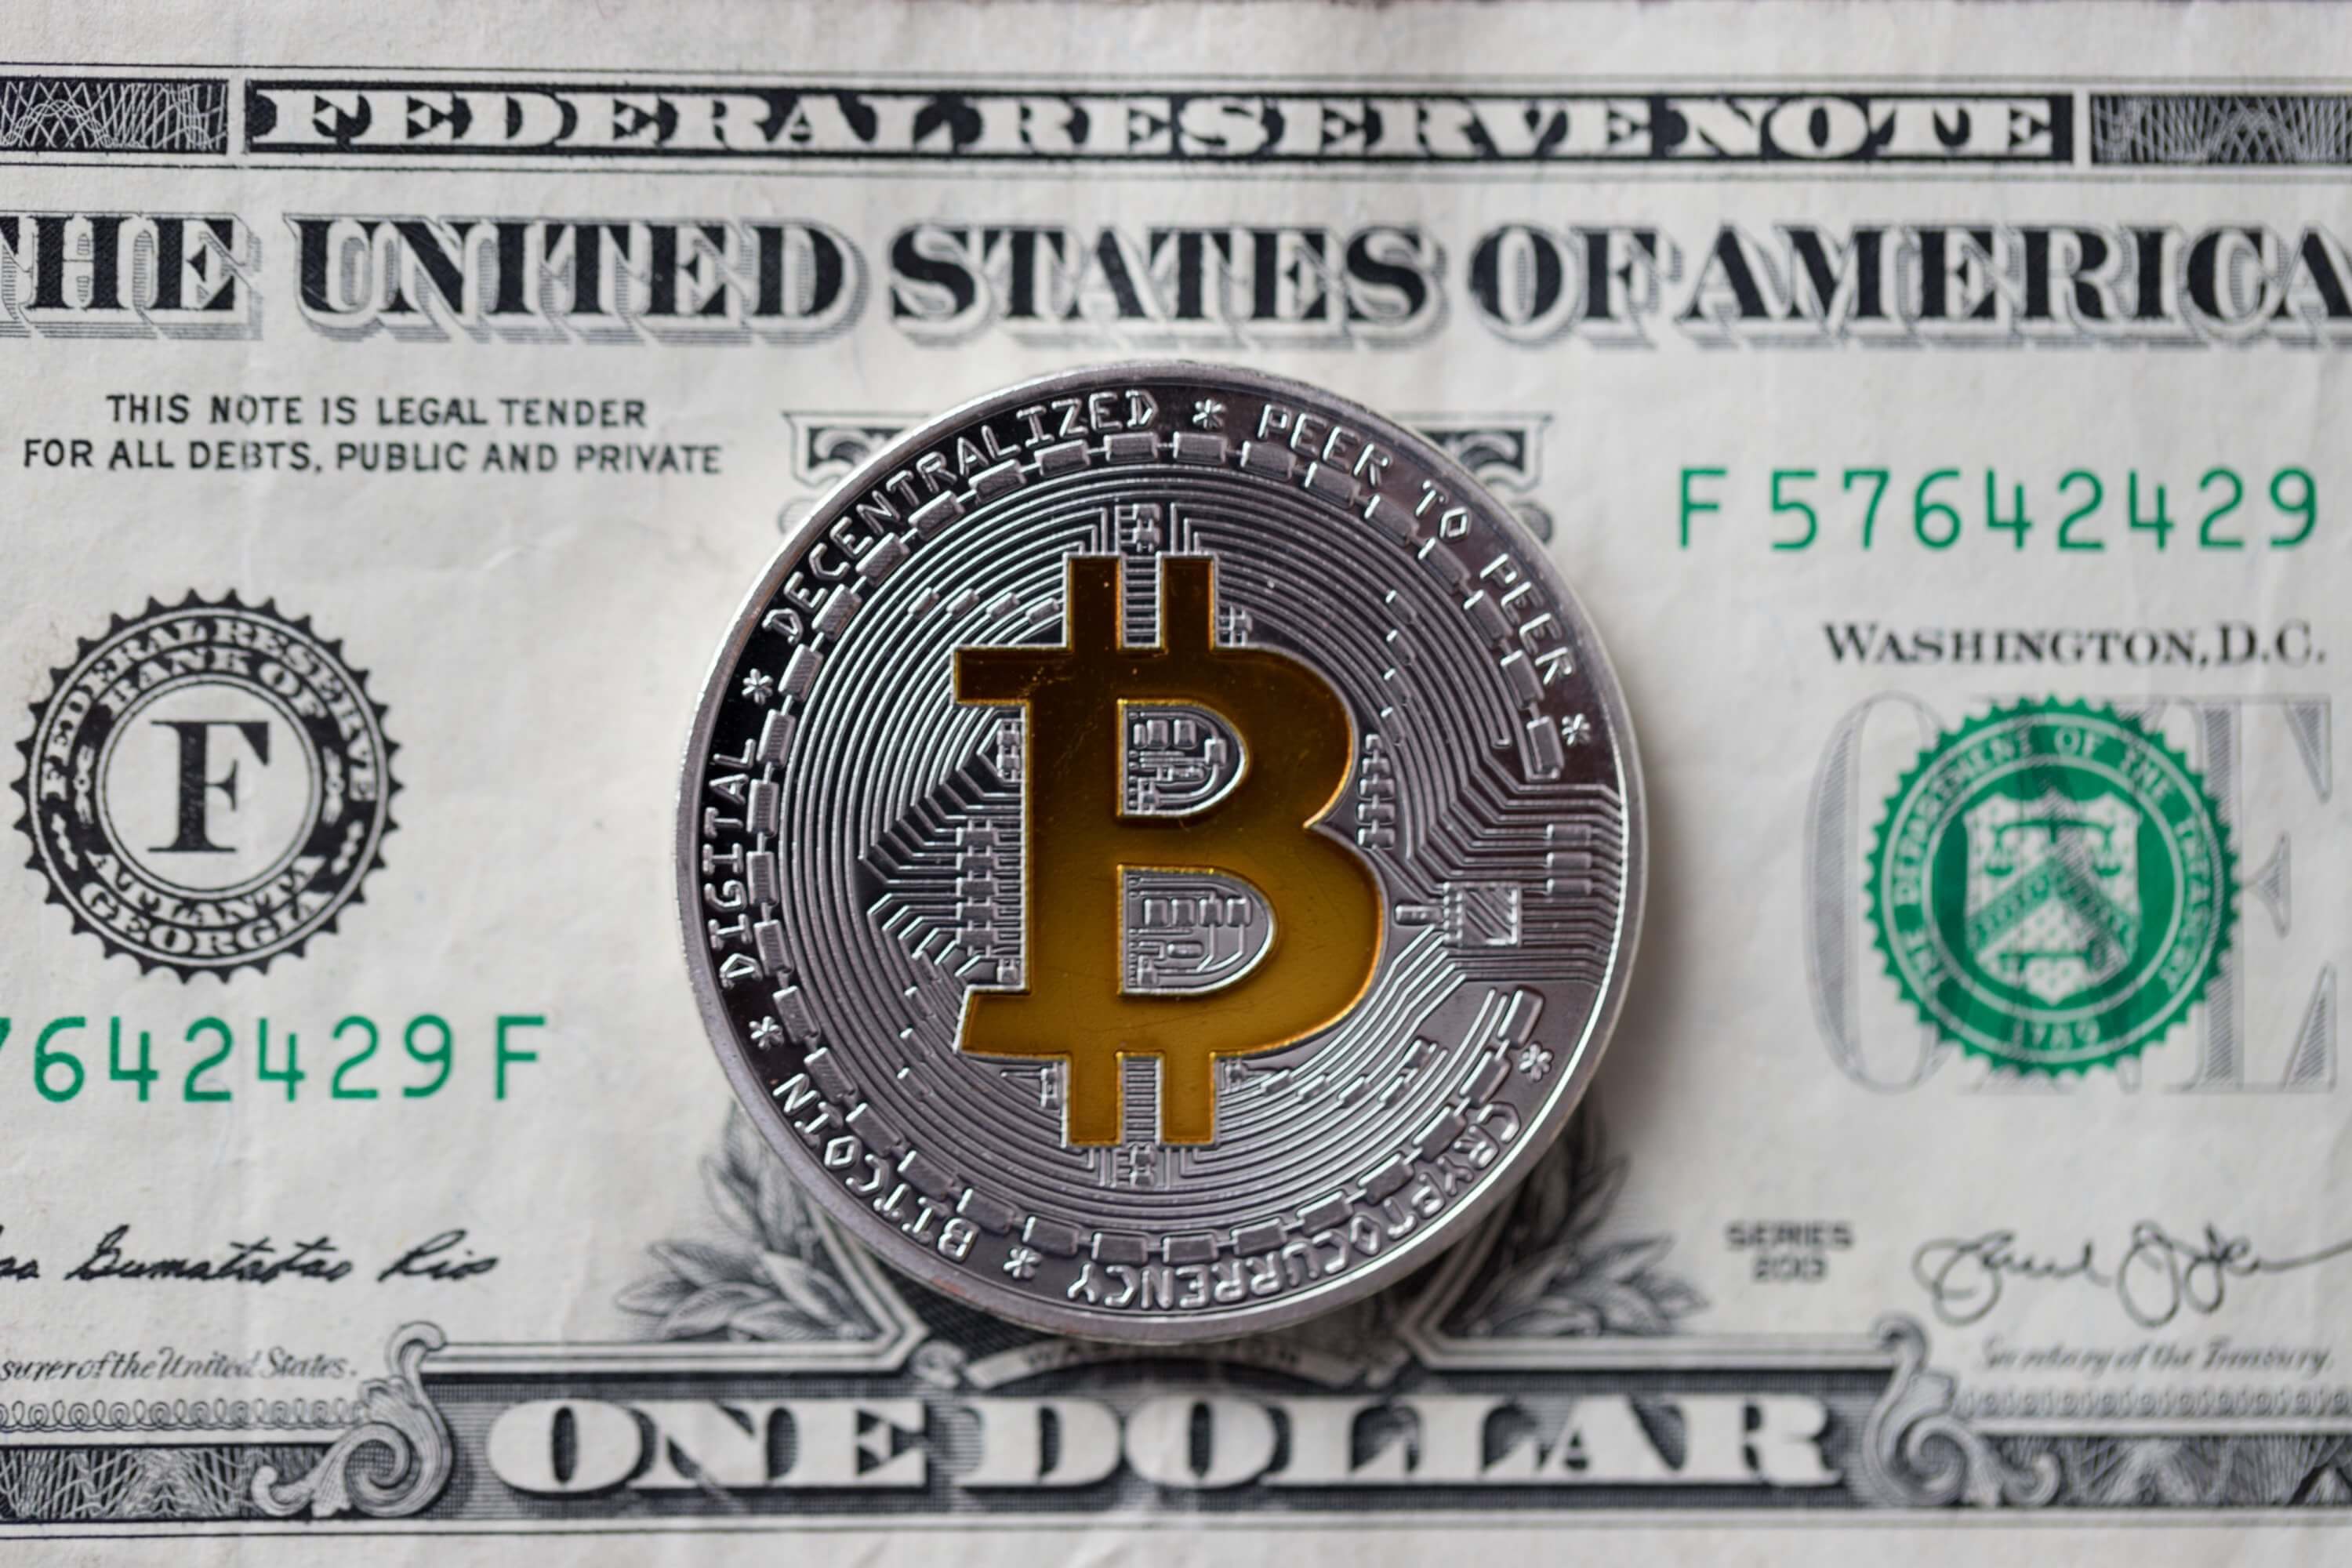
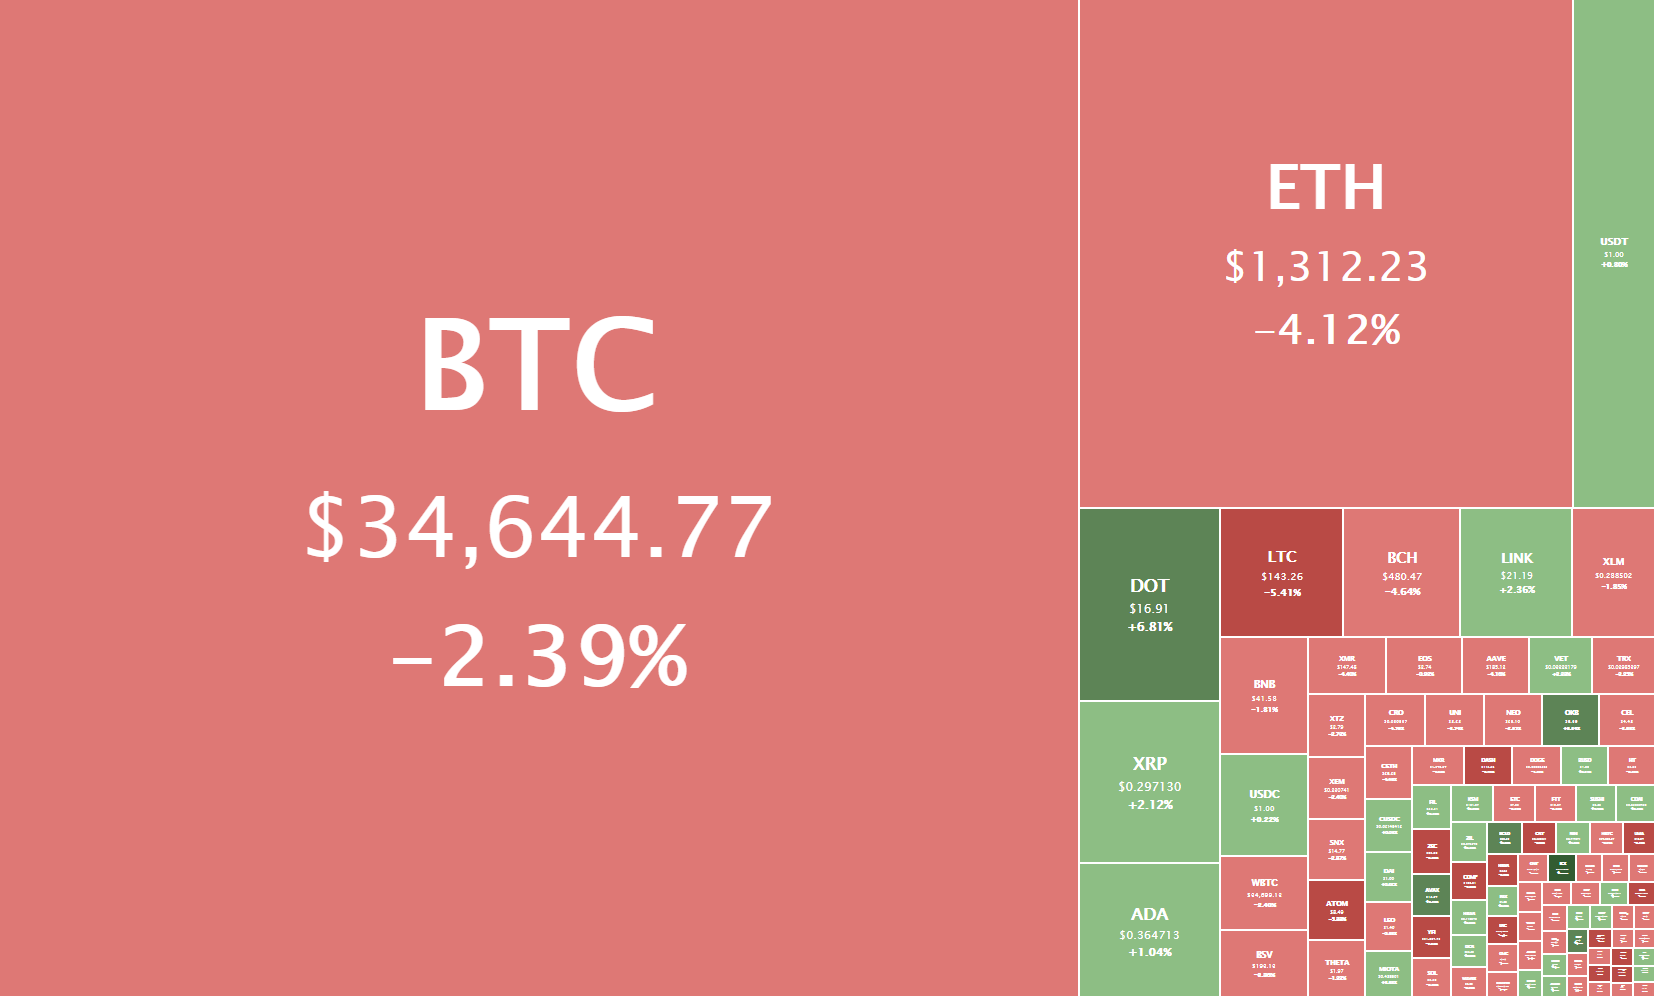
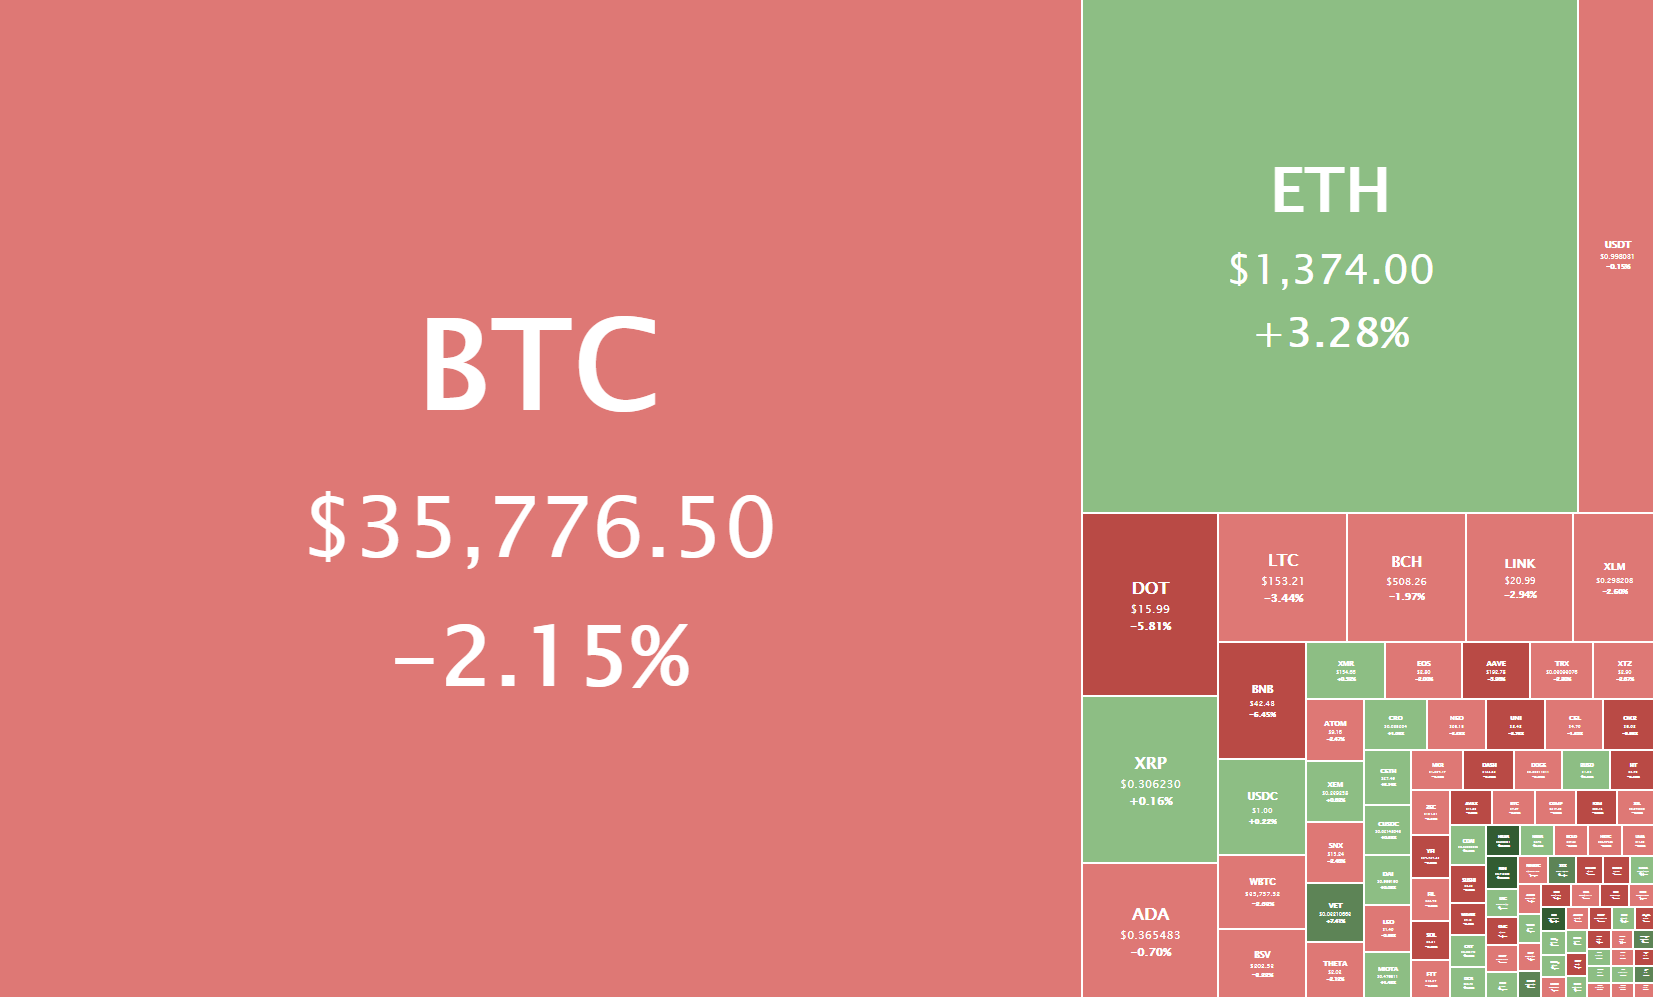
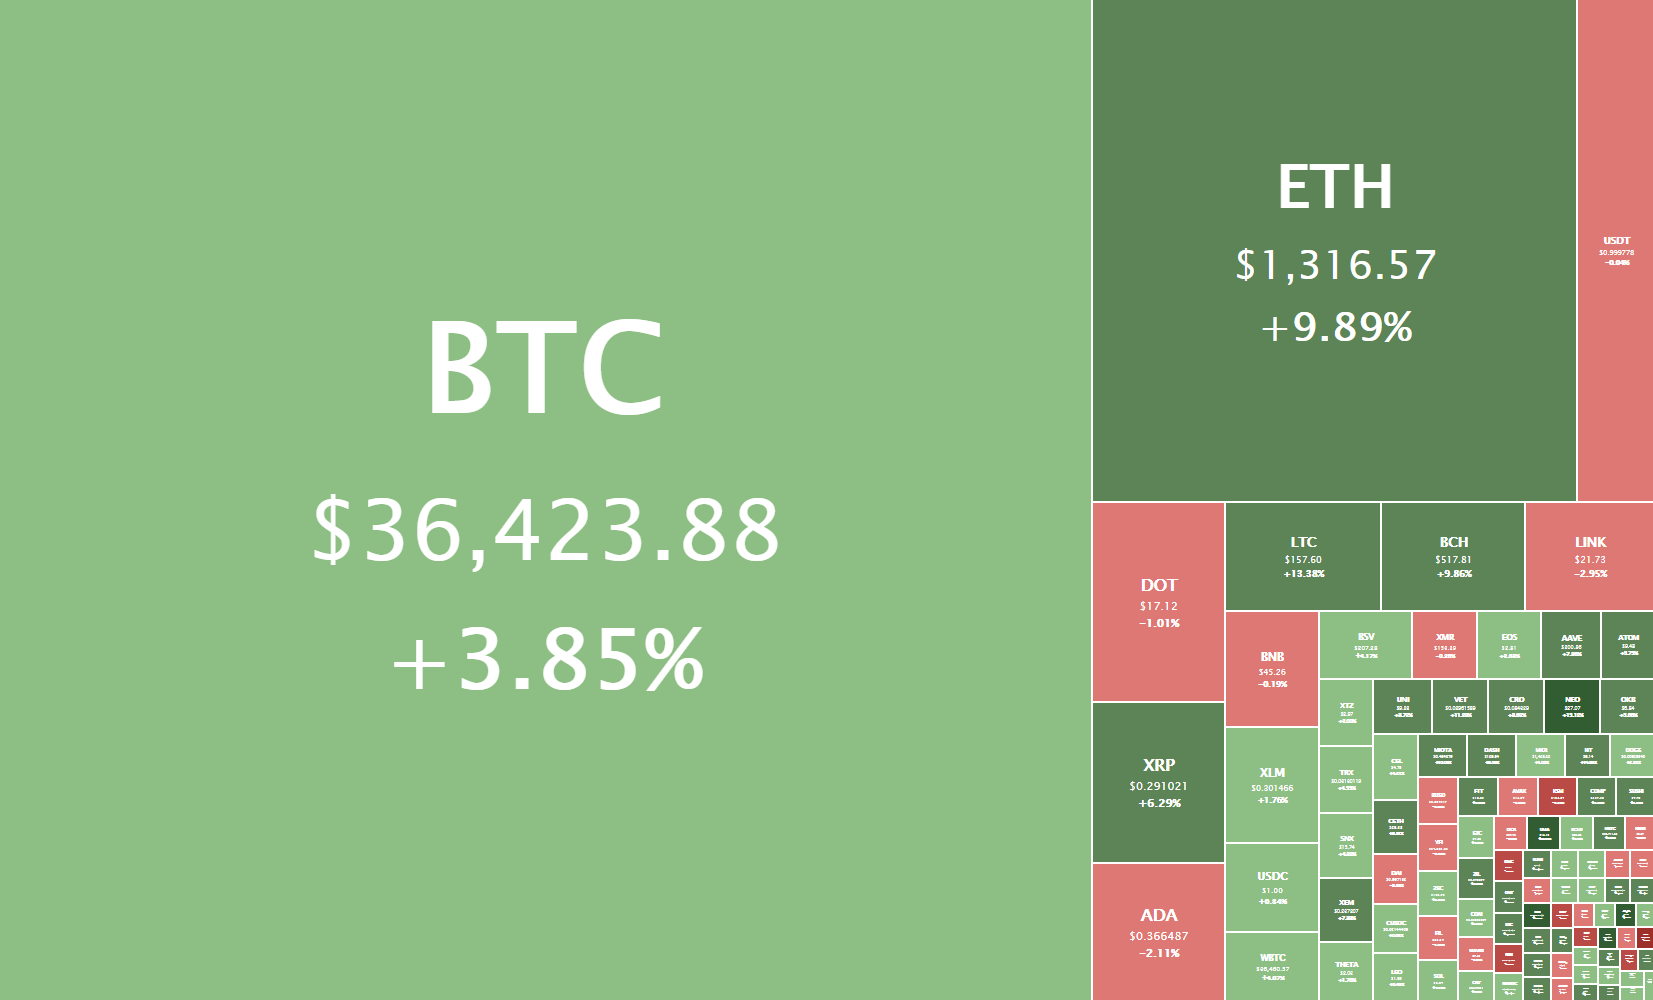
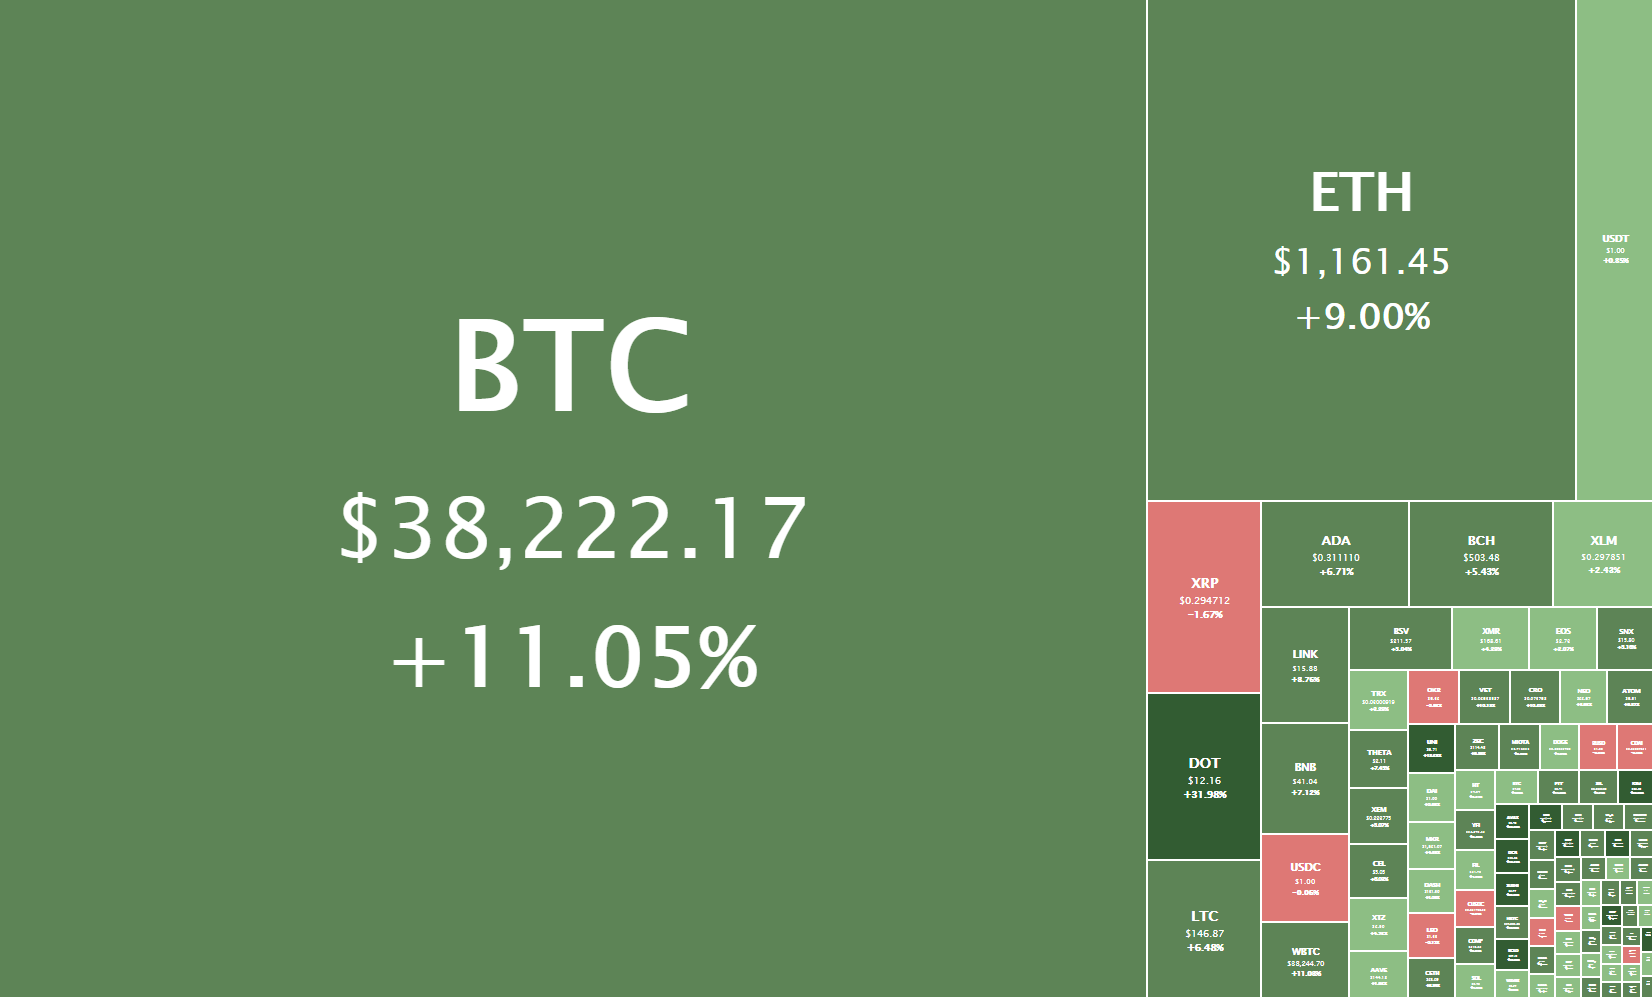
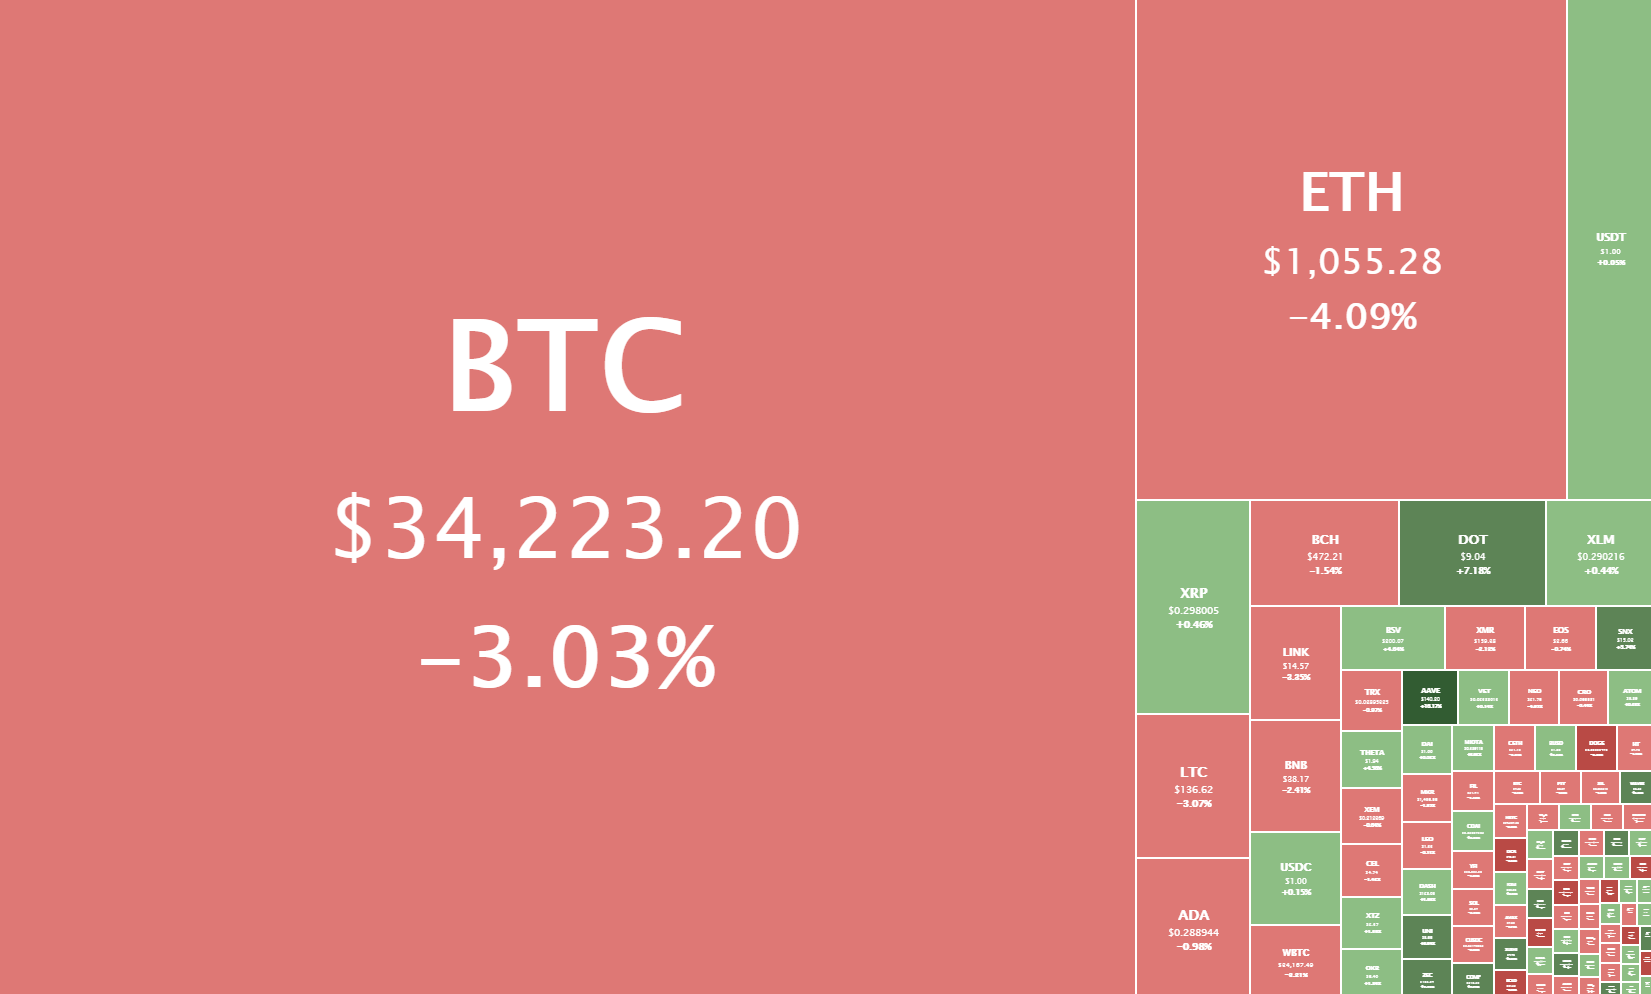
Bitcoin Is the big cryptocurrency, it is the one that is in the mainstream media and it is the first one that the majority of people think about when you mention cryptocurrencies. So either through the fact that they do not know any others or the fact that it is the most popular, a lot of people who do not do currency trade may think that Bitcoin is the only cryptocurrency available to trade, the good news is that this is simply not the case.

Reality 2: Lots of assets available

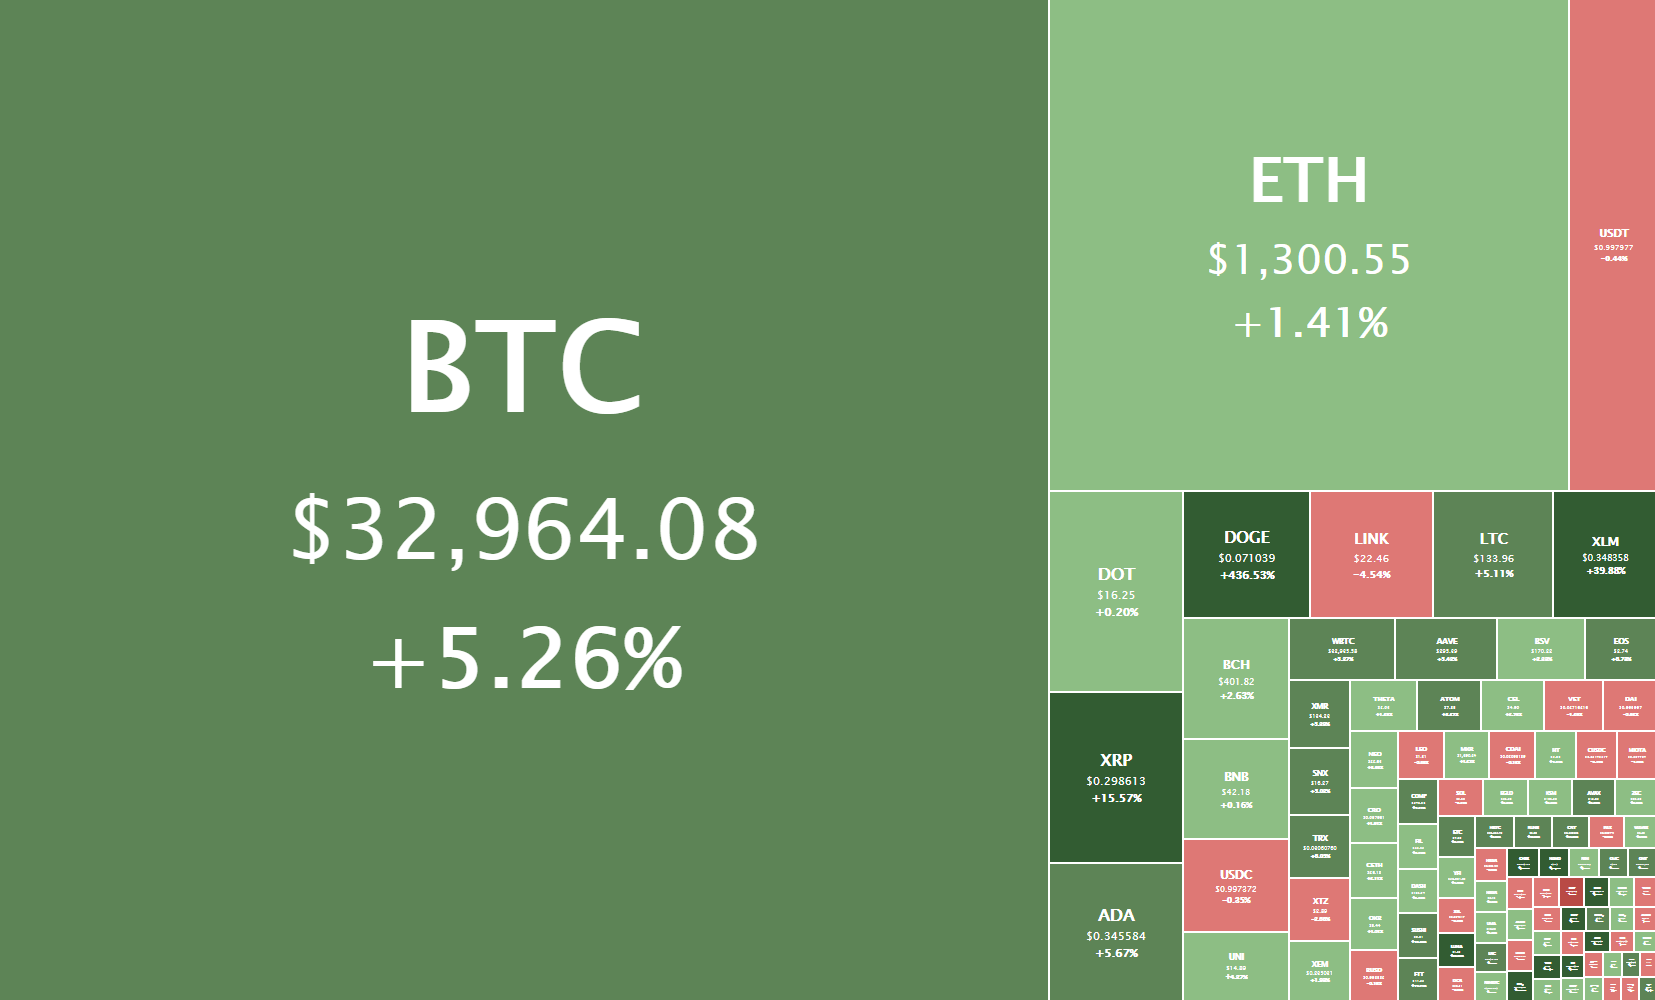
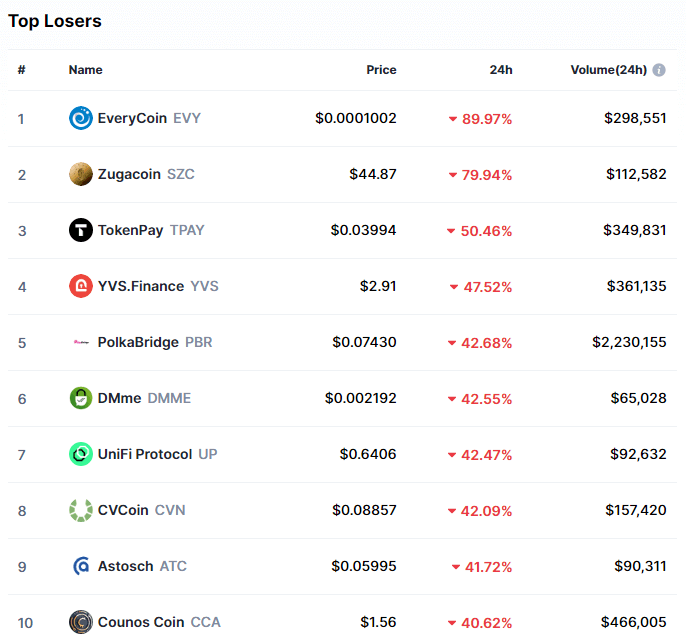
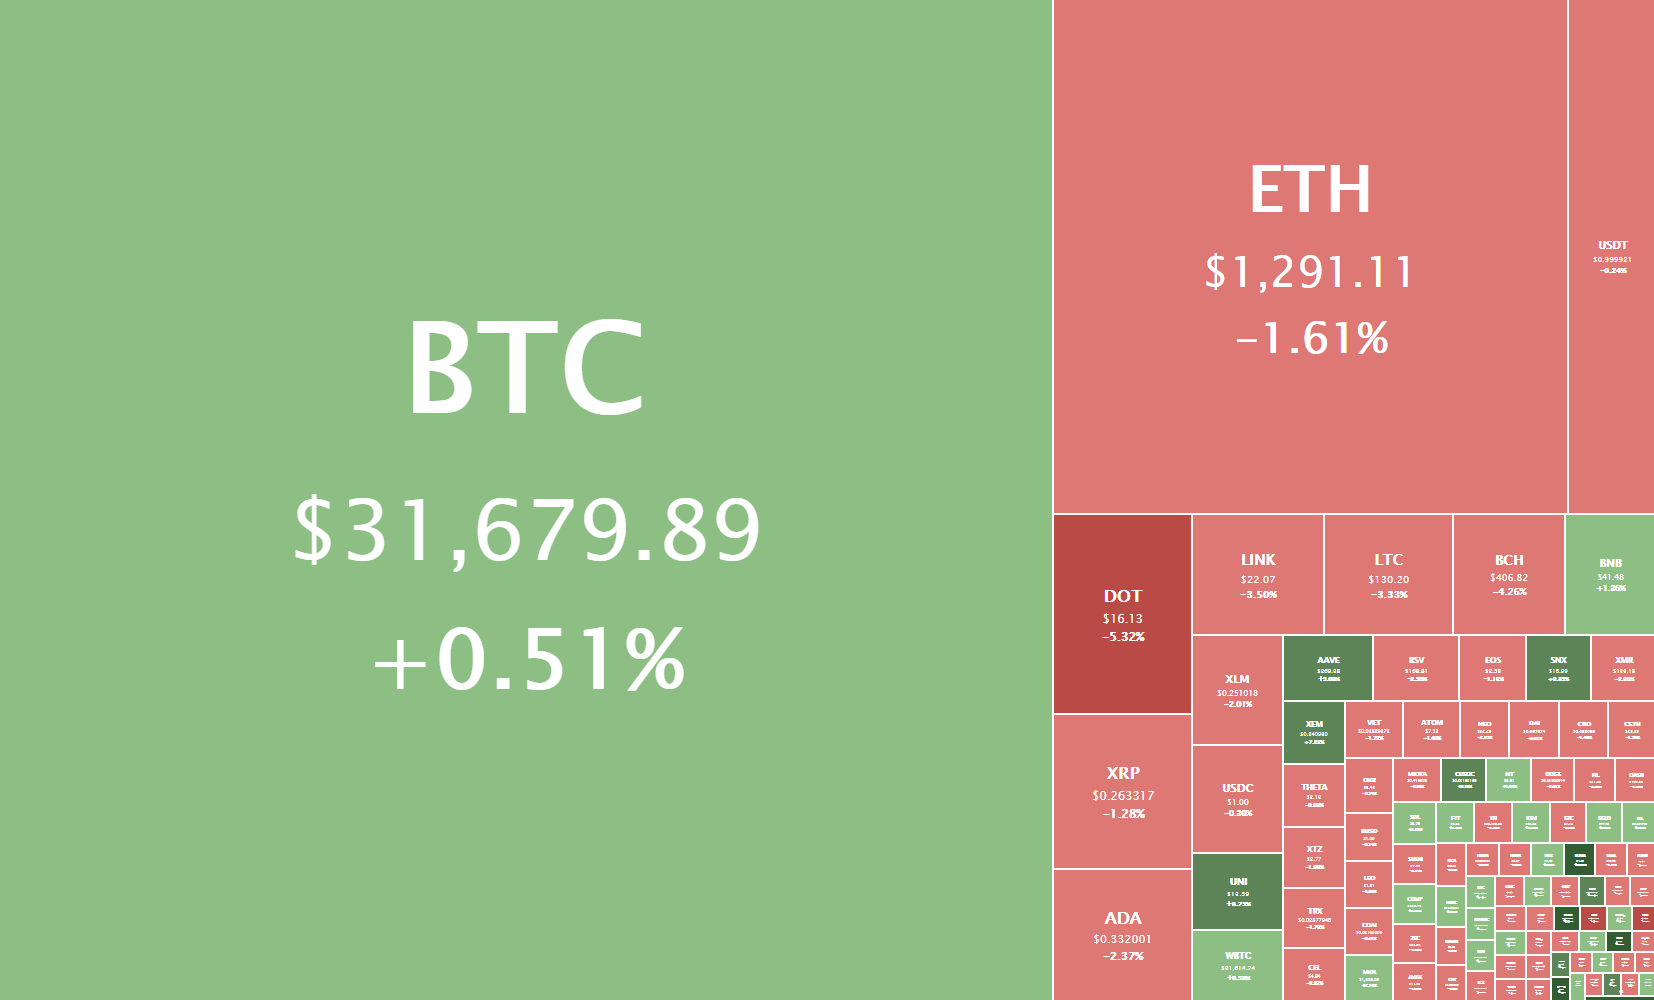
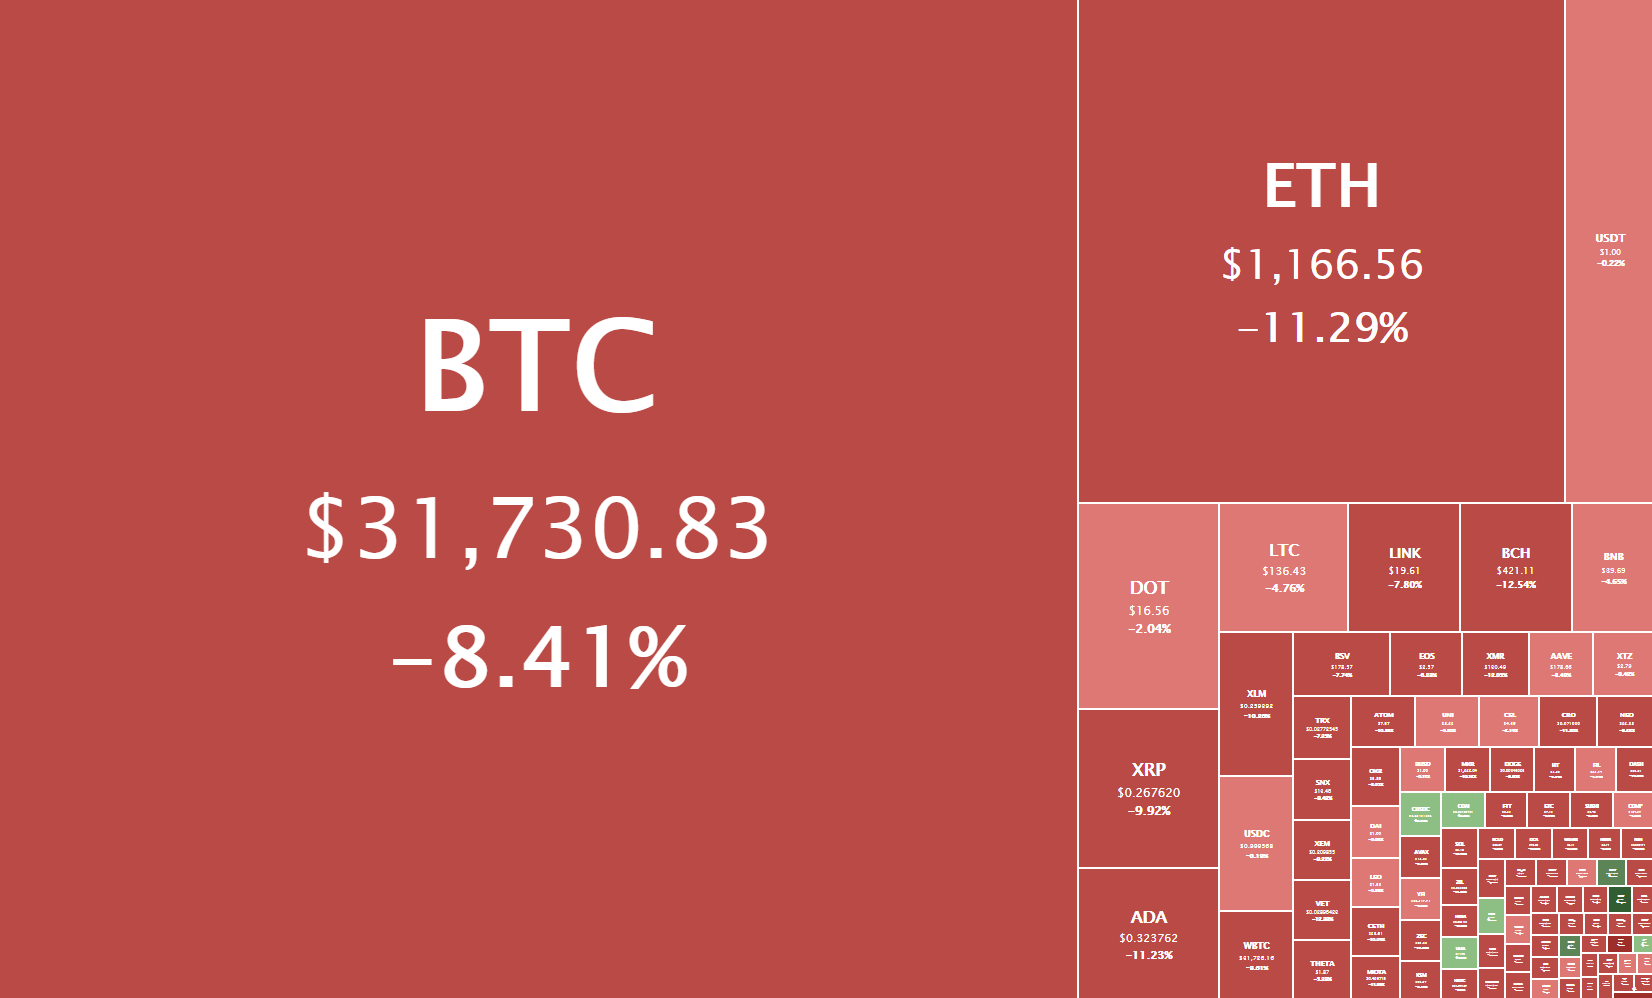
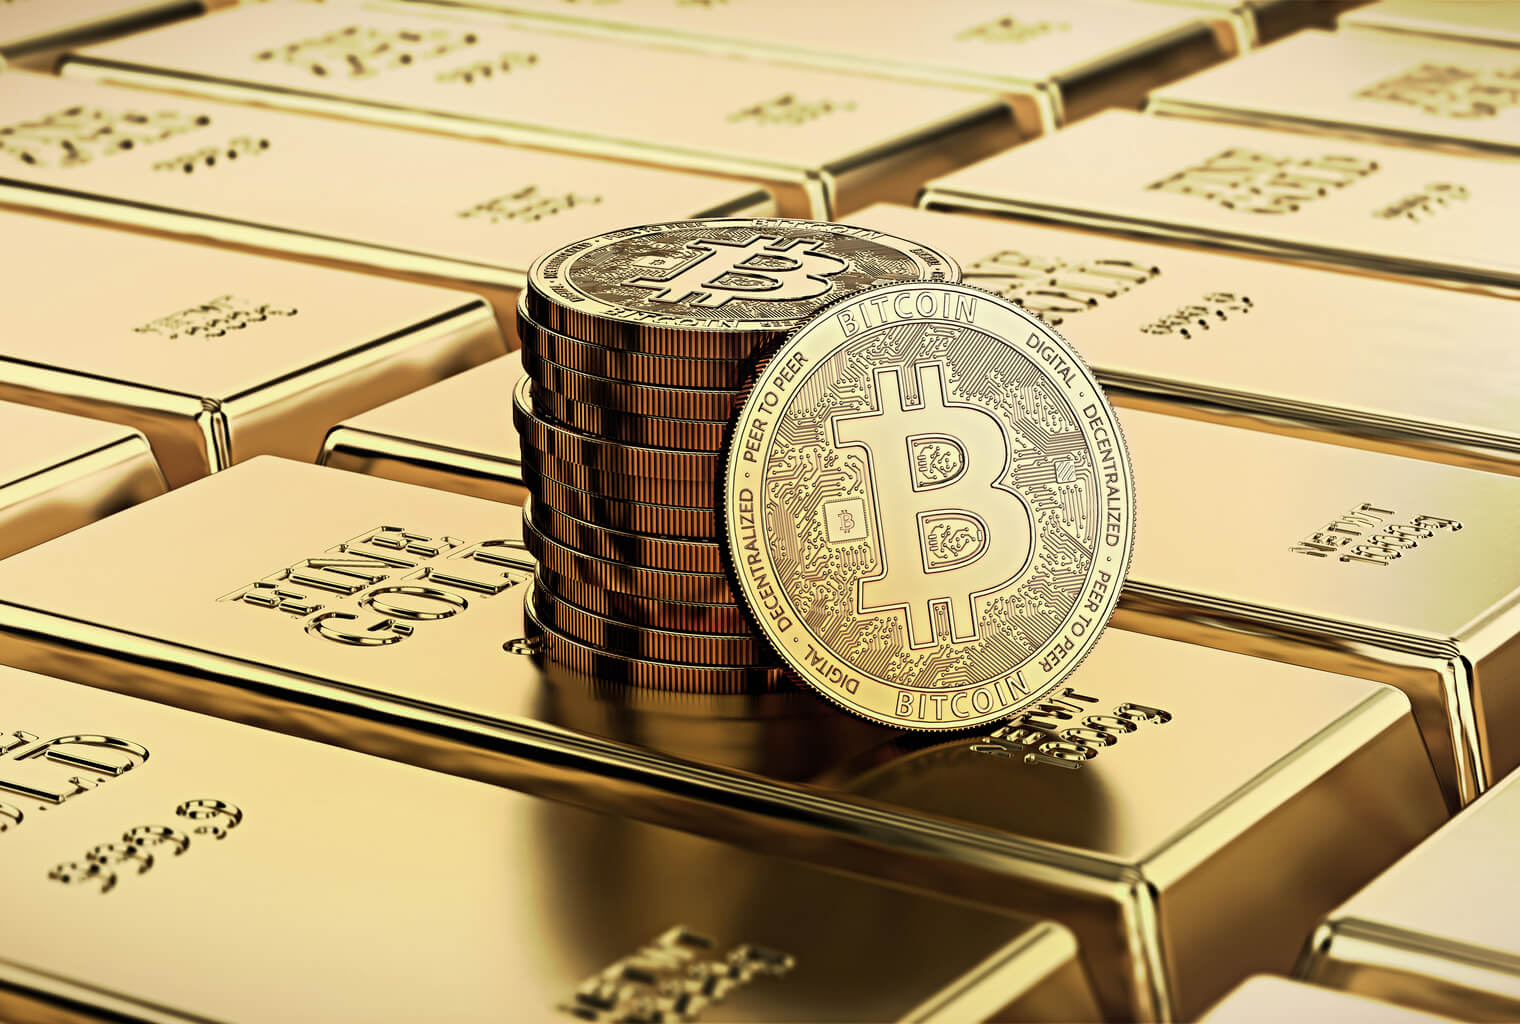
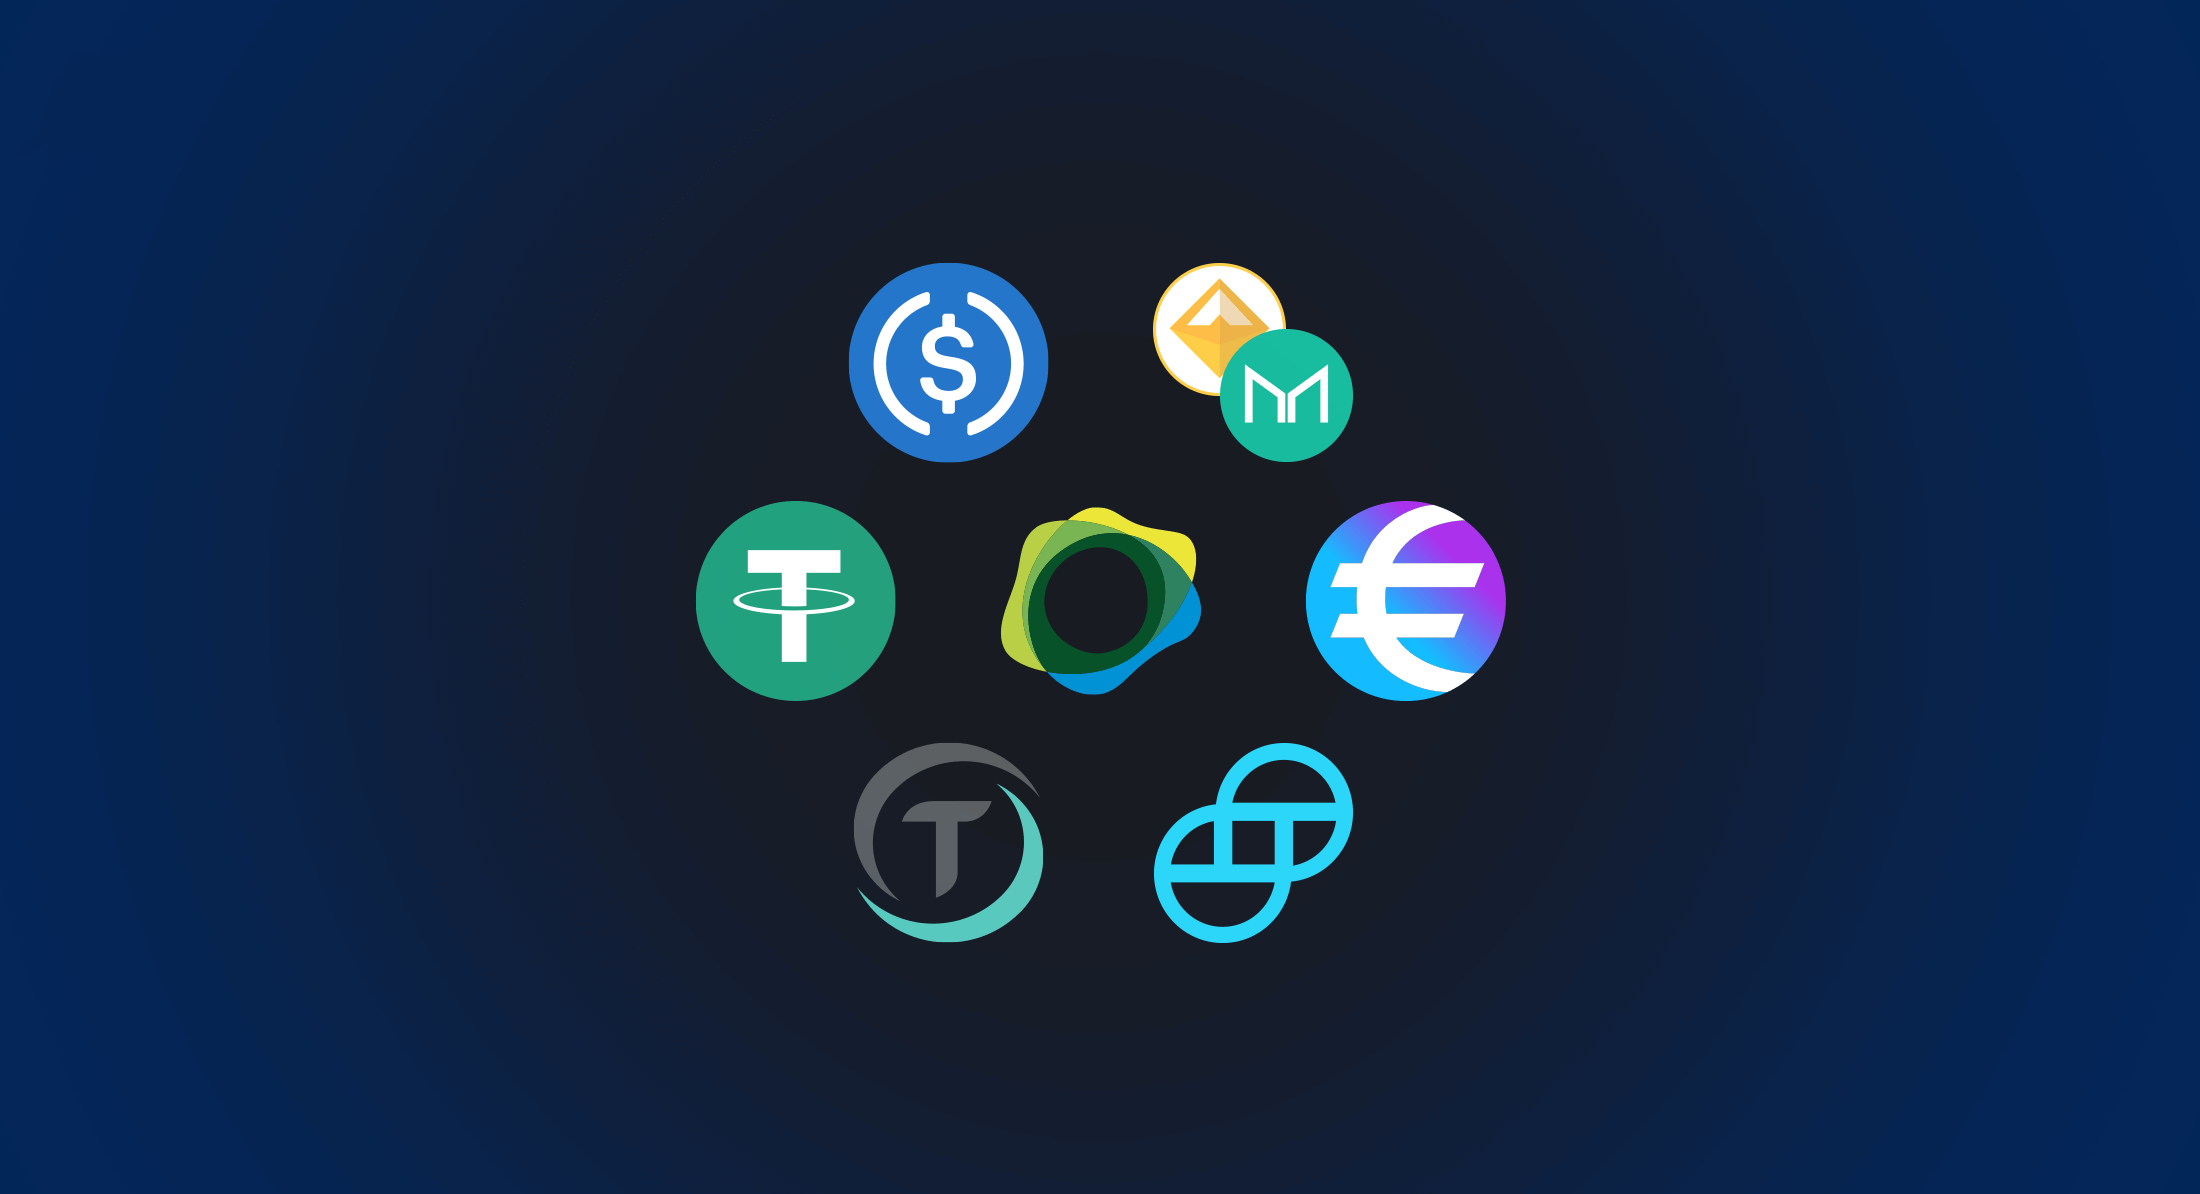
There are a lot of tradable assets when it comes to cryptocurrencies, both coins, and tokens. There Are a lot of brokers that are now beginning to offer crypto trading and even some brokers popping up that are specialising in it. These brokers are offering a lot more than just Bitcoin to trade, in fact, some of them now offer over 30 different pairs and cryptocurrencies. This number is continuing to grow as the industry does too. So while Bitcoin may be the popular one and the one that is traded the most, there is a lot of choices out there should you wish to try trading something different.

Expectation 3: Hard to get into

A few years ago, it was pretty difficult to buy cryptocurrencies, you had to go through a third party service or to buy from an owner directly, it was difficult to do, there were large fees and there were a lot of risks as no one could guarantee that you would get the coins after payment. You also needed to buy whole coins at some point which is thankfully not a thing anymore. The good news is that with the improvement in the infrastructure and technology it is no longer anywhere near as hard to get into.

Reality 3: Very accessible

Cryptocurrencies are becoming increasingly accessible for pretty much anyone. When it comes to trading the coins, h accounts that you open only need a deposit as low as $10 so people are no longer being priced out. There are also a lot of brokers that are offering it, from the big well-known brokers to new more specialised ones that are there only for crypto trading, some of which allow you to begin even without doing all the KYC stuff that a lot now require. If you are looking to get into crypto trading then it is very easy and very quick to do.

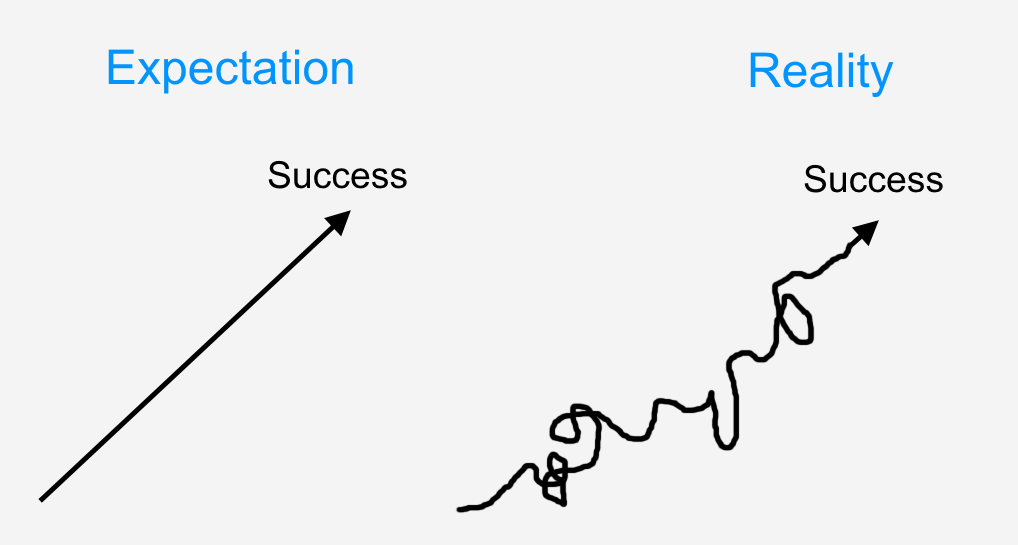
Expectation 4: It’s predictable compared to forex

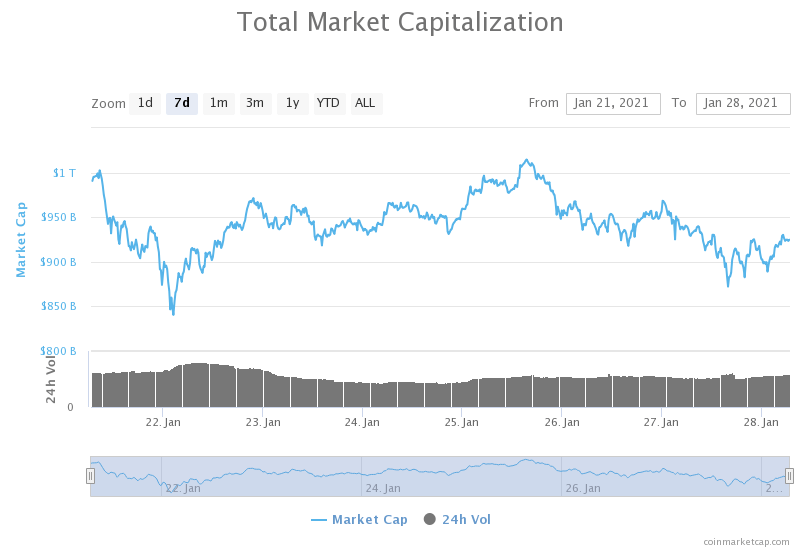
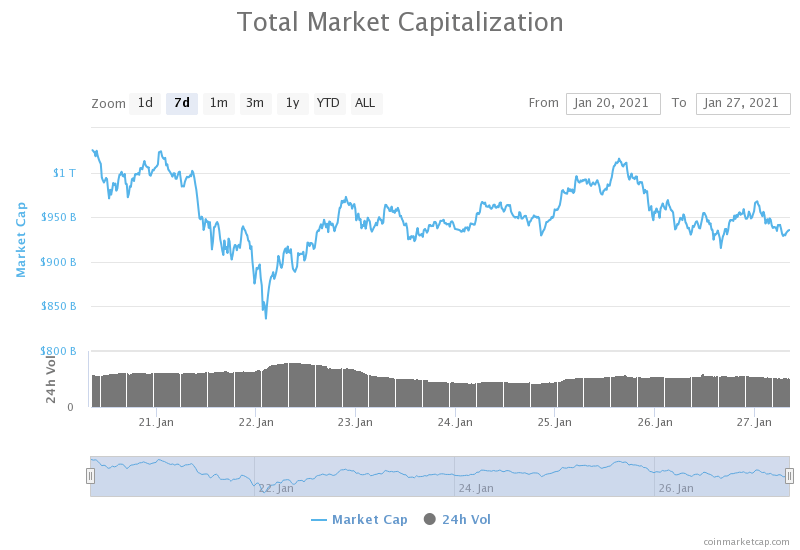
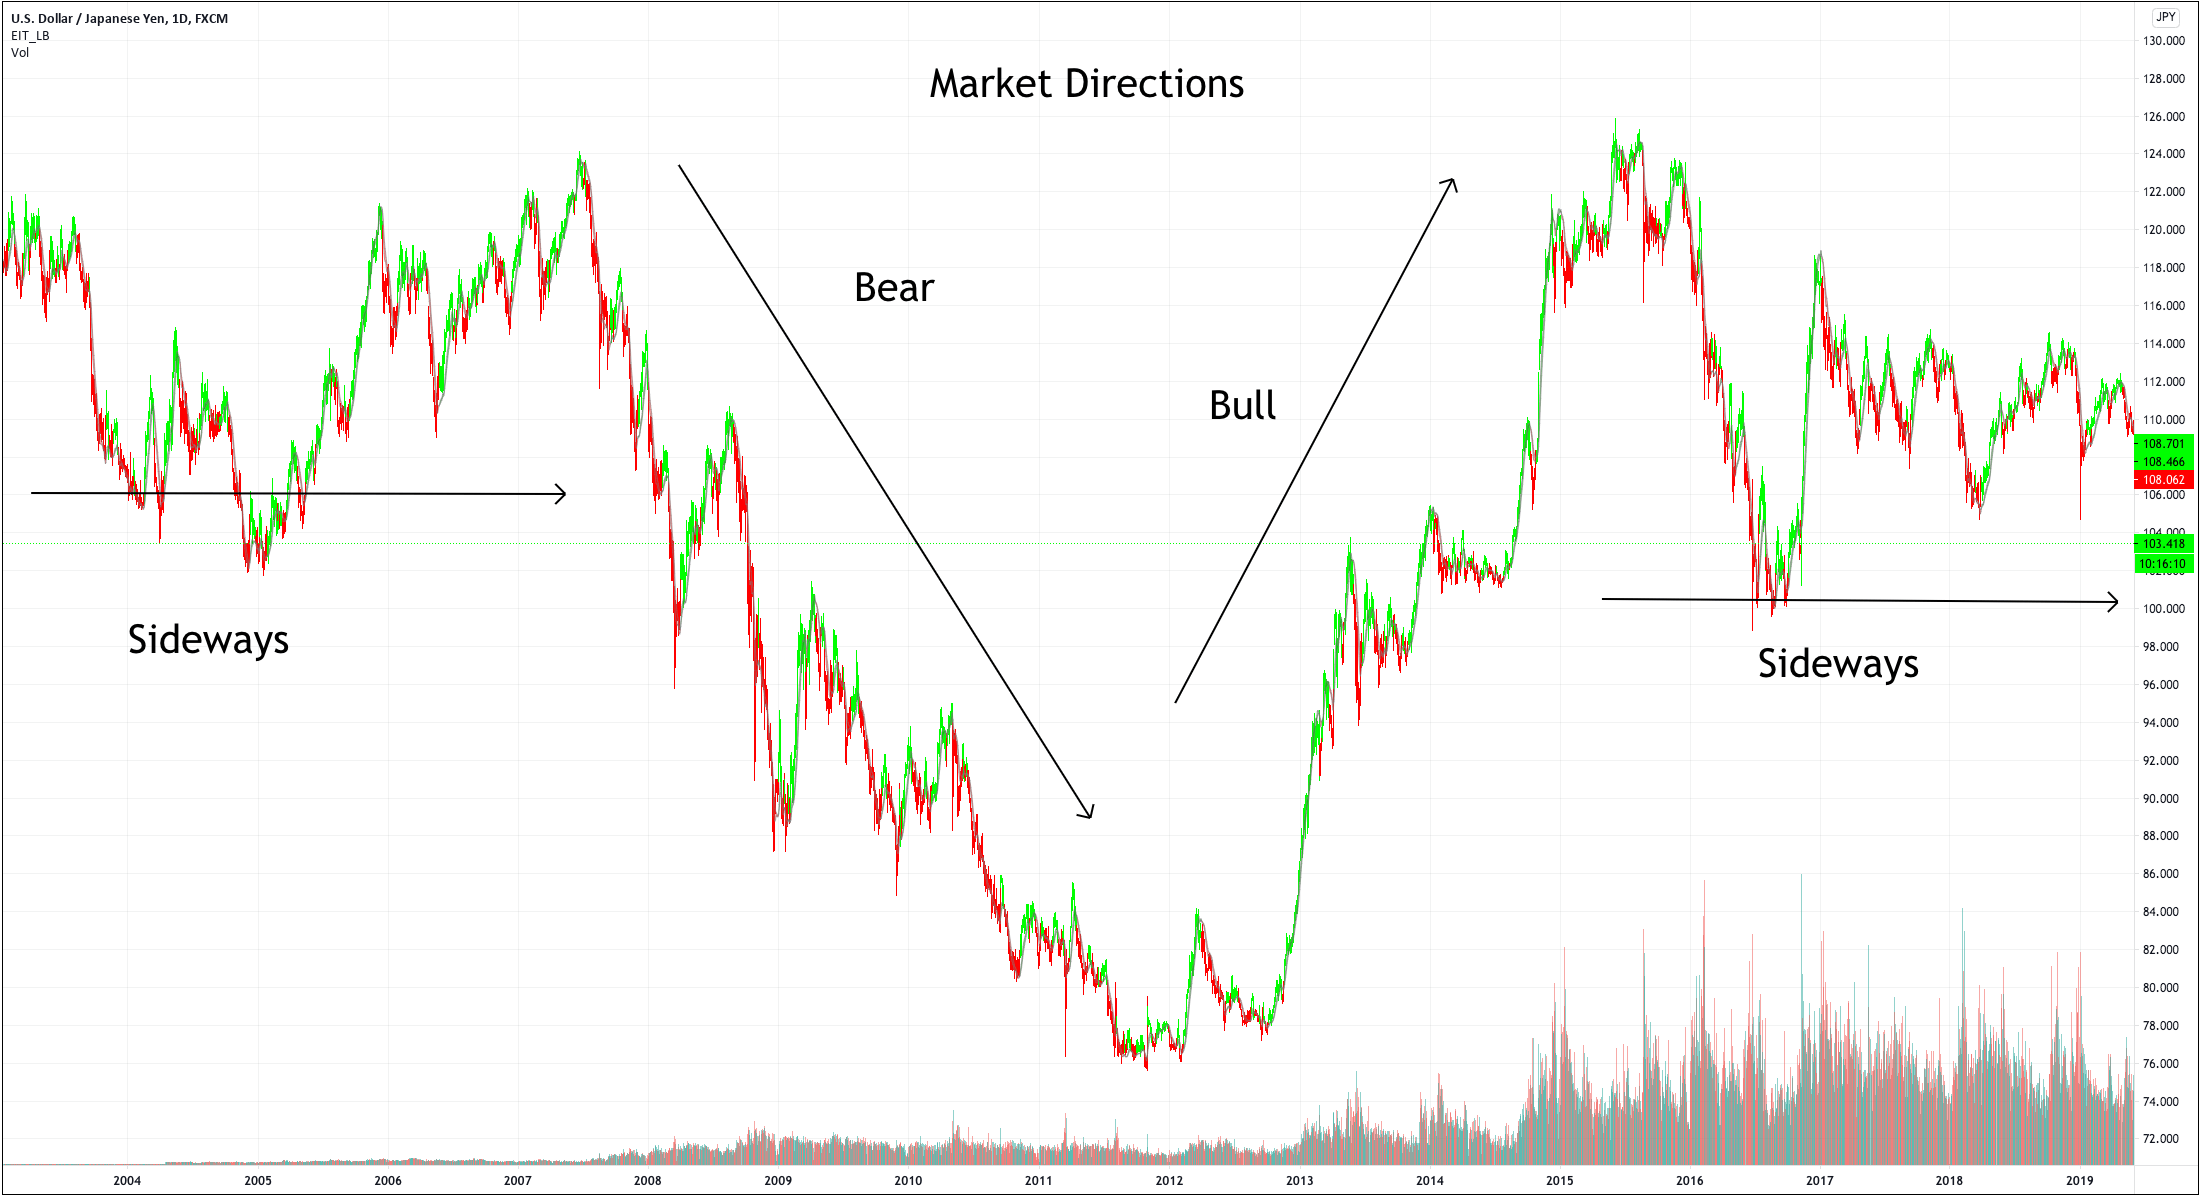
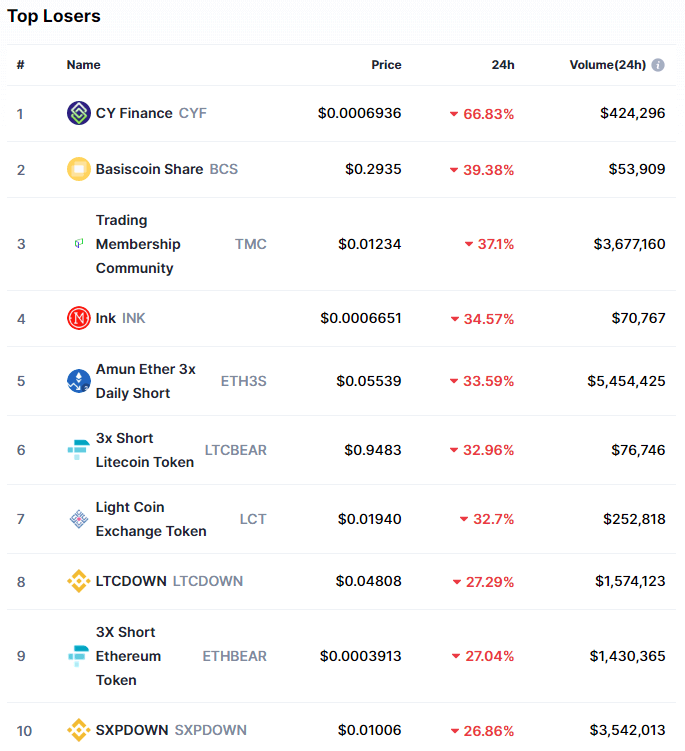
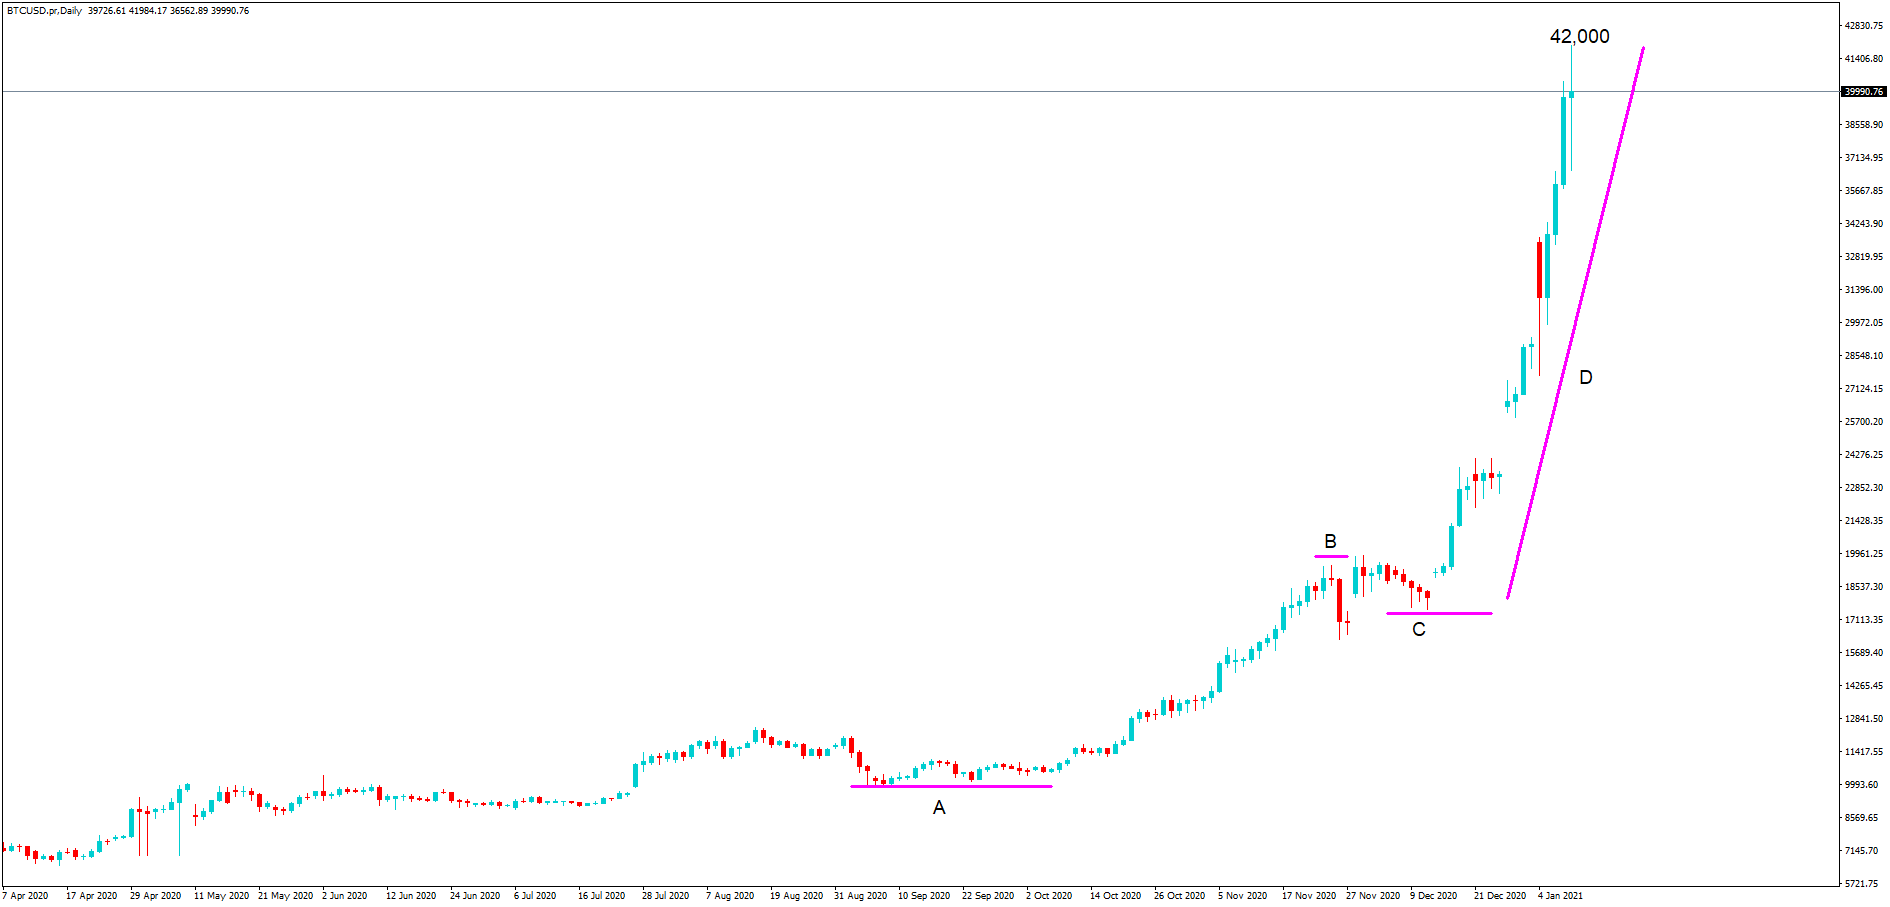
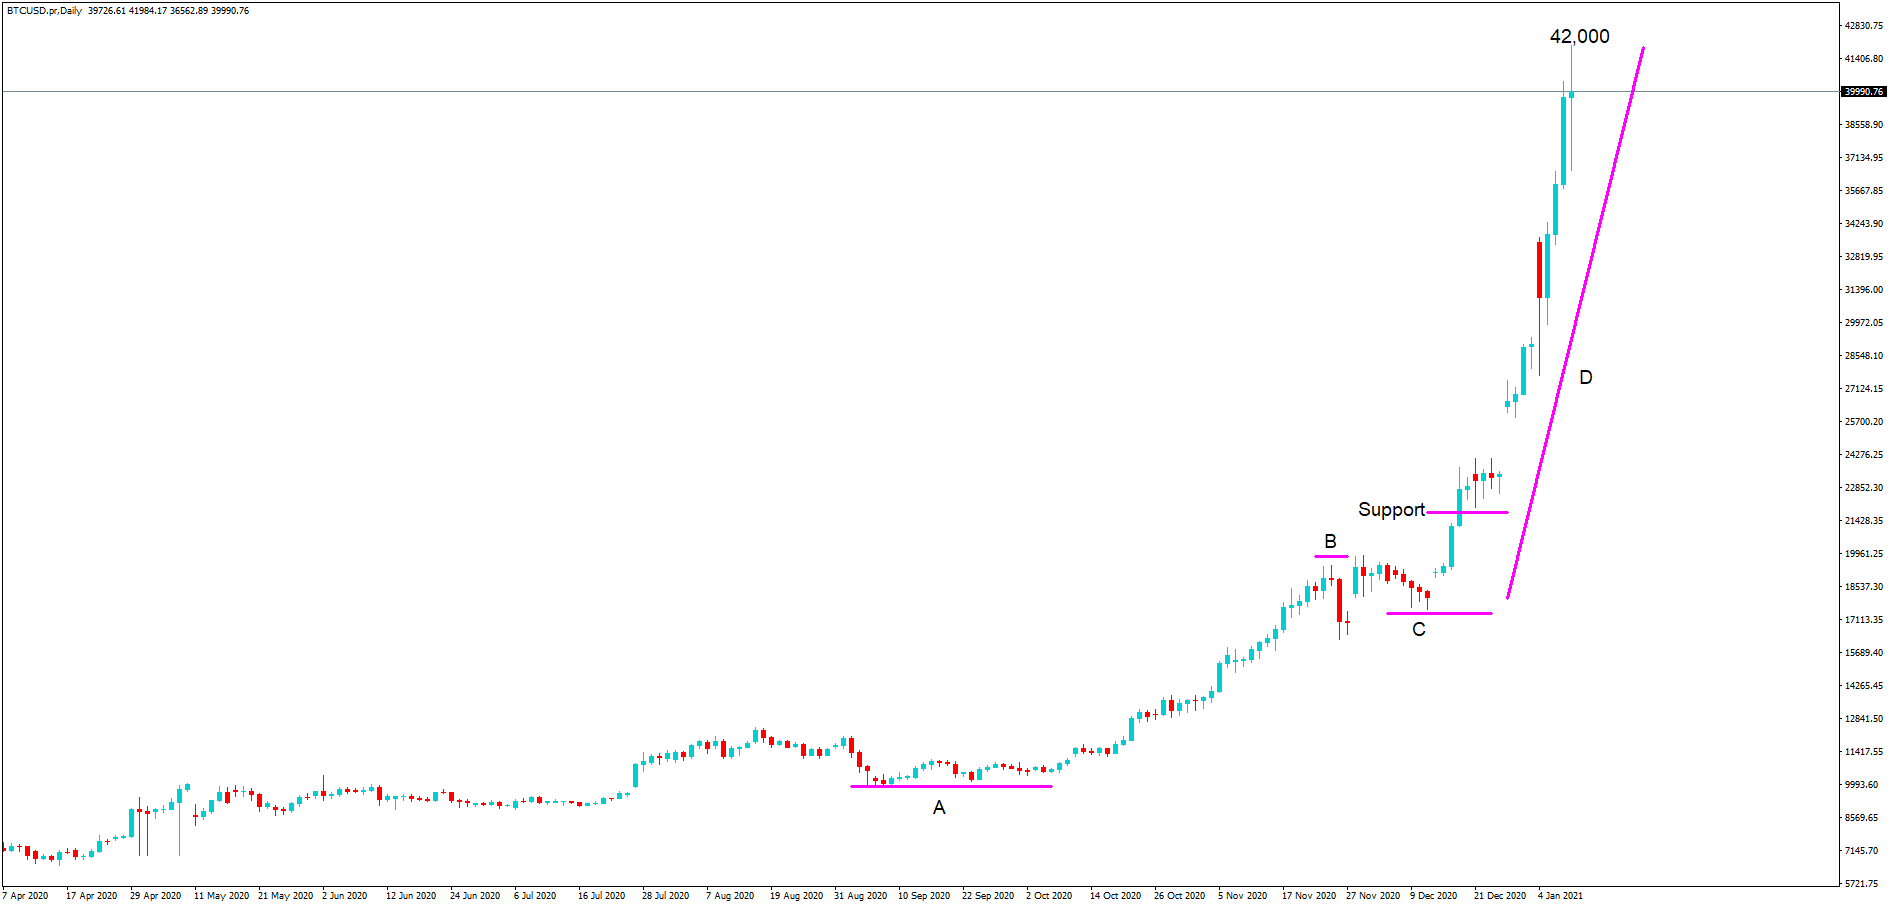
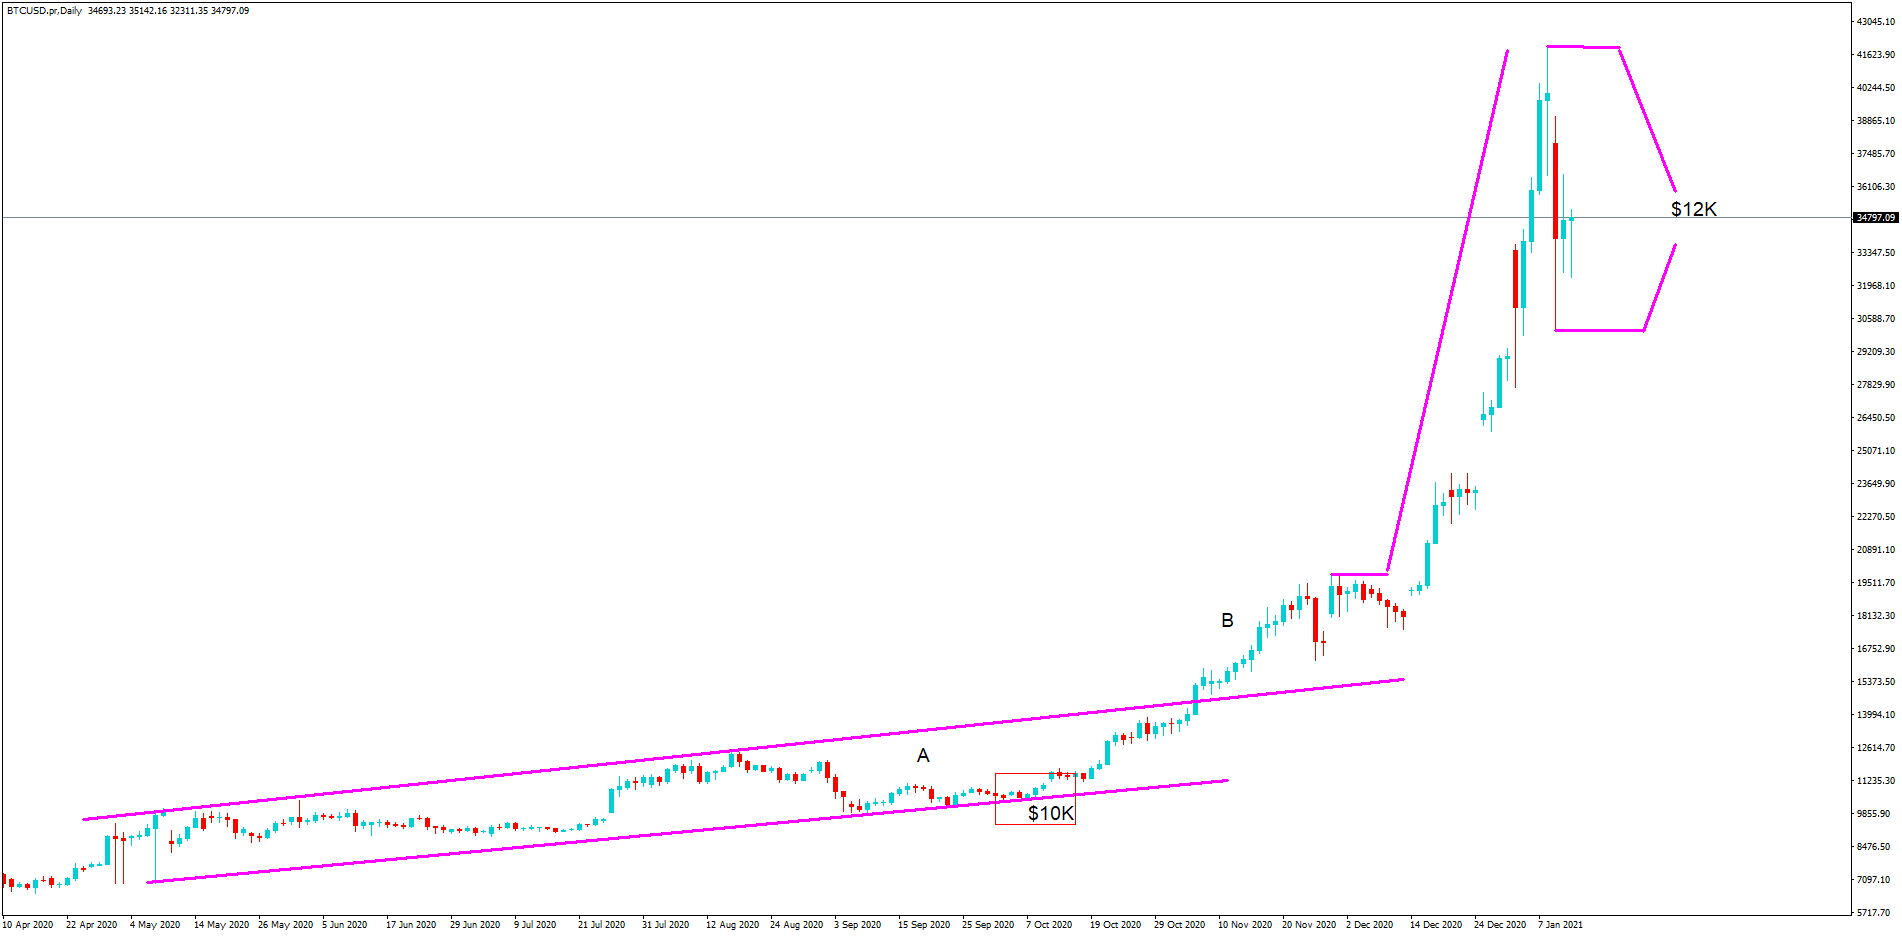
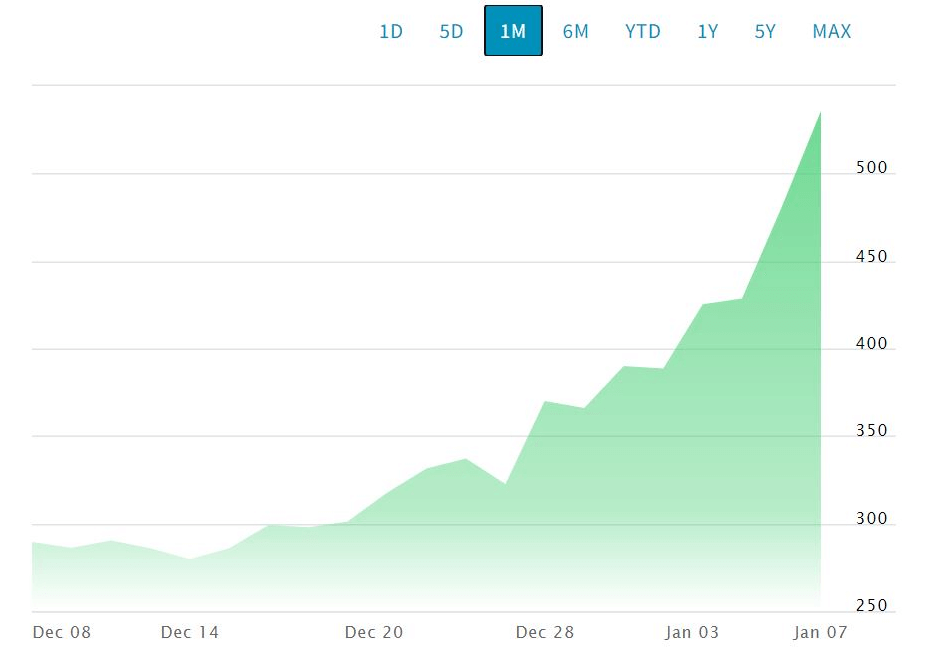
Crypto trading looks and feels very similar to forex trading, yet people seem to have the impression that it is far easier to predict, most likely due to the fact that it is not controlled by banks. Due to this, they think that it will be easier to work out whether the markets will go up or down. This impression could have come from the fact that the crypto world is still very new and so in the long run the prices have only been going up. While it was easy to predict the rise, it was not easy to predict the hundreds of drops that were in there too.

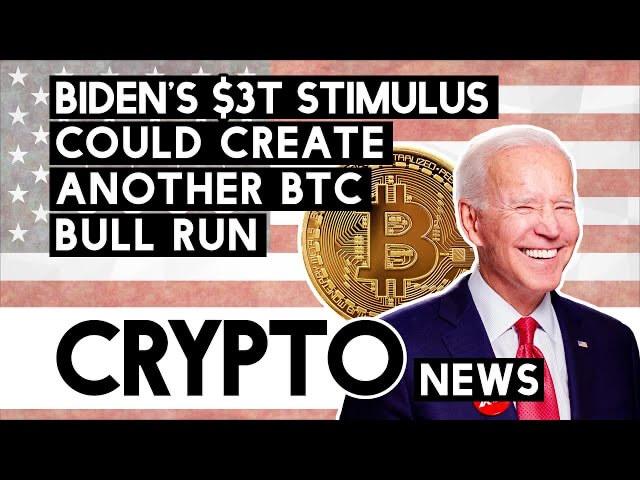
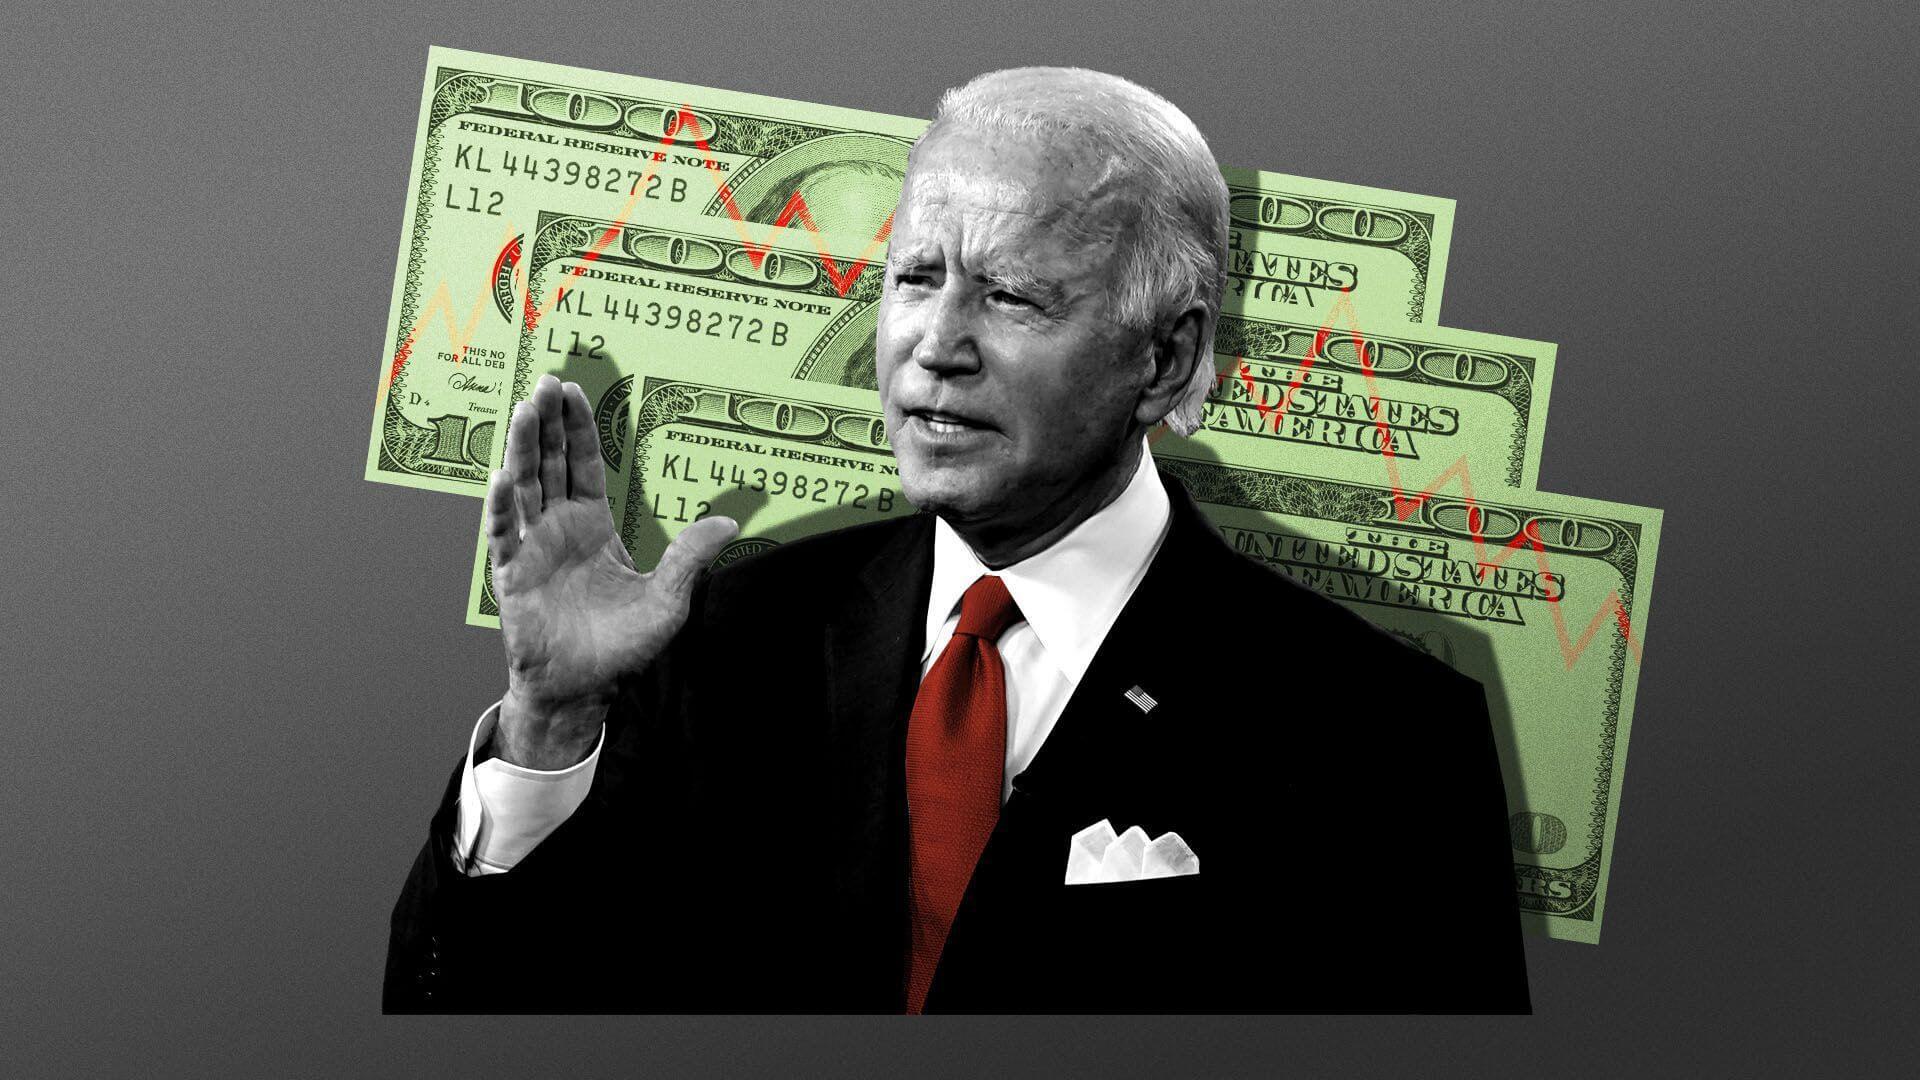
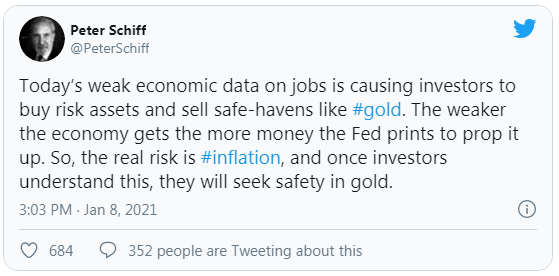
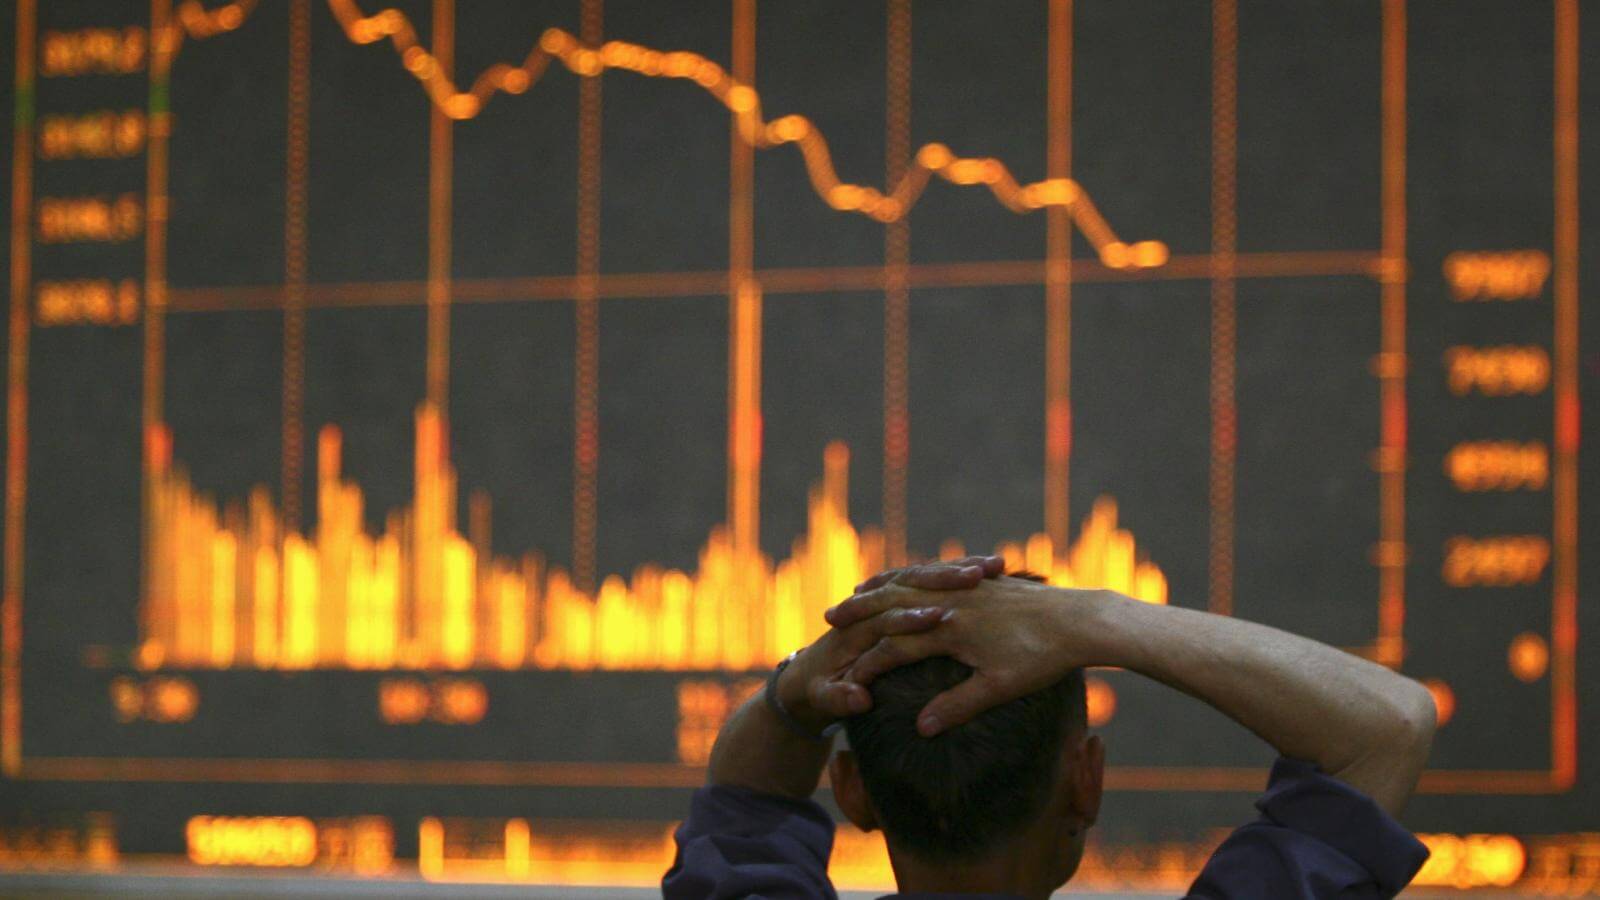
Reality 4: It’s influenced by whales but also the news

The problem with predicting the markets in the crypto world is that they can very easily be influenced by the larger holders. In fact, there have been plenty of times where the price has been stopped at the top or bottom by larger players placing millions and millions there in order to stop and influence the price. While a single person cannot influence it, a group of them can, which means that it is slightly harder to predict as a decision can be made at any time and the whales put their money in. The news can also have a huge effect, a major business taking it up or a country banning it can cause the price to jump and to really jump, thousands of dollars at a time, which can, unfortunately, catch a lot of people out.

Those are just some of the differences between the expectations and the realities of what people think and what actually is. The expectations are often seen through things like social media or the news which often only gets half the picture, when you start trading you will find that things are pretty different. Of course, some things will probably be pretty similar, but it is important to come into it with a clear mind and no expectations stuck in your head which could lead to disappointment.

Categories
Cryptocurrencies

Detailed Breakdown of Bitcoin’s Four Year’s Cycles

Up to 30 companies in Japan have announced plans to issue digital yen, and Rick Rieder, the CIO of BlackRock, is taking crypto seriously if his comments on CNBC are anything to go by. According to the world’s largest asset manager, the functionality and durable mechanism of crypto assets makes them more functional than gold, a fact that is up for debate.

It seems that the financial sector around the world is gradually embracing cryptocurrency, and it’s only a matter of time before it transitions to the mainstream. As a crypto investor, the current trend is satisfying. 

But is it time to make a move and laugh all the way to the bank?

Well, the most recent bitcoin highs had some investors rolling in a sense of accomplishment and success when they cashed out at the right time. Others waited for the prices to continue the upward trajectory above $41,000, but it is now on a free fall. 

Well, understanding the price movement of bitcoins is critical to make wise decisions. 

The popular theory that attempts to explain bitcoin’s price movement is bitcoins four-year cycles.

The price of bitcoin moves in cycles of booms and busts. If we were to learn anything from history, investors’ best financial decision has been to own bitcoin in a bull market.

Let’s examine the historical price behavior to have a better understanding of the bitcoin price volatility.

Price History of Bitcoin

Satoshi Nakamoto invented the cryptocurrency in 2008, and in the following year, the first transaction took place between him and an early adopter. The first real-world transaction took place when a bitcoin miner used bitcoins to buy pizzas in 2010 in Florida.

Bitcoin’s trading history is characterized by volatility since its creation in 2009. It has a reasonably short life, but it has seen a lot of action. One upon a time, the cryptocurrency traded for next to nothing, and the real price increase was from $0.0008 to $0.08 for a single coin. 

All along, bitcoin has been through significant rallies and crashes. Regardless, interest in bitcoin has surged in 2020 and is expected to continue in 2021. By 2020, the crypto-currency had recouped all its losses to record an all-time high. 

The Stages 

Stage 1: Exponential Highs

At this phase, the fear of missing out (FOMO) and euphoria among bitcoin investors is at its highest. The emotions compel many people to purchase at abnormally high prices leading to a prolonged bull trend that pushes the prices through the roof.

The high exponential stage is also called “topping out,” where the bitcoin prices reach their peak. 

Stage 2: Correction

The correction stage comes immediately after the euphoria that characterized the previous 12 months. The stage corrects for over-optimism by shedding considerable valuation.

Profit-taking investors create a sell-side pressure, which causes the bitcoin to drop a bit after an abnormal growth.

Stage 3: Accumulation and Recovery

Following the price correction, the sell-side momentum starts to slow down and bottom out. It is at this stage that bargain buyers take advantage of the discounted prices to accumulate bitcoins. 

Eventually, new demand starts to form, and the phase becomes a point of maximum financial opportunity where the prospect of reward overtakes that of the associated risk. The new growing demand is driven by the desire to make enormous profits. 

Stage 4: Continuation

After bottoming out, bitcoin starts to go up. Historically, the continuation stage has been all about exceeding the sell-side pressure characterized by sellers resisting the growing prices.

The continuation stage is an essential technical step that indicates a shift in market psychology. The stage tends to encourage strong emotions to result in buy-side momentum. Following a successful 12-month close, the market psychology then transitions to buying from selling.

The Effect of Bitcoin Halving 

Bitcoin halving occurs when the value of new bitcoin created every 10 minutes is halved. The latest bitcoin halving reduced the block reward of 12.5 to 6.25 every 10 minutes. 

Typically, bitcoin halving marks a fundamental variation in the protocol of the cryptocurrency. The event also has a significant impact on the prices of the bitcoin as well. It acts as a catalyst to propel the prices to new heights. 

Given that 21 million is the maximum supply cap, the halving event means that it will take much longer for all the bitcoin to go into circulation. It also means that all the bitcoins created will be less and less, limiting the supply. The scarcity of bitcoins increases value, which is why bitcoin halving acts as a catalyst in the new bull market. 

In the past, the bitcoin price has grown exponentially following the halving events. This observation can be used to explain the current situation.

The bitcoin’s next phase one was expected to be in 2021 to manage a 12-month candle close above the price level of ~$14,300. It has clearly exceeded this.

The belief was that the $20,000 mark will spur the buy-side momentum driven by investors’ intense emotions.

The 12-month price chart indicated that ~$14,300 may actually be the inflexion point in market psychology. Based on the 4 Year Cycle historical trends, a candle close above ~$14,300 provides the necessary confirmation that the prices may go above $20,000 in 2021. That is just what happened based on the current prices. 

Current Bitcoin Situation and Interpretation

A few days ago, on 8th January 2021, the world’s largest and most popular cryptocurrency was posting highs of $41,962. It is now just above $30,000, recording losses of up to 20%. Bitcoin is in free fall, which has already wiped $130 billion off the market.

The fall in prices comes after the UK Financial Conduct Authority warned investors that they could lose everything based on difficulties in valuing crypto assets and price volatility. 

However, the problem is that the price volatility will pique the interest of individual investors whose ability to take on significant losses is a far cry compared to institutional investors.

Since bitcoin was created, the debate has raged about whether the abnormal rises in prices constitute market bubbles or are objective indicators of its future role in the financial ecosystem. A market bubble is when the asset value becomes over-inflated.

Some investors will see the latest bitcoin rise and fall as a bubble that has burst. On the other side of the spectrum, some experts believe the bitcoin fluctuations are nothing out of the ordinary and will continue to occur towards its eventual valuation.

The considerable upside swings followed by corrections are normal behaviour and confirm the bitcoins four year cycles is more than just a theory. 

Bitcoin prices were in the first stage of exponential growth to reach an all-time high of $41,962. Apparently, the cryptocurrency is now in the correction stage before it enters the accumulation and recovery phase, and eventually, continuation.

Final Word

As with any other new technology, bitcoin prices are highly volatile, but it’s normal behavior. Based on the four-year cycles, bitcoin was experiencing exponential growth towards the start of January 2021, but it is now in the correction stage. The slashing of up to 20% of its value is just a normal phase of correction and nothing to cause panic.

Bitcoin investment is not for the faint-hearted. It is only for those with higher risk tolerance levels, sufficient exposure to the asset class, and a long term view of the technology. It would be best if you never lost sight of the big picture. Focus on the forest as opposed to a single tree. Happy trading, folks! 

Categories
Forex Daily Topic Forex System Design

Trading Algorithms IX – RSI Failures System

Trading the naked RSI system depicted in this series’s previous video as an overbought/oversold signal generator is too risky, and its long-term results questionable. The system is profitable only in sideways movements. Thus, a trending filter or a detrending step will be needed to avoid the numerous fake signals.

Divergences and Failure swings

Welles Wilder remarks on two ways to trade the RSI: Divergences and Top/Bottom failure swings.

Divergences

A divergence forms when the price makes higher highs (or lower lows), and the RSI makes the opposite move: lower highs (or higher lows). RSI divergences from the oversold area show the market action starts to strengthen, an indication of a potential swing up. In contrast, RSI divergences in the overbought area show weakness and a likely retracement from the current upward movement.

Failures

An RSI Top failure occurs with the following sequence of events:

  1. The RSI forms a pivot high in the overbought area.
  2. An RSI pullback occurs, and an RSI pivot low forms.
  3. A new RSI pivot high forms, which is lower than the previous pivot high

Fig 1 – RSI TOP failures in the EURUSD 4H 2H Chart

An RSI Bottom failure occurs with the following sequence of events:

  1. The RSI forms a pivot low below the oversold area.
  2. An RSI pullback occurs, and an RSI pivot high forms.
  3. A new RSI pivot low forms, which is higher than the previous pivot high.

Fig 2 – RSI Bottom failures in the ETHUSD 1H Chart.

According to Welles Wilder, trading the RSI failure swings can be more profitable than trading the RSI overbought-oversold system. Thus, we will test it.

The RSI Failure algorithm

To create the RSI Failure algorithm, we will need to use the Finite State Machine concept, presented in this series’s seventh video.

The Easylanguage code of the RSI system failure is the following:

inputs:  Price( Close ), Length( 14 ), OverSold( 30 ), Overbought( 70 ), 
takeprofit( 3 ), stoploss( 1 ) ;
variables: state(0), state1 (0), state2(0), state5 (0), state6(0), rsiValue(0),
 var0( 0 ), rsi_Pivot_Hi(0), rsiPivotHiFound(False), 
rsiPivotLoFound (False),rsi_Pivot_Lo(0)  ;

rsiValue = RSI(C,Length);

If rsiValue[1] > rsiValue and rsiValue[1] > rsiValue[2] then
      begin
         rsiPivotHiFound = true;
         rsi_Pivot_Hi= rsiValue[1];
     end

else
     rsiPivotHiFound = False;

If rsiValue[1] < rsiValue and rsiValue[1] < rsiValue[2] then
      begin
         rsiPivotLoFound = true;
        rsi_Pivot_Lo = rsiValue[1];
     end

else
     rsiPivotLoFound = False;

If state = 0 then
      begin
        if rsiPivotHiFound = true and rsi_Pivot_Hi> Overbought then
             state = 1    {a bearih setup begins}
     else
           if rsiPivotLoFound = True and rsi_Pivot_Lo < OverSold then
                 state = 5; {a bullish Setup begins}
     end;

{The Bearish setup}    

If state = 1 then
      begin
         state1 = rsi_Pivot_Hi;
         if rsiValue > state1 then state = 0;
         if rsiPivotLoFound = true then
             state = 2;
     end;
    
If state = 2 then
      begin
         state2 = rsi_Pivot_Lo ;
         if rsiValue > state1 then state = 0;
         if rsiPivotHiFound = true then
         if rsi_Pivot_Hi< 70 then state = 3;
     end;

If state = 3 then
     if rsiValue < state2 then state = 4;

If state = 4 then
      begin
        sellShort this bar on close;
        state = 0;
     end;


{The bullish setup}

If state = 5 then
      begin
       state5 = rsi_Pivot_Lo;
       if rsiValue < state5 then state = 0;
       if rsiPivotHiFound = true then
             state = 6;
     end;


If state = 6 then
      begin
         state6 = rsi_Pivot_Hi;
         if rsiValue < state5 then state = 0;
         if rsiPivotLoFound = true then
             if rsi_Pivot_Lo > OverSold then state = 7;

     end;
           

If state = 7 then
     if rsiValue > state6 then state = 8;

 If state = 8 then
      begin
         buy this bar on close;
         state = 0;
     end;
   

If state > 0 and rsiValue < OverSold then state = 0;
If state > 0 and rsiValue > Overbought then state = 0;    

{The Long position management section}

If marketPosition =1 and close < entryprice - stoploss* avgTrueRange(10) then
    sell this bar on close;

If marketPosition =1 and close < entryPrice + takeprofit* avgTrueRange(10) then
    sell this bar on close;


{The Short position management section}


If marketPosition =-1 and close > entryprice + stoploss* avgTrueRange(10) then
     BuyToCover this bar on close;

If marketPosition =-1 and close < entryPrice - takeprofit* avgTrueRange(10) then
     BuyToCover this bar on close;

The results, measured on the EURUSD, are not as brilliant as Mr. Welles Wilder stated.

The trade analysis shows that the RSI Failures system, as is, is a losing system. This fact is quite common. It takes time to uncover good ideas for a profitable trading system. In the meantime, we have developed a practical exercise using the finite state machine concept, handy for the future development of our own trading ideas.

Categories
Crypto Daily Topic Cryptocurrencies

5 Crypto Trading Strategies To Bank on in 2021

Cryptocurrencies are rapidly transforming the financial sector. At the moment, they’re finding greater acceptance in payments besides offering an alternative investment vehicle. The reasons for their increased popularity are varied. Chief, though, is their decentralized nature and potential for high returns. From these reasons, it is easy to see why they’d be an attractive investment. 

Crypto trading is as lucrative as it’s risky. It is, therefore, imperative to adopt a solid investment strategy. Again, investing in digital assets needn’t be a complex engagement. The market is rich in strategies that ease potential investors’ foray into the space. 

This article examines five proven strategies that one may bank their crypto trading on in 2021.

Which are the Best five Trading Strategies to Adopt in 2021?

As already indicated, there is a myriad of trading strategies at any investor’s disposal. Individual preferences determine the choice of the means to employ. Here are five concrete plans that you can depend on this year. 

1. Scalping

Scalping is a trading strategy defined by short durations between a trade’s opening and closing. The underlying thinking is that little profits snowball into huge ones in time. Scalpers are traders employing this technique. It utilizes market volatility and is handy in slow market days.

Types of Crypto Scalping Strategies

A scalper may pick from any of the following five strategies:

  • Crypto Range Trading- the range is the difference between the price support and resistance. Scalpers buy at support and sell at resistance.
  • Bid-Ask Spread- The scalper opens a position at either the bid or ask price. To get a profit, they then quickly close the position a few points lower or higher.
  • Arbitrage- here, the investor profits from trading the same asset in different markets. Arbitrage is either spatial or paring.
  • Price Action– the trader uses price movements to make trading decisions. 
  • Margin Trading- It entails transacting with borrowed funds.

The Pros and Cons of Crypto Scalping

Like any other trading strategy, scalping has its pros and cons. One advantage is that the small position sizes make it low risk. Additionally, regular small price changes enhance profits, and one can automate their transactions. 

Finally, affordable entry positions expand trading opportunities.

On the other hand, scalping is demanding; Any slight delay may lead to losses. Further, it has low returns per trade, and traders incur higher transaction costs.

2. Buy the Dips and Hold

Downswings offer excellent buying opportunities. If the affected asset is strong, the price will appreciate once it gains its market confidence.

An examination of cryptos reveals periods of over and undervaluation. Additionally, the crypto market reacts to media coverage. Positive reportage triggers increased acquisition at overvalued rates. The reverse causes traders to panic, therefore, sell their coins below their real value.

Undervalued cryptocurrencies are ideal investment opportunities. Traders using this strategy study the market to determine peak undervaluation. They also predict the earliest recovery. After this, they do their trades holding out for profit when the market corrects itself.

Pros and Cons of Buying the Dips and Holding

A significant plus for this strategy is that one needn’t have special high-frequency trading software to trade. It is convenient as a single trade suffices. Moreover, one profits from both the cryptos upside and the undervalued amount. 

The downside is that it is a long term approach. There aren’t quick profits here. Additionally, it requires a proper grasp of the market. Finally, the strategy calls for calmness amidst market turbulence.

3. Fading Trading

A high-risk trading strategy, fading involves betting against the market’s momentum. The trader sells when there’s an upswing in the market and buys when the market experiences a downswing.

Owing to its high-risk nature, it’s a suitable method for experienced traders. Also, it’s ideal for risk-inclined individuals. However, it could yield dividends when correctly applied and is best suited for a highly volatile market.

Pros and Cons Of Fading Trading

When adequately executed, Fading can be a lucrative trading strategy. Traders can realize profits from any market reversals, a situation that always follows an upsurge or a markdown. That said, it is a risky strategy. One risks incurring massive losses if they misread the market.

4. High-frequency Trading 

High-frequency trading is the most profitable yet complex trading strategy to use. It involves the full automation of trading strategies. HFTs are algorithmic and entail volume trading in milliseconds.

Pros and Cons of High-Frequency Trading

HFT trading is beneficial in several ways. Firstly, it reduces the bid-ask spreads, enhances market efficiency, and creates high liquidity to mitigate the effects of market fragmentation. Further, HFT removes emotions out of trading hence improving better decision making.

On the other hand, HFTs could be disadvantageous. For example, algorithms are susceptible to spoofing, thus price anomalies. Secondly, the hardware and software required for trading are costly. Also, the risk of glitches isn’t far away.

5. Golden Cross and Death Cross Trading

The golden cross denotes a situation where a cryptocurrency’s short term average crosses its long term average. Whereas the short term average comprises the currency’s 50 days average, the long term is its 200-day average.

The death cross, on the flip side, is the opposite of the golden cross. It is the point when the short term average goes under the long term average. The gist of this strategy is buying at the golden cross and selling at the death cross.

Analyzing the changes in trading volumes confirms the occurrence of these trends. Although some use technical indicators such as RSI and the MACD, many consider volume one of the best indicators. 

Pros and Cons of Golden Cross and Death Cross Trading Strategy

A major boon for the strategy’s users is that it helps to determine the market trend. Using both indicators is essential in pointing out attractive entry and exit points. 

Conversely, other schools of thought consider the two to be lagging indicators. Thus, they indicate momentum after price movements have occurred, not before. Additionally, some of the momenta they show could be temporary hence unreliable.

Final Thoughts

The growth of cryptos has ushered in an exciting period in global finance. Besides expanding the payments sector, it has created alternative investment avenues. This growth is fuelled by, among others, the higher ROIs recorded in the space. 

To the first time investor, navigating crypto investments could be exacting. For profitability, they need concrete strategies. Luckily today, there are many sound ones that help ease their entry into the sector. These vary in their utility, and ultimately the choice of one over the other is individual. That said, they serve the same end; taking the guesswork out of investments. 

So, let us know which of the five strategies you’ll be adopting this year!


Categories
Cryptocurrencies

3 Assets that Will Keep Your Investment Inflation Resistant

Inarguably, the value of the dollar today is not the same as it was a decade or two ago. You use more currency to buy less, and that is what inflation is all about.

Inflation can be defined as the measure of the average price level, in an economy, of a unit of goods and services. It is the increase in the price over a particular period, where you cannot use the same amount of currency to purchase a specific item. 

No doubt, the pandemic and the rushed measures to control it were devastating to the world economy. Governments worldwide scrambled to shut down their economies and started printing money to control the spread while also trying to keep the local market functional.

The main issue with printing excess money is that it eventually decimates the host government’s currency and pushes the economy into an inflationary spiral. 

Nonetheless, inflation is a natural event, and only the most disciplined investor benefits from it or reduces its effect on their investments. 

How to Safeguard Against Inflation

In response to the COVID-19-inspired economic fallout, the Fed was forced to pull out all the stops in a bid to control it. These measures have pushed the Federal Reserve balance sheet to over the $7 trillion mark from $4 trillion, and further contractions are expected.

But what should you do as an investor? 

Ideally, there are two factors to look out for when searching for an inflation-resistant asset; real yield and store of value.

An asset with a large store of value such as gold does not lose its purchasing power over a particular period. If the asset can also create income, the better, as it fulfills the two requirements.

There are a couple of other benchmarks that measure potential hedges against inflation, and they include how the asset holds its value over time. Other essential factors include how people perceive the assets as a store of value across borders and how quickly it can be monetized.

Lastly, the ideal inflation-resistant asset should be easily movable across geographical borders in case of unforeseen hurdles.

The perspective of bitcoin as a viable store of value that can be monetized quickly is gaining traction, at least in recent months. Bitcoin is also beyond the control of any government and is, therefore, borderless.

Understanding the Top Three Assets That Will Keep Your Investment Inflation-free

While changes in the inflation level depend on various factors, such as the rapid increases in raw materials prices and rising wages, the coronavirus pandemic is the most significant.

In the last century, the US dollar buying power has been on a free fall, mostly because of the monetary, fiscal policy adopted. The Federal Reserve’s primary response has been to print money and purchase securities on the open market to plug an economic crisis like it is happening now. Although it adds more liquidity to the market, this policy diminishes the value of the dollar, which sometimes aggravates an already dire situation. 

Consumer Price Index (CPI) is the primary method of tracking US Dollar inflation. As far back as 1948, the inflation rate has been at an average of around 2%. This translates to a loss in value of up to 2% every year. That means the money in your savings account is losing its value.

Although inflation is a significant characteristic of market economies, it is possible to plan for it by focusing your investment in asset classes that outperform the market during such challenging times.

Gold 

Traditionally, gold has been the perfect inflation hedge based on its stability. Not long ago, gold went above the $2,000 an ounce ceiling to record a 27% raise last year, 2020, which is quite enormous. 

In fact, many people have previously viewed gold as a possible alternative currency, especially in countries whose money is losing value fast. This precious metal is tangible and real and tends to hold its value in the long term, like no other asset.

Typically, it is common practice for gold or other strong currency to replace a weakened local currency to keep the economy sane. Central banks around the world hoard gold as they start to print money. They spend more of the bad money, which loses value and hold on to the good money, which is gold.

Unfortunately, gold is not always the perfect hedge in tough economic times. When inflation is in an upward trajectory, central banks move in to enforce a monetary policy that includes increasing interest rates. Assets such as gold, with no yields or any other accumulating rewards, are not always the best investment vehicle.

Other better assets will protect your wealth from inflation and still give you good yields. However, diversification is vital for a strong portfolio.

Bitcoin

Last year, bitcoin was up by 66%, and the rise continued into the new year to post a high of $40,519.45, an all-time high. With its exceptional value, bitcoin is hedging against inflation and chaos.


The borderless and decentralized cryptocurrency is beyond any government control, and they cannot print more of it like they do with the standard currency. The maximum bitcoin supply is 21 million, which serves to limit the supply and prevent eventual dilution.

Bitcoin supply remains constant, regardless of what the local governments do.

Interestingly, the current government shutdowns are playing in the hands of digital assets such as cryptocurrency, thereby increasing its value as an inflation hedge asset. But how is that so?

Clearly, the current shutdowns have directed the focus to digital currencies. This may be one of the reasons that propelled bitcoin to an all-time high. It is one of the few assets posting excellent results, which is good for crypto investors. 

Stocks

Thanks to coronavirus, the S&P 500 index surged 55% from the lows observed in March last year despite all the groom. Similar to bitcoin and gold, the lockdowns and the resulting money printing has caused a rally to the stocks. But how can this happen? 

According to economists, the stocks’ value is not appreciating, but rather the dollar is depreciating against the stocks. The surge in equities is a significant indication of diminishing trust in the local currencies, which forces the wise investor to add more stocks to their portfolio to safeguard against losses.

Apparently, investors have lined up to take up stocks at the expense of fiat currencies.

Final Word

Ostensibly, most investors do not give a hoot about inflation and its effect on day-to-day trading and investment. Well, indeed, what you can’t see can’t hurt you, but inflation is the exception. It will hit where it hurts the most; your financial well-being.

The common practice is to hoard local currency in the form of savings to safeguard against tough times. Putting away something for the rainy day is alright, but the strategy has a significant flaw. You lose a bit of the savings to inflation. Saving in a bank is not a viable option, especially when the global central banks do everything to devalue the local currency.

The looming economic crisis, driven by the continued printing of money, calls for wise investment decisions. Ideally, invest in inflation hedge assets such as gold, bitcoin, and stocks to weather the current storm. Don’t be on the losing side by putting so much faith in the dollar and other global currency.

Categories
Crypto Market Analysis

Daily Crypto Review, Jan 29 – Dogecoin Skyrockets as r/Wallstreetbets Enters on Crypto; Bitcoin Jumps on Elon Musk’s Twitter Profile

The cryptocurrency space had a wild week, first because of the r/WallStreetBets community entering the market (and pumping Dogecoin’s price by over 1000%) and then because of Tesla’s CEO Elon Musk tweeting about Bitcoin and promoting it. This has, in turn, caused Bitcoin to spike from $31,000 all the way to $38,200 in a matter of one hour. An interesting fact is that Musk’s Twitter bio now has #bitcoin displayed for everyone to see.

The crypto sector ended the day with most of the top cryptocurrencies in the green. Most analysts speculate that the recent wave of buyers came as a result of Dogecoin’s incredible pump, which was caused by the notorious r/WallStreetBets subreddit. Bitcoin is currently trading for $32,964, representing an increase of 5.26% compared to yesterday’s value. Meanwhile, Ethereum’s price has increased by 1.41% on the day, while Litecoin gained 5.11% of its value.

Daily Crypto Sector Heat Map

3X Long Dogecoin Token gained 905.02% in the past 24 hours, making it the most prominent daily crypto gainer by far. It is followed by Dogecoin’s 513.17% and DOGEFI’s 369.90% gain. On the other hand, 3X Short Dogecoin Token lost 99.85%, making it the most prominent daily loser. It is followed by Panda Yield’s loss of 83.13% and Psychic’s loss of 72.46%.

Top 10 24-hour Performers (Click to enlarge)

Bottom 10 24-hour Performers (Click to enlarge)

Bitcoin’s market dominance decreased slightly from when we last reported, currently 62.8%. This represents a 0.1% decrease from our previous report.

Weekly Crypto Market Cap Chart

The cryptocurrency sector’s market capitalization has increased greatly since we last reported, with its current value being $979.02 billion. This represents a $54.27billion increase when compared to our previous report.

_______________________________________________________________________

What happened in the past 24 hours?

_______________________________________________________________________

_______________________________________________________________________

Technical analysis

_______________________________________________________________________

Bitcoin

Bitcoin has spent the day attempting to push its price up as the market turned to green. Its price conquered the $32,350 level and pushed higher without hesitation. The move ended as bulls reached exhaustion near the $34,627 level. BTC’s inability to push past its immediate resistance has triggered a pullback, and the cryptocurrency is now most likely to retest the $32,350 level.

The overall change in market direction today came as a result of (as most speculate) Dogecoin’s insane upswing triggered by r/WallStreetBets.

BTC/USD 1-hour chart

Bitcoin’s technicals on all time-frames are either neutral with a slight hint of bullishness or bullish with a slight hint of neutrality.

BTC/USD 1-day Technicals

Technical factors (1-hour Chart):

  • Price is above its 50-period EMA and at its 21-period EMA
  • Price is at its middle Bollinger band
  • RSI is neutral (51.01)
  • Volume is above average

Key levels to the upside:          Key levels to the downside:

1: $34,627                             1: $32,350

2: $37,445                             2: $30,072

3: $38,000                             3: $27,960

Ethereum

After yesterday’s failed break of the top downtrend line, the second-largest cryptocurrency by market cap pushed past and broke its descending pattern. Its price (at one point) went past the $1,350 level, but as bulls couldn’t confidently hold this level, bears initiated a pullback.

Ethereum’s short-term price direction will be dictated by how the cryptocurrency handles the top downtrend line (which is now a support rather than a resistance line) as well as by Bitcoin’s price direction.

ETH/USD 1-hour Chart

Ethereum’s technicals on all time-frames are bullish but also show a hint of bearishness.

ETH/USD 1-day Technicals

Technical Factors (1-hour Chart):

  • Price is slightly below both its 50-period and its 21-period EMA
  • Price slightly below its middle Bollinger band
  • RSI is neutral (45.66)
  • Volume is average

Key levels to the upside:          Key levels to the downside:

1: $1,350                               1: $1,211

2: $1,420                               2: $1,183.85

3: $1,440                               3: $1047.6

Litecoin

Litecoin has confirmed its position above the $128.4 level after pushing its price above it yesterday. LTC is now in consolidation mode and is currently testing the 21-hour EMA. Its recent moves seem slightly unenthusiastic, meaning that its short-term price direction will most likely be determined by other cryptocurrencies’ movements.

LTC/USD 1-hour Chart

Litecoin’s 4-hour and daily overviews are neutral/bearish, while its weekly and monthly overviews are completely bullish.

LTC/USD 1-day Technicals

Technical factors (1-hour Chart):

  • Its price is slightly above both its 50-period EMA and its 21-period EMA
  • Price slightly above its middle Bollinger band
  • RSI is neutral (55.45)
  • Volume is average

Key levels to the upside:          Key levels to the downside:

1: $142.1                               1: $128.42

2: $161.5                               2: $120

3: $181.3                               3: $114.75

Categories
Cryptocurrencies

5 Exchanges that Don’t Need KYC Verifications

The KYC (Know Your Customer) regulations are standard with financial institutions around the world. These laws were enacted to prevent money laundering activities in the financial industry, and every one of us has been subject to them, in one way or another. 

The regulations require institutions or platforms to verify individuals’ identities before using their money transmission services, and most recently, virtual currencies. 

Cryptocurrency and blockchain technology is the new kid in the financial block, and already disrupting the market with lower transaction fees, confidentiality of transactions, and improved security against fraud.

Surprisingly, the KYC verifications are gradually creeping to cryptocurrency exchange platforms. This means that getting your money from the cryptocurrency exchange is a bit more complicated than sending money. But you don’t need to use “surveillance exchanges,” as critics call them, to trade.

If you prefer to withhold personal information with your cryptocurrency investment, you can use anonymous cryptocurrency exchanges. We list five of the best exchanges that don’t require KYC verifications.

Are KYC Exchanges Safer than non-KYC Exchanges?

No doubt, the exchanges that mandate KYC verifications may sometimes offer better security. The platforms are fully regulated and may provide better redress in case of a hack or when something goes wrong. 

On the other hand, regulators may not be able to track culprits in a fully anonymous platform. It can also sometimes be difficult to access important information such as inflation rate, currency generation, and other blockchain transactions. Regardless, the benefits of anonymity in cryptocurrency outweigh its downsides. 

BitMEX is a cryptocurrency derivatives exchange that is the latest to join the club of cryptocurrency platforms aligning themselves with the traditional financial institutions’ regulations. Since August 28 of 2020, the exchange has been rolling out KYC. All traders are required to submit photographic ID and other identifying information by February 12, 2021.

But this does not imply non-KYC Exchanges are not safe. In contrast, many cryptocurrency investors prefer non-KYC platforms. This is because they believe KYC is a powerful magnet for hackers, making everyone unsafe. Every time you make a transaction, you give out your crypto address that can be used in blackmail, social engineering, hacking, or by law enforcement.

At the Web3 Summit, Edward Snowden was given a headline spot, and this goes to show that privacy hardliners are not going to relent anytime soon. The action by BitMEX could see migrations to non-KYC exchanges such as ByBit, but still, that is a wait-and-see situation. 

The main goal of high-value crypto traders is to be in cryptocurrency exchanges that blend anonymity and security to a satisfying level. If any one of the two fails, the investors move to better alternatives, and there will always be crypto exchanges such as ByBit ready to receive them with open arms.

As a crypto trader, you can choose to keep your personal information and protect your identity from the reach of criminals by choosing secure, anonymous crypto exchanges.

Binance

The Hong Kong-based cryptocurrency exchange is currently the most popular and the world’s largest, with up to 10 million active users, ahead of Bittrex. With Changpeng Zhao as its head, Binance has been one of the most innovative with creating the Binance Coin (BNB) token. Binance supports over 150 cryptocurrencies.

Users can access a 2 BTC worth of cryptocurrency trading limit without KYC verifications, with additional benefits of up to 50% reduction in fees. You do not need verification for spot trading.

However, transactions involving large amounts of BTC will involve completing KYC procedures to use the Binance platform. Binance US, which the US traders must use, requires KYC verification during registration.

You can deposit funds on Binance through credit cards, bank transfers, and crypto deposits. Holders of its native token, BNB, enjoy a discounted rate. The exchange has a referral program for BNB tokens, among other rewards.

There are some signs that Binance could go the way of BitMEX and transition to full KYC sometime in the future. This is mainly because it is compelled to align with numerous jurisdictions’ requirements where the platform operates. They choose to avoid the push and shove involved with the regulators of different countries and regions. 

Block DX

The exchange operates on blockchain interoperability protocol or the Blocknet, allowing communication between private and public blockchains. Blocknet also makes it easier to interact and exchange crypto among the platform users. 

The Blocknet Protocol-powered decentralized exchange allows users to transact without an intermediary. It has no withdrawal and trade limits, thus allowing greater flexibility. The exchange provides trading pair freedom, where all you need is a small amount of its native coin, BLOCK, to take an existing order. You do not need BLOCK tokens to create an order.

According to the non-custodial exchange developers, Block DX does not have any pause button, kill switch or email notifications. There are no interruptions in scheduled or unscheduled maintenance, and it does not have any offshore company. It claims to be the best definition of a decentralized and anonymous cryptocurrency exchange.

What separates Block DX from its other decentralized peers is that it decentralizes all its platform components. You enjoy more flexibility and freedom.

Changelly

The anonymous cryptocurrency exchange has been around since 2013 and has considerable experience in the crypto space. 

The platform allows instant transfers across various cryptocurrencies to cryptocurrency wallets. The exchange has a reasonable fee of 0.5% and is very committed to protecting your privacy. Changelly only requires an email address.

Changelly is integrated into the Stratis app, and you can conveniently trade the $STRAT tokens right on your mobile device. But still, the exchange supports up to 150 cryptocurrencies. $STRAT is among the leading cryptographic tokens that you can freely trade in open exchanges. 

However, you need supporting cryptos such as dash and Ethereum to exchange for BTC. Changelly is a centralized exchange, but it does not require id verification to access the swapping services. The only instance where KYC verification is necessary is when Changelly detects suspicious activities.

The platform has a vast array of acceptable payment services apart from the crypto deposits. You can deposit through credit card payments, bank transfers, and even ApplePay. Besides, its trading algo is one of the most impressive yet, which scans other platforms to find the best trading prices.

ByBit

This platform matches the ability to leverage trades by up to 100 times by BitMEX without requests for any personally identifying information. This strategy helped ByBit accrue more than a million users worldwide since its launch in 2018.

ByBit may seem too lax with security for a casual observer, but nothing could be further from the truth. ByBit is only part of a handful of cryptocurrency exchanges that can genuinely be said to have never been breached since its establishment.

ByBit leverages two-factor authentication sign-ins compatible with authenticator apps, SMS, and email. Funds are usually in multi-signature wallets stored in offline cold storage.

The Singaporean crypto exchange has a wide variety of features for margins trading. The perpetual swap product, BTC-USD, is the most popular with ByBit, and you can trade ETH, EOS, and XRP. 

ByBit’s crypto margin trading guides have a wealth of tips and tricks on swapping derivatives. Anyone around the globe can use ByBit without the need for KYC verification. The platform has both Android and iOS compatibility and is available in different languages. 

Unfortunately, ByBit bars users from the US. 

IDEX

The hybrid cryptocurrency exchange, which has centralized and decentralized features, is a favorite for Ethereum holders. In an operating environment where owners can be liable for illegal activity in their exchanges, IDEX has pursued pragmatic decentralization to influence legal treatment by the regulators.

IDEX is mainly designed for Ethereum and Ethereum-based tokens (ERC-20) trading. 

The platform employs blockchain technology security and privacy to allow anonymous trading by using only the wallet addresses. You only need to deposit tokens to unlock the wallets and start trading. The IDEX native token holders receive a percentage of the transaction fees generated on the platform.

As of August 23, 2020, all users in the IDEX platform require partial verification to trade. You will also need passport scans and selfies for withdrawals of $5,000 or more. US customers are restricted from trading particular assets on the platform.

Final Word

The world of digital currency was propelled by, among other factors, anonymity. The increasing need for KYC verification to improve security also acts as a barrier. In some way, KYC is a potential threat, as well, in case of a data breach on public ledgers. 

Well, bitcoin mixers are an excellent option for anonymity and security. Nonetheless, a well-established crypto exchange platform that doesn’t require KYC verification is usually sufficient in most cases. Do a little digging before signing up for a cryptocurrency exchange. Check its policies, read the reviews, and weigh the quality of its customer support.

The above exchanges are only a few of the well-established and reliable crypto platforms you can start with. There are many others, as well. Happy trading!

Categories
Crypto Market Analysis

Daily Crypto Review, Jan 28 – Bitcoin Strong Bounce off the 30K level, Altcoins Reversals Followed

The crypto sector ended up almost completely in the red, though most cryptos barely lost any value. Bitcoin is currently trading for $31,200, representing a decrease of 1.13% compared to yesterday’s value. Meanwhile, Ethereum’s price has decreased by 0.95% on the day, while LTC lost 2.06% of its value.

Daily Crypto Sector Heat Map

Zero Collateral Dai gained 828.50% in the past 24 hours, making it the most prominent daily crypto gainer by far. It is followed by QuadrantProtocol’s 327.68% and 3x Long Dogecoin Token’s 137.80% gain. On the other hand, EveryCoin lost 89.97%, making it the most prominent daily loser. It is followed by Zugacoin’s loss of 79.94% and TokenPay’s loss of 50.46%.

Top 10 24-hour Performers (Click to enlarge)

Bottom 10 24-hour Performers (Click to enlarge)

Bitcoin’s market dominance decreased slightly from when we last reported, currently 62.9%. This represents a 0.2% decrease from our previous report.

Weekly Crypto Market Cap Chart

The cryptocurrency sector’s market capitalization has decreased very slightly since we last reported, with its current value being $924.75 billion. This represents a $10.78 billion decrease when compared to our previous report.

_______________________________________________________________________

What happened in the past 24 hours?

_______________________________________________________________________

_______________________________________________________________________

Technical analysis

_______________________________________________________________________

Bitcoin


After another day of its price moving towards the downside, Bitcoin attempted a rally towards the $32,350 mark. After its price establishing strong support at the $30,000 level, the largest cryptocurrency by market cap started surging. There is a strong chance that BTC will pass the $32,350 level if the hourly candle ends up above the 21-hour EMA.

Scott Minerd, the CIO of investment services firm Guggenheim, said that the institutional demand is insufficient to keep BTC above $30,000. Many analysts agree with this short-term assessment, while almost all of them are bullish in the long-term.

BTC/USD 1-hour chart

Bitcoin’s daily overview is mostly neutral (with some hints of bearishness), while its weekly and monthly overviews are tilted towards the buy-side. On the other hand, its 4-hour time-frame is completely bearish.

BTC/USD 1-day Technicals

Technical factors (1-hour Chart):

  • Price is above its 50-period EMA and its 21-period EMA
  • Price is slightly above its middle Bollinger band
  • RSI is neutral (56.39)
  • Volume is above average

Key levels to the upside:          Key levels to the downside:

1: $32,350                             1: $30,072

2: $34,627                             2: $30,000

3: $37,445                             3: $27,960

Ethereum

The second-largest cryptocurrency by market cap spent the day testing the $1,211 level multiple times. After the support level held up on various occasions, ETH bulls entered the market and started pushing its price up. However, it is still uncertain whether this push towards the upside will end as another lower high and a continuation of the downtrend, or a break from the trend.

Ethereum’s immediate downside is guarded by the 21-hour and 50-hour EMAs, while its first major resistance level is the $1,350 mark, as well as the descending line that connects ETH’s recent lower highs.

ETH/USD 1-hour Chart

Ethereum’s technicals on the daily, weekly, and monthly time-frames are tilted towards the buy-side but also show some neutrality. Its 4-hour overview, however, is slightly bearish.

ETH/USD 1-day Technicals

Technical Factors (1-hour Chart):

  • Price is above both its 50-period and its 21-period EMA
  • Price at its top Bollinger band
  • RSI is neutral (57.04)
  • Volume is average

Key levels to the upside:          Key levels to the downside:

1: $1,350                               1: $1,211

2: $1,420                               2: $1,183.85

3: $1,440                               3: $1047.6

Litecoin

Litecoin managed to break out from its downtrend after breaking the $128.4 mark. What’s surprising is that such a strong trend was broken by just average volume. LTC found support in the 21-hour EMA, which currently stands right below the price level.

Litecoin has a zone of heavy resistance straight above it (above $130). It is very unlikely that it can “survive” without a major boost in volume, especially in these market conditions.

LTC/USD 1-hour Chart

Litecoin’s daily overview is mostly neutral (with some hints of bearishness), while its weekly and monthly overviews are tilted towards the buy-side. On the other hand, its 4-hour time-frame is completely bearish.

LTC/USD 1-day Technicals

Technical factors (1-hour Chart):

  • Its price is above both its 50-period EMA and its 21-period EMA
  • Price at its top Bollinger band
  • RSI is neutral (58.51)
  • Volume is average

Key levels to the upside:          Key levels to the downside:

1: $142.1                               1: $128.42

2: $161.5                               2: $120

3: $181.3                               3: $114.75

Categories
Crypto Videos

Craig Wright (Claims To Be Satoshi Nakamoto) Threatens Legal Action Take my Bitcoin Whitepaper Down!


Craig Wright Threatens Legal Action: “Take my Bitcoin Whitepaper Down!”

Craig Wright, the self-proclaimed Bitcoin inventor Satoshi Nakamoto, has threatened legal action against the owners of two Bitcoin websites he accused of stealing his whitepaper and his other intellectual property.

As announced on Jan 21, Bitcoin.org and Bitcoincore.org had received allegations of copyright infringement coming from none other than Craig Wright and his lawyers. The counsel reportedly claimed that Wright, as the inventor of Bitcoin, was the legal copyright holder of the official Bitcoin whitepaper, owned the Bitcoin name and trademark, and the two aforementioned websites.

While the owner of Bitcoin.org, a developer known only as Cobra, has stated that he refuses to be intimidated by the threat of “false allegations,” the owner of Bitcoincore.org has already adhered to the request.

Cobra then stated: “Unfortunately, without consulting with us, Bitcoin Core developers removed the Bitcoin whitepaper from bitcoincore.org, in response to the allegations of copyright infringement, lending credence to these completely false claims.”

He then added: “The Bitcoin Core website was modified to remove all references to the whitepaper, the local copy of the whitepaper PDF was deleted, and with under 2 hours of public review, the change was merged.”

Things got heated when the owner of Bitcoincore.org, as well as the current maintainer of Bitcoin’s code, Wladimir J. van der Laan, responded quickly, telling his Twitter followers that this issue was not something he cares deeply about. 

He stated: “So let this be clear: I’m happy to maintain Bitcoin core’s code, but I will not personally be a martyr for BTC. It’s completely up to you as Bitcoiners to protect it.”


Van der Laan added: “This thing is all about decentralization and distributed systems, rather than personal macho posturing. I have no interest in it and am definitely not paid enough to take a stance.”

As the two Bitcoin core websites decided to take vastly different approaches, we will see which one was better and why. In the meantime, the Bitcoin whitepaper will continue to be hosted on Bitcoin.org, which hopes that other websites would follow them in resisting Craig Wright’s attempts at intimidation.

Categories
Crypto

Holding Bitcoin Now Is As Safe As Gold & Bonds!


Holding Bitcoin is as Safe as Owning Gold and Bonds – Anthony Scaramucci

Anthony Scaramucci, the head of SkyBridge Capital as well as former White House communications director, believes that Bitcoin’s value proposition has strengthened ever since governments have addressed many of the risks that are associated with the digital asset. 

In an opinion article published by CNN, Scaramucci and his fellow SkyBridge executive Brett Messing argued that Bitcoin had become a viable option for long-term investors seeking refuge from inflation. The authors also stated that holding Bitcoin is far less risky today than it was just a couple of years ago when regulations and infrastructure were underdeveloped.

Bitcoin’s growth has “caused government, as well as institutions, to step in and address many of the risks that are often associated with the digital currency,” the authors wrote, pointing to the Office of the Comptroller of Currency’s decision to enable all banks to provide cryptocurrency services.

They added: “Increased regulations, improved infrastructure, as well as access to financial institutions such as Fidelity, have made Bitcoin investments just as safe as owning bonds and commodities such as gold, which are used to balance portfolios.”

SkyBridge Capital made a big splash in the news last month when it applied with the US SEC to launch a Bitcoin hedge fund. Its SkyBridge Bitcoin Fund LP launched just a few weeks later, with Fidelity serving as custodian, while Ernst & Young were chosen to handle the auditing.

SkyBridge reportedly invested in Bitcoin during Nov and Dec 2020, allowing it to accumulate a substantial position in the cryptocurrency prior to its parabolic spike. By the time the fund was launched, on Jan 4 of this year, SkyBridge had claimed its BTC exposure was worth around $310 million.

Institutional capital is considered a major catalyst behind Bitcoin’s 300% rally in 2020, which brought its price to a new all-time high of $42,000 on Jan 8. Smart money investors are beginning to view Bitcoin as digital gold rather than just a speculative asset. 


Categories
Crypto Daily Topic Cryptocurrencies

Impact of DeFi in the Banking Sector

Blockchain is revolutionary fintech, and DeFi applications are taking success in financial services to a whole new level. Over 1.7 billion people remain unbanked, and DeFi is empowering internet users with permissionless financial services that cut out third parties.

Investors locked more than $15 billion within DeFi protocols in 2020. While decentralization has only captured billions, traditional, centralized finance controls the vast trillions of dollars transacting globally. Therefore, more innovations and marketing will suffice for further adoption.

However, with the industry admitting roughly $500 million from investors monthly, the prospects are changing. DeFi offers irresistible convenience and cost-effectiveness. The potential is also vast.

DeFi encompasses digital lending, borrowing, staking for capital gains, and regular income. DeFi services are permissionless, and they execute most transactions through tokenization and smart contracts. Eliminating all the third-parties and profit-seeking intermediaries make DeFi cost-effective.

Laws, rules, and regulations are programmed into blockchain protocols, and DeFi impacts every aspect of traditional financial services via automation. The impact is so great that it could change human interactions on an international scale.

In this article, we are peering into DeFi and its impact on the finance industry. A chronological outlook of blockchain developments suggests a pattern of innovation and adaptability. Understanding this pattern is crucial for your future investment projects.

The Ethereum Blockchain: How Are dApps Taking over the Banking Sector?       

To start with, let’s appreciate that the Ethereum community has revolutionized and accentuated DeFi as no other blockchain has. The ecosystem is advanced enough to evaluate systemic risks, and it reports DeFi Scores for platform security.

The ecosystem supports open-source composability, and the Ethereum blockchain harnesses the collaboration of independent developers worldwide. Borderless, open-source development has encouraged software designers and coding experts to focus on their strengths.

Ethereum’s infrastructure allows users to integrate various DeFi applications covering vast, diverse industries such as gaming, credit, supply-chain management, and capital markets. Laying and building applications on each other creates a vast network effect.

The Ethereum community is significant in DeFi because its network has over 7,083 live, global, main-net nodes, over 88 million unique users, over 42 million smart contracts executed.

You can utilize over 2,773 decentralized applications along with over 23K daily users. DApps are popular and post daily transactions exceeding 78K because of their:

  • Open-source codes.
  • Decentralized consensus and governance.
  • Noncustodial, permissionless services.
  • Tokenization and the use of smart contracts.

The diversity of dApps supports digital currency banking services, alternative services, DEXs, and P2P lending. Users embrace digital transactions because they are fast, secure, borderless, pseudo-anonymous, and irreversible.

Cross-chain interoperability came into DeFi markets in 2020, and you can now lend, borrow, and trade tokens across different blockchain networks.

How DeFi Saved Global Finance from Total Atrophy

When the Coronavirus became a global pandemic, states imposed mandatory lockdowns. Globally, the banking sector came to a standstill, and the international exchange services and other intermediaries such as asset managers, insurers, and bankers.

People were required to stay at home, and only essential services were allowed to proceed. If we didn’t have alternative financial services, most global supply chains would have suffered complete atrophy.

Governments created concerns about the value of money when they printed cash to bail out people and agencies. People and investors got more concerned that they pay taxes, yet governments dilute their savings by printing more money.

The threat to traditional finance was runaway inflation and the concern that credit is limited for those needing it the most. The international investment landscape went through shocks as investors turned to DeFi, seeking to mitigate the effects of a global pandemic.

Fintech Verticals Most Impacted by DeFi

Open Banking and Financial Data

Data is one of the most valuable commodities in the Mega Big Data era. Banking institutions traditionally hoarded all the financial data of users. In the US, financial data is worth over $15 billion. However, bankers won’t let you access it.

DeFi frees up your financial data for your benefit, allowing you to make intuitive, cost-effective investments. DeFi applications and services are providing open-source, immutable, financial market data.

Moreover, pseudo-anonymity and permissionless transactions prevent a handful of corporations from accessing your private transaction history.

Decentralized Exchanges

DEXs empower users to control their funds, giving them exclusive access to their private keys. These permissionless exchanges reduce the risk of custodian third-parties and diminish the risk of custodian third-parties losing your funds through major hacking events.

Cross-chain money markets are completely cutting off permission-based, custodian exchanges where you need expensive, third-party intermediation to swap bitcoins for other tokens like ETH, BCH, and XRP. Therefore, you can take just seconds to execute fast, borderless, almost-free transactions.

Borrowing and Lending

DeFi allows people to earn high interest on their savings. As crypto-assets stabilize volatility issues, DeFi is empowering crypto users to save profitably. You don’t need banks to store or transfer value. You can just use your smartphone and an internet connection to upload your finances to online savings software with blockchain transparency, security, and profitability.

DeFi platforms offer flexible interest payments, with some paying out interests every second. The best part is that you don’t need credit checks to take out DeFi loans. You only need to collateralize with your long-term investments. DeFi borrowing costs for commercial use are tax-deductible.

Tokenization and Asset Management

The tokenization of assets is at the core of decentralized finance. It’s revolutionizing assets-trading across the globe, offering traders new markets and opportunities. DeFi offers reliable asset and supply-chain management via smart contracts.

You can make international deals and trust total strangers to hold their side of the deal. Smart contracts don’t release payments unless all predetermined conditions are fulfilled. Tokenization is crucial in executing group contracts such as the ones utilized in:

  • Liquidity pools.
  • DeFi insurance protocols.

Parting Shot

The impact of DeFi on the banking sector threatens its existence, but bankers can adopt dApps to survive the storm and thrive. The banking sector won’t disappear, but it will evolve drastically as DeFi revolutionizes how we interact and do business.

Understanding the role of DeFi in 21st commerce is important for your financial future. Remember that these technologies offer cutting-edge convenience, and the market is growing exponentially. Therefore, you need to join in on the benefits or risk falling behind.

What do you think about DeFi, and what are your predictions on 2021 banking? Share your views in the comments section.


Categories
Crypto Market Analysis

Daily Crypto Review, Jan 27 – Bitcoin (BTC), Ethereum (ETH), Litecoin (LTC) Price Analysis

The crypto sector ended up either slightly red or slightly green, with only rare exceptions making significant moves to either side. Bitcoin is currently trading for $31,679, representing an increase of 0.51% compared to yesterday’s value. Meanwhile, Ethereum’s price has decreased by 1.61% on the day, while LTC lost 3.33% of its value.

Daily Crypto Sector Heat Map

Coupon Chain gained 74575.19% in the past 24 hours, making it the most prominent daily crypto gainer by far. It is followed by YVS.Finance’s 683.5% and Chonk’s 198.23% gain. On the other hand, Narwhale.finance lost 72.98%, making it the most prominent daily loser. It is followed by 3X Short Matic Token’s loss of 67.68% and MangoChain’s loss of 66.24%.

Top 10 24-hour Performers (Click to enlarge)

Bottom 10 24-hour Performers (Click to enlarge)

Bitcoin’s market dominance increased slightly from when we last reported, currently 63.1%. This represents a 0.2% increase from our previous report.

Weekly Crypto Market Cap Chart

The cryptocurrency sector’s market capitalization has decreased very slightly since we last reported, with its current value being $935.58 billion. This represents a $0.96 billion decrease when compared to our previous report.

_______________________________________________________________________

What happened in the past 24 hours?

_______________________________________________________________________

_______________________________________________________________________

Technical analysis

_______________________________________________________________________

Bitcoin

After a day of attempting to break out of its slightly descending channel, Bitcoin has returned to the downtrend. The largest cryptocurrency by market cap tried to regain the $32,350 level but failed in doing so. This created a strong sell-wall above its current price of just below $32,000.

Bitcoin’s immediate upside is guarded by the 21-hour and 50-hour EMAs, as well as the 32,350 level. Its downside, however, is a free-fall until the zone above $30,000.

BTC/USD 1-hour chart

Bitcoin’s daily overview is mostly neutral (with some hints of bearishness), while its weekly and monthly overviews are slightly bullish. On the other hand, its 4-hour time-frame is completely bearish.

BTC/USD 1-day Technicals

Technical factors (1-hour Chart):

  • Price is slightly below its 50-period EMA and its 21-period EMA
  • Price is slightly under its middle Bollinger band
  • RSI is neutral (46.41)
  • Volume is average

Key levels to the upside:          Key levels to the downside:

1: $32,350                             1: $30,072

2: $34,627                             2: $30,000

3: $37,445                             3: $27,960

Ethereum

The second-largest cryptocurrency by market cap returned to mirroring Bitcoin’s movement after entering its consolidation phase. Ethereum has, after failing to break the $1,350 level, returned to its slightly-downwards movement. The zone just above the $1,300 level mentioned yesterday was also broken, meaning that ETH is now trading between $1,211 to the downside and $1,350 to the upside.

Ethereum’s immediate upside is guarded by the 21-hour and 50-hour EMAs, as well as the $1,350 level. Its first major support level is sitting at $1,211.

ETH/USD 1-hour Chart

Ethereum’s technicals on the daily, weekly, and monthly time-frames are tilted towards the buy-side, but all have neutral oscillators. Its 4-hour overview, however, is completely neutral.

ETH/USD 1-day Technicals

Technical Factors (1-hour Chart):

  • Price is slightly below both its 50-period and its 21-period EMA
  • Price slightly below its middle Bollinger band
  • RSI is neutral (46.02)
  • Volume is average

Key levels to the upside:          Key levels to the downside:

1: $1,350                               1: $1,211

2: $1,420                               2: $1,183.85

3: $1,440                               3: $1047.6

Litecoin

Litecoin has seemingly created a double bottom formation after hitting and staying above the $128.4 level twice. This may be a bullish signal for LTC traders, but the move needs to be accompanied by at least a slight increase in volume.

Despite creating a double bottom, LTC will have a hard time moving past the 21-hour and 50-hour EMAs, as they seem to be its immediate resistance levels. On the other hand, its $128.4 support level is holding up well for now, making it very uncertain where LTC will go in the short-term.

LTC/USD 1-hour Chart

Litecoin’s daily overview is mostly neutral (with some hints of bearishness), while its weekly and monthly overviews are slightly bullish. On the other hand, its 4-hour time-frame is completely bearish.

LTC/USD 1-day Technicals

Technical factors (1-hour Chart):

  • Its price is below both its 50-period EMA and its 21-period EMA
  • Price slightly below its middle Bollinger band
  • RSI is neutral (41.89)
  • Volume is slightly below average

Key levels to the upside:          Key levels to the downside:

1: $142.1                               1: $128.42

2: $161.5                               2: $120

3: $181.3                               3: $114.75

Categories
Crypto Videos

Largest Russian Bank Sberbank Launching its Stablecoin in Spring 2021!


Largest Russian Bank Sberbank Launching its Stablecoin in Spring 2021

Sberbank, the largest Russian state-owned bank, has reportedly filed an application with the Bank of Russia regarding the launch of a blockchain platform for its “Sbercoin” stablecoin.

The director of the transaction business at Sberbank, Sergey Popov, announced the news on Jan 21 at a local financial event.

At the “Digital transformation and prospects for regulating the digital economy” event, Popov stated that Sberbank applied with the Russian central bank in early January, explaining that this kind of registration procedure usually takes no longer than 45 days. If everything goes by plan, the bank may launch its platform by spring 2021, the official said. However, Sberbank is still working on specifics about how to tax Sbercoin:

“There is a high probability of this project being launched in the spring. However, there is still one more issue that has not been fully resolved, and it is connected to the taxation of digital assets. We hope that this question will soon be resolved.”

Popov also added that Sberbank had completed internal testing to see if the solution they propose works, which it apparently did.

Sberbank broke the news on developing its own Sbercoin token at the end of November 2020, following long-running speculation about these plans. Its latest announcement comes shortly after Russia’s official adoption of the crypto law “On Digital Financial Assets” on Jan 1, 2021.


In late 2020, a member of the Russian State Duma, Anatoly Aksakov, said that the Duma’s Committee on Financial Markets expects that Russian crypto issuance will surge after adopting the country’s new crypto law.

Categories
Crypto Videos

Grayscale About To Unveil Chainlink?


Is Grayscale about to unveil a Chainlink (LINK) trust?

Rumors about Grayscale Investments being set to launch a raft of new products, including a Chainlink (LINK) trust, surfaced in the last week.

A statement from the State of Delaware’s Division of Corporations says that someone set up Grayscale Chainlink Trust on Dec 18, 2020. Basic Attention Token (BAT) trust, Livepeer (LPT) trust, Decentraland (MANA) trust, and a Tezos (XTZ) trust were also set up at the same time.


Grayscale Investments didn’t respond to the rumors and has yet to officially confirm it is behind the filings at all. Some reports tried to cast doubt on the legitimacy of this whole ordeal, as the registered agent for the trusts is not listed as Grayscale Investments, but rather as “Delaware Trust Company.” 

However, the Delaware Trust Company is currently listed on Grayscale’s website as one of its official service providers. On top of that, the same details were used when the Grayscale Bitcoin Trust was initially created in 2013.

With that being said, new trusts are far from certain to launch. A Filecoin (FIL) trust was established two months before the aforementioned trusts and still has not been made public.

Adding to all the uncertainty, a few weeks after the inception of numerous trusts, Grayscale founder and CEO Barry Silbert decided to step down from its position. He was then replaced by Michael Sonnenshein. It is unclear if Sonnenshein will continue with Silbert’s strategy or take the firm in a completely new direction.

Grayscale last made an official filing for a Stellar Lumen (XLM) trust in October 2018 — over two years ago. The Stellar trust was made public around six weeks after its inception.

The Chainlink army has been very vocal about the potential filing, showing its support and speculating on the effect this might have on the LINK’s price.

Chainlink recently flipped Bitcoin Cash and became the eighth-largest cryptocurrency by market cap, boasting a value of over $9 billion. 

Categories
Crypto Daily Topic Cryptocurrencies

DeFi vs CeFi Investments: What’s the Difference?

The advent of the blockchain and Bitcoin ushered a new era of transformation in the financial sector. The latter’s successes catalyzed further innovations in this space. One of its earliest adaptations was Centralized Finance( CeFi). Further developments have seen the introduction of Decentralized Finance(DeFi). 

Though the two are diametric opposites of each other, they serve one end: the expansion of financial services. But what do these concepts mean? What are their pros and cons? Can we find commonalities between the two? Finally, is there a way of bridging the divide between them?

This article will use the questions above to differentiate CeFi and DeFi investments. In this way, it aims at deepening your understanding of these crucial financial developments.

Understanding CeFi

CeFi is centralized finance and comprises closed financial markets. It entails a central authority controlling all aspects of transactions between peers. The said authority could be a bank, government, or any other uninvolved third party. 

Salient Features of CeFi

A keen look at CeFi investments reveals several important features. First, there’s a strong emphasis on KYC and AML requirements. In keeping with their jurisdictions’ laws, CeFi service providers require their users to provide personal information, including identity and residence details.

Secondly, CeFi investments are custodial in that they hold their users’ private keys. They are centralized and offer cross-chain services. CeFi investment services also allow for the exchange of different cryptos issued on different blockchains.

Advantages of CeFi

The popularity of CeFi investments speaks of their usefulness. For instance, they guarantee the protection of depositors’ funds. As they’re custodial, CeFi service providers assure their users of the safety and returns on their users’ funds.

Additionally, they undertake to secure one’s private keys. Since the service provider holds the private keys, there’s no danger of ever  losing them. Moreover, they have dedicated customer support systems. 

Disadvantages of CeFi

There are several deficiencies linked to CeFi. Among these are higher transaction fees. Because they use intermediaries in transactions, they charge higher fees. Another shortfall is that they lack transparency as they don’t provide for a public audit of transactions.

The centralized nature denies users control over their funds and makes them invasive in nature. Their  KYC requirements demand full disclosure of personal information. Users can quite easily lose their funds on these since CeFi investments are an easy target for hacking owing to their custodial nature.

Decentralized Finance (DeFi)

DeFi is an acronym for decentralized finance- a movement that champions the provision of P2P financial services. DeFi solutions give parties greater control over their transactions. They achieve this by eliminating centralizing authorities – banks and governments – from the exchanges.

Last year saw a proliferation of DeFi platforms. Currently, the major players in the space include Compound, Yearn Finance, Uniswap, and Marker DAO.

Key DeFi Features

A number of features define DeFi investment projects. To begin with, they are permissionless, which means that anyone can use them, regardless of their geographical location.

On top of that, they depend on Smart contracts, a set of code defining the relationship of the transacting parties. The smart contracts work together with Decentralized apps (Dapps) to automate transactions.

Again, DeFi investments are Blockchain-based. They run on the Ethereum blockchain and have wide applications across the payments, lending, and trading sectors.

Advantages of DeFi

The ballooning of DeFi projects points to them being beneficial. Here’s a rundown of their key advantages. A key feature is that DeFi investments give users autonomy over their funds. The user is the sole custodian of their investment.

Equally, it is expedient as it eliminates third parties, which helps to make it more affordable. Furthermore, DeFi investments are tradeable, thanks to tokenization, which allows for trading in micro-units.

Another key feature is that they’re accessible. DeFi investments are open to everyone, notwithstanding their location. They are also transparent since their deployment on the blockchain opens transactions to public scrutiny.

Disadvantages of DeFi

Although advantageous in many ways, DeFi platforms have their shortcomings. The threat of losing assets ranks highly among those. DeFi users may permanently lose their crypto assets by losing their private keys or mistyping their wallet addresses.

In close tow is the possible exposure to scams. Many cons have infiltrated the DeFi Sector. These take advantage of the absence of centralized control; victims have very little recourse, if any, in such cases. 

Significant Differences Between DeFi and CeFi

The differences between CeFi and DeFi are more than in the terminology. As the following points will indicate, the two platforms are stark contrasts of each other.

Governance

Centralized authorities run all aspects of CeFi platforms. The users have to subscribe to a set code of regulations. On the contrary, DeFi platforms look to their user communities for governance. Some of them issue governance tokens that enable holders to participate in the decision-making processes. An example is Compound (COMP).

Features 

Both CeFi and DeFi have unique features defining them. For example, CeFi projects are custodial while DeFi projects are non-custodial. Again CeFis offer dedicated customer services, which DeFis don’t.

Further CeFi investments adopt the use of Centralised Exchanges (CEX). On the flip side, DeFi investments use Decentralized Exchanges (DEXs).

Whereas CeFi projects are permissioned, DeFis aren’t. CeFis use third parties to create trust, while DeFis are trustless networks.

Regulation

CeFi platforms conform to strict regulations of the jurisdictions they operate. In compliance, they undertake thorough KYC and AML reviews of their users. On the other hand, DeFi is nascent and unregulated. They, therefore, dispense with KYC requirements. 

That said, many jurisdictions are instituting regulatory measures in crypto operations. The Securities and Exchange Commission of the US oversees cryptocurrency trade.  At the same time, the European Commission is pushing for a comprehensive legal framework targeting cryptos.

Fees 

As CeFi runs centralized exchanges, they charge higher fees. The higher fees arise from the need to maintain the platform, pay their staff, improve their offering, among others.

In contrast, DeFi platforms are affordable. They employ decentralized exchanges that don’t provide custody services and don’t have teams engaging in their day to day running.

Liquidity 

CeFi and DeFi investment platforms have different approaches to raising liquidity. CeFi projects raise liquidity by matching buyers’ and sellers’ orders akin to forex or stock markets. DeFi projects in reverse employ automated market makers that  pre-fund both sides of the trade.

Security 

The custodial nature of  CEXs increases their susceptibility to cyberattacks. Although CeFi platforms invest in robust security systems, it isn’t unusual to hear of major platforms getting hacked.  


DEXs, however, are noncustodial. Thus are less susceptible to such attacks. However, vulnerabilities in their smart contracts could expose them to the theft of funds.

Similarities Between DeFi and CeFi Investments

Although different, the two platforms find convergence in certain areas. For example, they offer similar financial services. These include trading (spot, derivatives, and margin), borrowing and lending, payments, and the development of stablecoins. 

Also, both systems bank on innovation. They use transformative blockchain technology. Further, both serve the digital assets ecosystem.

Parting Shot

CeFi and DeFi platforms are polar opposite. That said, they serve similar functions in payments, lending, and trades. Moreover, both are at different stages of their development, with CeFi having a headstart over DeFi. This gap in development calls for urgent redress. 

To that end, several projects and platforms are working on appropriate solutions. Binance is one of them. Apart from reducing the risks inherent in DeFi, there’s a need to mainstream it. Moreover, there must be a simplification of the DeFi adoption process besides building robust DeFi communities.


Categories
Crypto Market Analysis

Daily Crypto Review, Jan 26 – Blood on the Streets: Crypto Market in the Red

The crypto sector ended up almost completely in the red as most cryptocurrencies pulled back to lower levels. Bitcoin is currently trading for $31,575, representing a decrease of 5.26% compared to yesterday’s value. Meanwhile, Ethereum’s price has decreased by 7.24% on the day, while LTC lost 6.79% of its value.

Daily Crypto Sector Heat Map

EveryCoin gained 501.69% in the past 24 hours, making it the most prominent daily crypto gainer by far. It is followed by BBYS’s 280.04% and X Infinity’s 255.24% gain. On the other hand, ARTH lost 61.58%, making it the most prominent daily loser. It is followed by Typhoon Cash’s loss of 44.07% and Aventus’s loss of 40.31%.

Top 10 24-hour Performers (Click to enlarge)

Bottom 10 24-hour Performers (Click to enlarge)

Bitcoin’s market dominance increased slightly from when we last reported, with its value currently being 62.9%. This represents a 0.2% increase from our previous report.

Weekly Crypto Market Cap Chart

The cryptocurrency sector’s market capitalization has decreased greatly since we last reported, with its current value being $936.54 billion. This represents a $54.92billion decrease when compared to our previous report.

_______________________________________________________________________

What happened in the past 24 hours?

_______________________________________________________________________

_______________________________________________________________________

Technical analysis

_______________________________________________________________________

Bitcoin

Bitcoin’s gains in the past two days were taken away when bears took over the market after BTC failed to break the $34,627 mark. The cryptocurrency declined to the $32,350 level but quickly lost hold of it as well. BTC is currently hovering right above the $31,000 mark.

Bitcoin’s 1-hour RSI is getting dangerously close to the oversold territory, while its volume is descending, indicating a possible price stagnation or a direction reversal.

BTC/USD 1-hour chart

Bitcoin’s daily overview is completely neutral, while its weekly and monthly overviews are completely bullish. On the other hand, the 4-hour time-frame is completely bearish.

BTC/USD 1-day Technicals

Technical factors (1-hour Chart):

  • Price is below its 50-period EMA and its 21-period EMA
  • Price is close to its bottom Bollinger band
  • RSI is near the oversold area (31.21)
  • Volume is average

Key levels to the upside:          Key levels to the downside:

1: $32,350                             1: $30,072

2: $34,627                             2: $30,000

3: $37,445                             3: $27,960

Ethereum

The second-largest cryptocurrency by market cap spent the day retracing after posting a new all-time high at $1,477.30. ETH tested many levels but ultimately fell below the previous all-time high, and then the $1,420 and $1,350 levels as well. It is currently consolidating just above $1,300.

Ethereum seemingly created a zone of support just above the $1,300 level, which is holding up for 10 hours now. If this support holds long enough for BTC to change its price direction (or at least enter a sideways trading period), we may see ETH bulls reentering the market once again.

ETH/USD 1-hour Chart

Ethereum’s technicals on all time-frames are slightly tilted towards the buy-side, with its oscillators taking a more neutral stance.

ETH/USD 1-day Technicals

Technical Factors (1-hour Chart):

  • Price is below both its 50-period and its 21-period EMA
  • Price near its bottom Bollinger band
  • RSI is very close to being oversold (39.73)
  • Volume is average

Key levels to the upside:          Key levels to the downside:

1: $1,350                               1: $1,211

2: $1,420                               2: $1,183.85

3: $1,440                               3: $1047.6

Litecoin

Litecoin has lost all of the gains it made yesterday, and then some. The eighth-largest cryptocurrency by market cap failed to pass the zone just under $150, which triggered a pullback and a dip below the $142.1 support (now resistance) level. On top of that, LTC also fell below the trading range it was in for the previous four days (excluding yesterday’s push).

LTC/USD 1-hour Chart

Litecoin’s short-term and long-term overviews have opposing stances: while its 4-hour and overviews show a slight tilt towards the sell-side, its weekly and monthly overviews are slightly bullish.

LTC/USD 1-day Technicals

Technical factors (1-hour Chart):

  • Its price is below its 50-period EMA and its 21-period EMA
  • Price slightly above its bottom Bollinger band
  • RSI is close to being in the oversold territory (33.05)
  • Volume is average

Key levels to the upside:          Key levels to the downside:

1: $142.1                               1: $128.42

2: $161.5                               2: $120

3: $181.3                               3: $114.75

Categories
Crypto Daily Topic Cryptocurrencies

A Complete Guide to DeFi Taxes: Everything You Should Know

2020 was revolutionary for DeFi markets, and investors flooded the young industry with over $7billion from a mere $1.2 billion. As the market cap and number of transactions surged, regulators came up with responsive ways to tax cryptocurrency income. 

Initially, taxes were a foreign concept in crypto realms, but the IRS made definitive tax rules for blockchain transactions. Most digital currency taxation policies are based on cryptocurrencies, but regulation is spilling over to the DeFi markets.

Most crypto users are ignorant of digital currency tax laws, but the IRS will not let you plead ignorance. The federal tax agency is decisively cracking down on crypto tax compliance, and this article will help you gain some valuable insights.

Reading on will help you keep compliant with DeFi taxation requirements. Even more importantly, it will help you navigate DeFi, so you trigger as much tax deductibility as allowed in novel legal confines. 

Crypto Taxes 101

The IRS categorizes digital tokens as properties and not currencies. Bitcoins, for example, are capital assets that can attract profits and losses from transactions.

Reporting your crypto taxes gets harder with the increasing number of blockchain transactions per financial year. The IRS adopted and has never changed its use of first-in, first-out accounting, which means you should determine your net gains/losses on crypto assets.

Profits are categorized as long-term or short-term capital gains. Losses on cryptocurrencies are considered deductible capital losses.

To prevent crypto holders from absconding cumbersome tax computing and filing, the IRS imposes the form 1099-K for all crypto exchange users posting over 200 transactions per year. This file is similar to form 1099-B that stockbrokers use for filing capital losses/gains, but it has some unique provisions.

Introduction to DeFi Taxes

DeFi exists within cryptocurrency realms, enabling digital token users to trade, lend, and borrow via low-cost automation that rules out third-party financial services. In DeFi markets, crypto owners earn interest on lending platforms, and the interest is paid in the same digital currencies.

Therefore, crypto interests increase the number of digital currencies. When you earn interests through your crypto tokens, a different taxable event occurs from profits/losses. Taxable events in DeFi markets transpire when:

  • You trade one cryptocurrency for another via cross-chain money markets, realizing either profits or losses.
  • You trade crypto tokens for fiat currencies, either realizing either profits or losses.
  • You spend digital tokens on goods and services, realizing either profits or losses.
  • You earn in cryptocurrencies, and DeFi services create numerous earning opportunities where you trade your time and skills by executing network protocols. Moreover, some CEOs and athletes prefer getting their salaries in digital tokens.

These taxable events in cryptocurrency transactions are either:

  • Capital gains.
  • Ordinary income.

Ordinary Income vs. Capital Gains Income               

Ordinary income taxes apply for normal jobs, and the IRS doesn’t classify cryptocurrency miners any differently. You must pay according to your marginal tax bracket.

Bitcoin miners and validators on Proof of Stake protocols earn digital tokens for authenticating transactions. These earnings are categorized as ordinary income, and they offer minimal tax savings.

Capital gains income manifests when you swap your digital assets for a higher monetary value than you acquired them. These income streams present significant tax benefits and holidays. For starters, long-term capital gains tax rates are diminished compared to short-term capital gains.

Moreover, you can completely offset capital gains with capital losses. However, capital gains can only offset ordinary income up to $3,000.

DeFi Taxes in Lending and Borrowing

The DeFi ecosystem offers lending opportunities like no other. Your digital currencies can earn interest on Compound, Blanancer, and Uniswap by contributing to liquidity pools or lending directly.

Some DeFi protocols take crypto loans and issue out Liquidity Pool Tokens in return. The currencies you loan out determine the number of tokens from the liquidity pool and ultimately how much interest you make.

Interests that you make on crypto lending platforms qualify as ordinary income for tax purposes. The DeFi ecosystem allows you to boost your revenues, with some platforms paying out interests every second.

The same applies to crypto borrowing platforms. You can borrow bitcoins and other digital tokens to use for business or personal use. Commercial cryptocurrency loans qualify for tax-deductible expenses. Therefore, you can claim relief on costs you incur when borrowing cryptocurrencies for commercial use. 

DeFi Taxes for Unexpected Income from Hard Forks and Token Distribution

Sometimes, blockchain networks award existing users or asset holders with free digital tokens. Such tokens are newly acquired assets with monetary value. Such a transaction is taxable, and the IRS categorizes it as regular income.

Therefore, you must report it within your appropriate tax brackets, and you won’t qualify for many deductions on these earnings. If you use such tokens profitably, file the revenue made on top separately.

Networks like Compound sometimes distribute their native tokens for free to users during initial offerings. For example, the DeFi platform distributed $100 worth of COMP. The users who enjoyed free $100-worth assets owed the IRS whatever your income rate is for that $100.

You won’t pay any more taxes if you hold the COMP, no matter how much they appreciate it. However, you will owe the day you redeem that appreciated monetary value, and you should report the net revenue as capital gains.

If the $100-worth of COMP appreciates to $300 within a year, you will owe short-term capital gains tax for $200 if you sell the COMP or redeem it for products and services. Your capital losses for the COMP are not deductible on the income tax you owe for unexpected digital income.

Cryptocurrency forks are other sources of unexpected digital income. Forks result when validators or miners in a network disagree on blockchain governance. A great example is that of Bitcoin and Bitcoin Cash. They disagreed, and the Fork was quite controversial because it created BTC tokens from scratch.

Investors of parent cryptocurrencies end up with an equal number of forked-off tokens. For example, if you had 4 BTC during the fork, you automatically got 4 BCH, and you became a member of two independent blockchains.

These unexpected incomes are also part of your taxable income, and you pay per your tax bracket. Any gains on them are taxable, and any losses on them are not tax-deductible.

DeFi Taxes in DEXs

Basic taxation rules for cryptocurrencies apply to DEXs. You do not incur taxation for transferring funds from one platform to another, so long as the accounts and funds are yours.

However, when DEXs allow cross-chain asset swaps, an element of profitability occurs. You either gain profits or losses on your initial capital assets.

Reporting DeFi Income on Your Taxes

It is your responsibility to report DEX revenue streams for tax purposes. The advantages of DeFi taxation are abundant. Report all DeFi buys and sells on the IRS Form 8949 for your capital gains filing.

Tax Advantages of DeFi

For starters, DeFi lending converts your currencies to Liquidity Pool Tokens. Your liquidity tokens remain the same, but their value increases over time. You make a capital gain when redeeming your LPTs for the original cryptocurrencies.

DeFi converts what should be your regular income into capital gains income. Consequently, you qualify for deductions if you make losses later selling the tokens.

DeFi allows you to borrow tokens with different cryptocurrencies acting as collateral in Ripple’s XRP for the long-run, but ETC is more profitable in the short-term.

Long-term capital gains offer more deductibles than short-term ones, and you shouldn’t keep selling your XRP to leverage ETH’s profitability. You can borrow ETH with XRP as the collateral if the prospective earnings are more than interest costs.

Tax Disadvantages of DeFi

Whenever you exchange a crypto asset for another, you are most likely triggering a taxable event. This makes it cumbersome to track all profits and losses made every time such DeFi transactions occur.

Tax Treatment Overview on Different Platforms

  • Uniswap

Uniswap executes the Liquidity Pool protocol for its crypto lenders. It empowers you to swap income tax liability for capital gains liability, which is deductible. UNI tokens basically cushion you from future losses on the native coin you want to lend.

  • Maker/Oasis

This DeFi service allows you to harness long-term tax deductions on capital gains. The platform allows you to trade between assets and even earn interest on other assets. They allow you to lock your ETH as collateral, and as it gathers capital gains, you can seize the short-term profitability of other blockchain networks.

  • Compound

Compound is also a Liquidity Pool platform, which converts your ETH to cETH. When the liquidity pool earns interest, the value on your cETH will move from income tax liability to capital gains revenue, deductible for losses.

  • Balancer

Balancer is another Liquidity Pool DeFi service. It’s sort of a tax-lien insurance package against future losses on crypto assets. 

Parting Shot

Ignorance cannot be your defense when you are found to be non-compliant. The DeFi markets are enormous and have the potential to overtake centralized finance in years to come. The IRS knows this fact, as do most sovereign central banks. 

Fortunately, DeFi taxes are friendly, and they offer numerous tax-saving opportunities. You stand to make tremendous capital gains and high, compounding interest rates investing in DeFi. The gains are way bigger than the tax costs. 

Enforcement over DeFi taxes will only get more aggressive, intuitive, and efficient. That’s why you need to read this article and share it with your friends. Take charge of your tax compliance, and share some of your most effective tax filing tips for DeFi transactions. 

Categories
Crypto Market Analysis

Daily Crypto Review, Jan 25 – Ethereum Reaches a new All-Time High: What’s Next?

The crypto sector ended up mostly in the green as altcoins pushed up (while Bitcoin remained mostly stable). Several cryptocurrencies reached new all-time highs, including Ethereum and Aave. Bitcoin is currently trading for $33,335, representing an increase of 1/59% compared to yesterday’s value. Meanwhile, Ethereum’s price has increased by 7.93% on the day, while LTC gained 2.12% of its value.

Daily Crypto Sector Heat Map

Foglory Coin gained 389.19% in the past 24 hours, making it the most prominent daily crypto gainer by far. It is followed by Unifty’s 187.19% and MileVerse’s 160.11% gain. On the other hand, EveryCoin lost 76.45%, making it the most prominent daily loser. It is followed by Zloadr’s loss of 62.48% and FUTUREXCRYPTO’s loss of 54.1%.

Top 10 24-hour Performers (Click to enlarge)

Bottom 10 24-hour Performers (Click to enlarge)

Bitcoin’s market dominance dropped further from when we last reported, with its value currently being 62.7%. This represents a 2.1% decrease from our previous report.

Weekly Crypto Market Cap Chart

The cryptocurrency sector’s market capitalization has increased greatly since we last reported, with its current value being $991.66 14.56 billion. This represents a $77.10 billion increase when compared to our previous report.

_______________________________________________________________________

What happened in the past 24 hours?

_______________________________________________________________________

_______________________________________________________________________

Technical analysis

_______________________________________________________________________

Bitcoin

Bitcoin has spent the weekend with its price slowly descending towards the $30,000 mark until a new surge of buyers changed the price direction. BTC has bounced from the $30,900 level and pushed up past the $33,250 level. Its price is currently consolidating in the $33,400 zone.

Bitcoin’s upside is guarded not only by the $34,627 level but the recent high of $33,865. Traders will have to be careful when taking long positions on BTC and will have to devote most of the time checking the order flow to properly gauge the resistance levels.

BTC/USD 1-hour chart

Bitcoin’s 4-hour and weekly overviews are bullish and show some signs of neutrality or bearishness, while its monthly overview is completely bullish. On the other hand, its daily time-frame is pretty neutral.

BTC/USD 1-day Technicals

Technical factors (1-hour Chart):

  • Price is slightly above its 50-period EMA and its 21-period EMA
  • Price is close to its top Bollinger band
  • RSI is near the overbought area (64.47)
  • Volume is slightly below average

Key levels to the upside:          Key levels to the downside:

1: $34,627                             1: $32,350

2: $37,445                             2: $30,072

3: $38,000                             3: $27,960

Ethereum

The second-largest cryptocurrency by market cap “decoupled” from Bitcoin and pushed up, surging to its all-time highs and briefly creating a new one at $1,477.3. Ether is currently fighting to stay above $140 and enter the price discovery mode yet again.

Ethereum has quite a lot of support levels right beneath its current price, most notably the $1,440, $1,420, and $1,350 levels. Its upside levels past the all-time high will, however, have to be determined by drawing Fib retracement levels.

ETH/USD 1-hour Chart

Ethereum’s technicals on the 4-hour, daily, and weekly time-frames are bullish and show some signs of neutrality or bearishness, while its monthly overview is completely bullish.

ETH/USD 1-day Technicals

Technical Factors (1-hour Chart):

  • Price is above both its 50-period and its 21-period EMA
  • Price near its top Bollinger band
  • RSI is very close to being overbought (68.27)
  • Volume is above average

Key levels to the upside:          Key levels to the downside:

1: $1,440                               1: $1,420

2: $1,477.3                            2: $1,350

3: $1,500                               3: $1,211

Litecoin

Litecoin’s weekend went without much price fluctuation, with LTC moving between $133 and $143.5. However, LTC bulls managed to push past the $142.1 level and bring its price to $145, where it is now consolidating. Litecoin’s volume also surged during the price increase.

Litecoin traders will have to pay attention to several factors, including LTC technicals, Bitcoin price movement as well as Ethereum price movement.

LTC/USD 1-hour Chart

Litecoin’s overviews on all time-frames are bullish, with its 4-hour, daily, and weekly time-frames having some signs of neutrality, while its monthly overview is completely bullish.

LTC/USD 1-day Technicals

Technical factors (1-hour Chart):

  • Its price is slightly above its 50-period EMA and its 21-period EMA
  • Price slightly above its middle Bollinger band
  • RSI is neutral (63.36)
  • Volume is slightly above average

Key levels to the upside:          Key levels to the downside:

1: $161.5                               1: $142.1

2: $181.3                               2: $128.42

3: $186.3                               3: $120

Categories
Crypto Videos

Crypto Ban Petition Attempt! Is He Just Serving His Own Interests?


British Financial Advisor Creates a Crypto Ban Petition


Neil Liversidge, a veteran financial advisor and the owner of the independent financial advisory firm West Liversidge, has called on the government of the United Kingdom to fully ban transactions in cryptocurrencies like Bitcoin.

Liversidge’s strong opinion on the topic goes as far as him starting a petition urging the local financial authorities to stop cryptocurrency transactions in the UK. The petition has the goal to:

“Legislate to prohibit the payment by or any form of acceptance of cryptocurrencies by UK resident businesses or individuals, and to require UK regulators (the FCA and PRA) to prohibit any transactions by UK financial institutions in cryptocurrencies.”

Liversidge cited an anti-crypto narrative common amongst crypto disbelievers, arguing that cryptos such as Bitcoin have no intrinsic value and that they “can be a destabilizing influence on society, and mostly used for criminal activity.” The financial advisor also thinks that cryptocurrency proof-of-work mining is “harmful to the environment.”

The aforementioned petition’s deadline is July 7, 2021, according to the UK Government and Parliament website. At the moment, the petition has collected 108 signatures.

In an interview with finance-focused publication Professional Adviser on Jan 13, Liversidge noted that a blanket ban on cryptocurrency transactions in the UK would help the enforcement reduce the power of criminals using cryptocurrencies like Bitcoin for illicit activity. “Law enforcement will never catch all of the people that use crypto for illicit activities; it won’t even catch most of them. However, destroying their financial base reduces their power.”

Liversidge acknowledged that a crypto ban would immediately trigger a market crash: “If the UK government takes the lead and bans transactions on cryptos as my petition requests, that will surely set off a chain reaction, crashing cryptocurrencies overnight,” he said.

The IFA’s verdict is that all cryptocurrency investors should immediately sell their holdings: “If you’re holding cryptos now, my advice to you would be to find a bigger fool than you and dump it all quickly.” Liversidge also stated that he has “never owned any and never would own any” cryptocurrency, even if he knew it would net him hundreds of percent of returns.

Categories
Forex Daily Topic Forex System Design

Trading System design – Manual Backtesting your Trade Idea

We have a potential trading idea, and we would like to see if it is worthwhile. Is it really critical to code it? No. But very convenient? Yes.

Manual historical backtesting

There is no need to code the strategy to do an initial validation test. All we have to do is pick a chart, go back in time and start performing trades manually. But how to do it properly?

  1.  Use a trading log spreadsheet, as the one forex.academy provides.
  2. Thoroughly describe the methodology, including the rules for entry, stop-loss, and take-profit settings. 
  3. Use a standard 1 unit trade size ( 1 lot, for example) in all the trades.

Once the rules of the game have been set, we position the chart, start moving the action one bar at a time, and trade the chart’s right side. It is critical to take all the signals the strategy offers. Cherrypicking spoils the test.

Market Condition

The financial markets move in phases. We should think it has two main phases and three directions.


The two main phases are impulses and corrections.

The three movements are Upward (Bullish), downward (bearish), and sideways (consolidations).

Bear and bull directions are mostly similar in the Forex market because currencies are traded in pairs, so the quote currency’s bear market is the base currency’s bull market and vice-versa. 

With commodities, precious metals, and cryptocurrencies against fiat, this does not hold.

To properly test your strategy, you should apply it in all market directions and phases. Even better is performing a different evaluation for each market state. That way, your evaluation will tell you in which market conditions it works best and in which is not acceptable to apply it; thus, you could create a complementary rule to filter out the market phases in which the strategy fails.

Different markets

You must apply the strategy to all markets you intend to trade using it. As with the market conditions, you should test each market separately. After having all markets tested, you will find useful information regarding how markets the strategy works best and the correlations among markets when using it. That applies, of course, if you use the same timeframes and periods in all markets, which is advisable.

If you do it as said, you can also perform the summation of all markers date by date and assess the overall performance, its main parameters, and system quality.

Pros & Cons of manually backtesting 


  • No programming skills are required.
  • It helps you perceive how a real market evolves trade by trade.
  • You will find the potential logic errors, such as stop-loss wrongly set, take profits too close to the opening, thus 
  • You will be able to correct most of the gross mistakes of the strategy.


  • Cherrypicking. Discipline is key. If you start cherrypicking, you no longer are testing your original idea.
  • Most people doing manual backtesting do not properly trade all phases and markets. Not always thoroughly test all markets and their conditions, as it would require a lot of time. Thus the test is incomplete.
  • Time-consuming. A complete manual backtest takes much longer than a computer-generated backtest.
  • Awkward optimization. Optimization is also tricky and time-consuming. That is so because a parameter change would need another backtesting.

Final words

Manual backtesting allows us to have a first impression of how a new trade idea would fare in real trading, but a thoroughly manual backtest and optimization are time-consuming. Therefore, serious traders should start developing basic programming skills to automate both processes.

Categories
Crypto Daily Topic Cryptocurrencies

How to Come Up With a Good Bitcoin Investment Strategy

Surprisingly, many people just buy Bitcoin and fumble with the investment until they make some profit. Investing in Bitcoin is actually a serious venture, and contrary to widespread practice, it needs a strategy! But what is an investment strategy anyway? What constitutes a good strategy? And, does it apply to all forms of Bitcoin investment?

These are the hard questions we seek to answer in this article. 

Is There a Right Way to Invest?

When investing in crypto or any other asset, you can gain or lose. The most successful investors are those who combine tactic, experience, and of course, luck. Since we cannot do anything about experience and luck, we are usually left with the tactic in the playground, and that’s where planning comes in. We’re not saying that there is a right or wrong way to invest. But, if you are really keen on maximizing your profits and keeping risks at bay, then planning for that journey is indispensable.

What is an Investment Strategy?

An investment strategy is a calculated approach that helps an investor make decisions to achieve specific goals. The investor could be seeking to multiply wealth. They could be seeking to protect whatever they already have. Regardless of the circumstances, an investment strategy must consider the investor’s goals, risk tolerance, and future capital needs. 

What Constitutes a Good Strategy?

Keeping in mind the above picture of what an investment strategy is, it is easy to figure out what a good one should be made of. Generally, you can consult the following checklist if you want to come up with a sound Bitcoin investment strategy.

  1. It contains your definition of risk tolerance – Risk is a central component of any investment strategy. Defining your risk tolerance helps you apply brakes when the train is accelerating in the wrong direction. It might sound trivial, but desperate decisions are never far from the mind when things get thick. 
  2. It identifies your goals – An investment strategy is nothing without goals. It should be clear from the start what you want to achieve from such an engagement. 
  3. It should be realistic – If it were that easy to make money, everyone would be rich. The excitement one gets when approaching an investment may mislead them to overshoot.
  4. It should aim at maximizing profits and minimizing risks – well, that’s the whole point of investing. 

This is by no means an exhaustive definition of a good investment. However, it is a fair guide on how to approach planning for your Bitcoin investment. With this background in mind, let us look at how you can develop an award-winning Bitcoin investment strategy.

Step #1 Identify the opportunity and the risk

If there is no opportunity, abort the mission. Diving straight into an investment without identifying whether there is a suitable opportunity sounds like gambling. After all, the whole purpose of venturing into investment is taking advantage of some opportunity. 

Spotting opportunities is not always easy, but sometimes it is. An example of opportunity in Bitcoin investment is the crypto’s rising value. This could be a short term opportunity or something that will outlive this generation (no one knows how long Bitcoin will sustain the uptrend). However you look at it, we must agree that identifying the opportunity is the basis of everything.

With opportunity comes risks. As mentioned earlier, risk is a core part of any investment strategy. The opportunity might be huge, but so could be the risk. If there is reason to believe that the current Bitcoin boom is a fad, the risk associated with investing all your savings would be catastrophic. The bottom line is, you should identify how much risk the opportunity presents and how much of it are you willing to tolerate.

Step #2 Decide how much and for how long

The amount of money you should invest and for how long are crucial parameters. Of course, you’re not planning to hold Bitcoin until you die. But if that is your intention, it should be clear from the onset. Holding assets indefinitely and without a plan defies the purpose of accumulating wealth.

However, this is not a rule cast in stone. For instance, if you plan to protect your wealth, you might want to convert a huge chunk of your dollar savings to Bitcoin, and short time fluctuations will not be a bother because profits will average out over time. 

Step #3 Invest – a plan without action is pointless.

Now that you have a clear goal and an understanding of the opportunities and risks, it is time to invest. Depending on your goals, you may find one investment approach more suitable than others. Typical options for investing in Bitcoin include:

  • Trading – With trading, you can either go for spot trading or derivatives trading. With spot trading, you simply buy Bitcoin when you think it is trading at a low price and sell when you believe the price has gone high enough. Without concrete investment goals, it is difficult to remain disciplined when spot trading as periods of explosive uptrends and epic falls might send you into euphoric buying/ panic selling episodes, respectively.
  • HODLing – This is where you buy Bitcoin and keep it with no intention of using the asset in the short run. This approach may be more suitable if you plan to protect your wealth or diversify your investment portfolio. Wealth stored in Bitcoin can be readily liquidated and converted to fiat money. You can also use such investments to acquire crypto loans. 

Step #4 Monitor your investment

An investment is like a seed – once sowed, the growth journey has only begun. Keeping an eye on your investment helps you to determine whether your strategy needs editing. If you believe you made mistakes in your original plan, there is no shame in revising it until you feel you have gotten it right. It is important to practice emotional control while observing how events unfold during the course of the growth of your wealth. You should also stay updated and keep learning, as that’s the only way to align your strategy with the reality of the market. 

Final Thoughts

Investing in Bitcoin is not complicated, but without planning for it, the chances of going nowhere with your investment are high. A good investment strategy, we have seen, needs to define your goals, your risk tolerance, be realistic, and focus on maximizing profits while keeping risks under control. There is no right or wrong way to invest, but that does not mean a planless investment is also acceptable. Similarly, the four-step approach described above is not the only sound methodology. However, it captures most of the crucial elements that will help your Bitcoin strategy stand out. Feel free to play around with it!

Categories
Crypto Market Analysis

Daily Crypto Review, Jan 22 – Bitcoin Briefly Drops Below $30K; Market Sees Blood on the Streets

The crypto sector ended up almost completely in the red as Bitcoin’s drop below $30,000 (at one point) led the market down. Bitcoin is currently trading for $31,730, representing a decrease of 8.41% compared to yesterday’s value. Meanwhile, Ethereum’s price has decreased by 11.29% on the day, while LTC lost 4.76% of its value.

Daily Crypto Sector Heat Map

EveryCoin gained 734.83% in the past 24 hours, making it the most prominent daily crypto gainer by far. It is followed by Vox.Finance’s 132.94% and DACC’s 129.86% gain. On the other hand, PegsShares lost 99.20%, making it the most prominent daily loser. It is followed by Mithril Share’s loss of 75.17% and Chimpion’s loss of 59.53%.

Top 10 24-hour Performers (Click to enlarge)

Bottom 10 24-hour Performers (Click to enlarge)

Bitcoin’s market dominance stayed at the same spot as when we last reported, with its value currently being 64.8%.

Weekly Crypto Market Cap Chart

The cryptocurrency sector’s market capitalization has decreased greatly since we last reported, with its current value being $914.56 billion. This represents a $10.97 billion decrease when compared to our previous report.

_______________________________________________________________________

What happened in the past 24 hours?

_______________________________________________________________________

_______________________________________________________________________

Technical analysis

_______________________________________________________________________

Bitcoin

Bitcoin has had a horrible day as bears took over the market. Its price dropped to as low as $28,800, but found support in its 50-day EMA. The downturn, however, means that the largest-cryptocurrency by market cap fell out of its triangle formation, most likely spelling a start of a short-term downtrend or sideways trading phase.

Bitcoin is very unpredictable at the moment, but traders could find an opportunity in looking for drastic volume increases and “catch the wave” of buyers or sellers (while taking into account all the support and resistance levels).

BTC/USD 1-hour chart

Bitcoin’s weekly and monthly time-frames are bullish but show some signs of neutrality or bearishness. On the other hand, its 4-hour and daily time-frames are completely bearish.

BTC/USD 1-day Technicals

Technical factors (1-hour Chart):

  • Price is slightly below its 50-period EMA and at its 21-period EMA
  • Price is at its middle Bollinger band
  • RSI is neutral after returning from being oversold (48.04)
  • Volume is above average

Key levels to the upside:          Key levels to the downside:

1: $32,350                             1: $30,072

2: $34,627                             2: $30,000

3: $37,445                             3: $27,960

Ethereum

The second-largest cryptocurrency by market cap followed Bitcoin’s direction, but with slightly less intensity. Ether’s price dropped below the $1,211 and $1,183.85 levels and found support in the $1,047.6 level. However, the bounce that came after the bulls came into the market was insufficient to break the $1,183.85 level, and Ethereum’s price is now trading just below it.

The $1,183.85 level could be considered a pivot point, and ETH’s short-term price direction will greatly depend on whether bulls manage to break this resistance.

ETH/USD 1-hour Chart

Ethereum’s technicals are still mostly tilted towards the buy-side, with its longer time-frames (weekly and monthly) being completely bullish, while its daily time frame’s oscillators are pointing to the sell-side. On the other hand, its 4-hour time-frame is completely bearish.

ETH/USD 1-day Technicals

Technical Factors (1-hour Chart):

  • Price is below its 50-period and at its 21-period EMA
  • Price is at its middle Bollinger band
  • RSI is neutral (45.02)
  • Volume is above average

Key levels to the upside:          Key levels to the downside:

1: $1,183.85                          1: $1047.5

2: $1,211                              2: $960.5

3: $1,350                             3: $932.5

Litecoin

Litecoin’s movement in the past 24 hours much resembled Ethereum, with its price dropping below the $142.1 level and finding support slightly below the $128.4 level. While its push up did not reach the now-resistance level of $142.1, Litcoin did find support in the 21-hour EMA.

Litecoin’s volume increase in recent hours is negligible compared to the increase that Bitcoin and Ethereum saw. This may indicate less intensity in the moves to come, regardless of the price direction.

LTC/USD 1-hour Chart

Litecoin’s weekly and monthly time-frames are completely bullish and but show no signs of neutrality or bearishness. On the other hand, its 4-hour and daily time-frames are completely bearish.

LTC/USD 1-day Technicals

Technical factors (1-hour Chart):

  • Its price is slightly below its 50-period EMA and slightly above its 21-period EMA
  • Price slightly above its middle Bollinger band
  • RSI is neutral (51.31)
  • Volume is slightly above average

Key levels to the upside:          Key levels to the downside:

1: $142.1                               1: $128.42

2: $161.5                               2: $120

3: $181.3                               3: $114.75

Categories
Crypto Videos

Bitcoin is a Possible Reserve Currency – Former Canadian Prime Minister Says!


Bitcoin is a Possible Reserve Currency – Former Canadian Prime Minister 

Stephen Harper, a former prime minister of Canada, says there may be a place for Bitcoin as well as central bank digital currencies as part of a basket of reserve currencies that may replace the dollar.

In an interview with the investment service, Cambridge House’s Jay Martin Harper stated the possibility of the US dollar being completely replaced could only come from a large currency such as the Euro or Chinese Yuan. He expressed his doubts when it comes to either of them being a viable alternative currency given the uncertainty over the value of the Euro in the long term and the “arbitrary measures” that the Chinese government would take when it comes to guiding the value of the Yuan:

“It’s very hard to see what the alternative is to the US dollar as the world’s major reserve currency. Other than possible candidates such as gold, Bitcoin, a whole basket of things… I think you’ll see the sheer number of things that people use as reserves will certainly expand, but the US dollar will still be the bulk of it.”

The former prime minister then added that he thought central bank digital currencies were to some degree “inevitable,” but that they would likely be subject to monetary policy around the world. Harper stated his concern about central banks becoming “some kind of a general banker” rather than just a financial monitor that they currently are:

“Ultimately, if you have a digital currency that will be used by the central bank to control inflation and create a stable currency as well as priceability, then this digital currency is just a straightforward evolution of the marketplace,” Harper stated. “But if it is part of a series of what I consider as wild experiments as to the role of central banking… Well, then it worries me a lot.”

Stephen Harper served as the prime minister of Canada for nine years, from 2006 until 2015. Cryptocurrency and blockchain adoption in Canada has started expanding significantly since his departure, with the country getting its first regulated crypto exchange in Sept. 

Categories
Crypto Videos

Canada’s First Public BTC Fund Grows 900% Passing 1 Billion Dollars!


Canada’s first public BTC fund grows 900% as it passes the $1 billion milestone

Canadian regulated digital asset manager 3iQ has passed another massive milestone of its public Bitcoin fund. 

On Jan 14, 3iQ’s Bitcoin Fund hit the $1 billion mark, as the company announced the news on Twitter. The new milestone shows QBTC’s parabolic growth after 3iQ originally launched the fund in April 2020. QBTC is up 900% from its previous milestone of $100 million recorded in Oct 2020.

As previously reported, 3iQ’s BTC fund is the first public Bitcoin fund in Canada that got listed on a major stock exchange, the Toronto Stock Exchange. Gemini, a firm owned by the Winklevoss brothers, provides custody services for 3iQ’s QBTC fund.

QBTC.U is currently trading at $48.63, up 330% from the $11 price it was trading for when it got listed in April.

3iQ is one of the largest cryptocurrency firms in Canada. In Jan 2018, 3iQ reportedly became the first cryptocurrency fund regulated by the Ontario Securities Commission as well as the Canadian Securities Administrators. Two years after that, in Feb 2020, 3iQ partnered with the blockchain startup Mavennet to launch a stablecoin that would be pegged to the Canadian dollar. This stablecoin would be regulated by the Financial Transactions and Reports Analysis Centre of Canada (FINTRAC).

3iQ’s former senior executive Shaun Cumby is currently the CEO of Arxnovum, a company that filed an application with OSC for a Bitcoin exchange-traded fund on Jan 11, 2021. Winklevoss’ Gemini will also provide its custody for the Arxnovum’s Bitcoin ETF.

Categories
Crypto Market Analysis

Daily Crypto Review, Jan 21 – BTC in a Triangle Formation – What do the Analysts Say?

The crypto sector was split between slight gainers and slight losers, but overall lost some value as the market cap dropped below $1 trillion. Bitcoin is currently trading for $34,644, representing a decrease of 2.39% compared to yesterday’s value. Meanwhile, Ethereum’s price has decreased by 4.12% on the day, while LTC lost 5.41% of its value.

Daily Crypto Sector Heat Map

Cocos-BCX gained 107983.76% in the past 24 hours, making it the most prominent daily crypto gainer by far. It is followed by HAPY Coin’s 383.49% and Vox.Finance’s 371.42% gain. On the other hand, PegsShares lost 59.35%, making it the most prominent daily loser. It is followed by KIMCHI.finance’s loss of 44.21% and EveryCoin’s loss of 34.88%.

Top 10 24-hour Performers (Click to enlarge)

Bottom 10 24-hour Performers (Click to enlarge)

Bitcoin’s market dominance has moved down slightly since our last report as altcoins started to outperform, with its value currently being 64.8%. This value represents a 0.1% difference to the downside when compared to the previously reported value.

Weekly Crypto Market Cap Chart

The cryptocurrency sector’s market capitalization has decreased slightly since we last reported, with its current value being $955.53 billion. This represents a $69 billion decrease when compared to our previous report.

_______________________________________________________________________

What happened in the past 24 hours?

_______________________________________________________________________

_______________________________________________________________________

Technical analysis

_______________________________________________________________________

Bitcoin

Bitcoin’s daily time-frame shows that the cryptocurrency is still contained within the triangle formation, which will be a major determinant in BTC’s future price movement. If we zoom in to the hourly time-frame, we can see that BTC moved down, broke the $34,627, and pushed towards the downside, but got instantly stopped by the triangle formation’s bottom line.

While Bitcoin’s short-term overview seems slightly bearish, many analysts call for a push towards $60,000 before any major pullback. However, judging by the current trading session, BTC has a higher chance of breaking the triangle formation to the downside at the moment.

BTC/USD 1-hour chart

Bitcoin’s weekly and monthly time-frames are completely bullish and show no signs of bearishness. On the other hand, its daily time-frame oscillators point to “sell” while the rest of the overview is still bullish, and its 4-hour time-frame is completely bearish.

BTC/USD 1-day Technicals

Technical factors (1-hour Chart):

  • Price is slightly below both its 50-period EMA and its 21-period EMA
  • Price is slightly below its middle Bollinger band
  • RSI is neutral (44.21)
  • Volume is average (low)

Key levels to the upside:          Key levels to the downside:

1: $37,445                             1: $34,627

2: $40,000                             2: $32,350

3: $42,000                             3: $27,960

Ethereum

The second-largest cryptocurrency by market cap went into retracement mode after creating a new all-time high of $1,440 two days ago. Ether’s price moved in a straight descending pattern at first but then bounced back up and tried to retest the $1,350 level. As time passed, it was more and more evident that ETH failed to break $1,350 to the upside and that its price is now contained between $1,350 to the upside and $1,211 to the downside.

Ether’s current upside is heavily guarded, not only by the $1,350 level but also by the 21-hour and 50-hour EMAs.

ETH/USD 1-hour Chart

Ethereum’s technicals on all time-frames are bullish, but only its daily time-frame shows no signs of neutrality or bearishness. The rest of the time-frames (4-hour, weekly, and monthly) have their oscillators pointing to a neutral or bearish stance.

ETH/USD 1-day Technicals

Technical Factors (1-hour Chart):

  • Price is slightly below its 50-period and its 21-period EMA
  • Price is slightly below its middle Bollinger band
  • RSI is neutral (44.30)
  • Volume is average

Key levels to the upside:          Key levels to the downside:

1: $1,350                               1: $1,211

2: $1,420                               2: $1,183.85

3: $1,440                              3: $1047.5

Litecoin

Litecoin spent the day trading on very low volume compared to the previous days, with its price contesting the $142.1 level twice. At the moment, LTC traders can face two scenarios, one being LTC falling below $142.1 level and pushing towards $128.4, and the second one being that LTC acts on the double bottom it created and pushes up to regain some of the lost value.

LTC/USD 1-hour Chart

Litecoin’s technicals are pretty split, with its 4-hour and daily indicators showing almost complete bearish sentiment and its weekly and monthly overviews showing complete bullishness.

LTC/USD 1-day Technicals

Technical factors (1-hour Chart):

  • Its price is slightly below both its 50-period EMA and its 21-period EMA
  • Price between its middle and bottom Bollinger band
  • RSI is neutral (41.78)
  • Volume is below average

Key levels to the upside:          Key levels to the downside:

1: $161.5                               1: $142.1

2: $181.3                               2: $128.42

3: $186.3                               3: $114.75

Categories
Crypto Daily Topic Cryptocurrencies

Now You can Earn Interest on Your Idle Crypto Assets with Nexo

Apart from HODLing and spending, many crypto users have no idea what to do with their crypto assets. Nexo, a leading financial institution for digital assets, provides crypto users with the opportunity to earn interest on their idle crypto assets. Overall, the concept is simple – you entrust your assets with Nexo, they invest them primarily through lending, and you share the returns. It works almost like a traditional investment bank; only that crypto is the main asset here.

Naturally, many questions will emerge regarding the profitability of Nexo’s offerings, its security, usability, and much more – investors are an inquisitive lot. This article will answer some of the most pertinent ones if only that will give you the confidence to join the league of passive investors. 

What Is Nexo?

Before we rush into how to invest with Nexo, let us first understand what it is. Simply put, Nexo is (arguably) the world’s leader in the provision of digital banking services. The company has strived to bring traditional banking to the world of crypto by merging fintech with blockchain. Nexo specializes in providing lending facilities in the DeFi space. According to the company, $5 billion worth of digital loans have been processed on the platform since its establishment in 2018. The company enjoys a user base of over 1 million and is available in nearly every corner of the planet. 

How Do You Earn?

Nexo offers a variety of crypto financial services, with lending at the top of the list. To earn, you need to deposit supported digital assets (both fiat and crypto) to your Nexo account. The following steps should help with the process:

  1. Register for an account on platform.nexo.io 
  2. Enable 2-factor authentication (this is mandatory)
  3. Scroll down until you find a list of supported crypto assets and select ‘Top Up’ on the one you wish to invest in. Besides the token, you will see how much interest you can earn from each one and what options there are for maximizing your interest.
  4. Nexo will generate a deposit address and a QR code. You can either copy the address or scan the code. It is extremely important to double-check this address before depositing since Nexo puts a disclaimer for funds sent to the wrong address. You can also top up your Nexo account directly from an exchange. If you are depositing BTC, your transaction will appear after 6 nodes have confirmed the transfer. For ETH and other ERC-20 tokens, 50 is the required number of confirmations. 
  5. You can follow the progress of your deposits on the transactions page/ tab.
  6. Interest is earned when you withdraw from your available credit line. The withdraw button is conveniently placed next to the deposit button. 

The steps may look numerous, but really, the entire process can be summarized as ‘top up supported assets and start earning automatically.’ In other words, once you deposit, no other effort is required from you – that’s the true spirit of passive earning. 

Which Digital Assets Can You Invest?

Nexo supports the following digital assets:

  • Bitcoin
  • Ether
  • Litecoin
  • Bitcoin Cash
  • Nexo Token
  • XRP (Ripple)
  • Tether
  • USD Coin
  • Dai
  • Euro
  • GBP
  • Several others

Is Nexo a Good Investment?

As an investor, you have the choice to bid your assets in a portfolio of your choice. So, what would make you choose Nexo first? The following factors might:

  • You can earn up to 12% interest on stablecoins. Interest earned depends on the asset you have deposited and the method you choose for payout. Earning in Nexo for selected stablecoins attracts the full 12% interest.
  • While interest is calculated on an annual percentage rate (APR), payouts are made daily. So you don’t have to wait for end-year dividends like most investments.
  • You can deposit or withdraw funds at any time of your liking.
  • Your deposited assets are backed by a $100 million insurance secured with BitGo.
  • There are no minimum contribution thresholds and no fees charged for funding or withdrawing from your wallet.

Are There Any Risks?

Any keen investor would be worried about the safety of their investment, especially if their assets will be used to extend credit to others. With Nexo, this is not a matter of great concern as your assets and those of others are backed by a $100 million insurance at BitGo. Deposits are also stored in multisig cold storage wallets so you can rest easy as your money works for you. 

Additionally, borrowers have a limit based on their deposited crypto assets. Nexo uses a complex formula to dynamically calculate credit limits based on the dynamic value of digital assets. So, Nexo is unlikely to run out of cash due to overborrowing. 

Lastly, while this is not a risk per se, it is worth noting that first time users may find the platform a little cumbersome to use. The website has only scanty information about what you need to do to get started, and you are likely to fumble around looking for where to click next. Clearly, the platform has not been customised for the crypto investor who’s just starting out. 

Reputation and Regulation 

Nexo boasts of a good reputation among users of crypto financial services. On TrustPilot, a leading consumer review website, 90% of users have ranked it ‘excellent,’ with a score of 4.8/5. The company is also licenced and regulated by the European Central Bank, besides being certified as ISO/IEC 27001:2013 compliant. With such credentials, you can be assured that you will be dealing with a legitimate and tried, and trusted platform. 

But What’s The Catch?

For those who are still not convinced about the viability of Nexo’s business model, questions on where’s the catch will linger. The way this financial institution operates is quite similar to traditional banks – users deposit their assets (usually dollars, euro, etc.), which gives the banks the capital to finance credit and other investments. The only difference is that Nexo cannot rely on traditional loan recovery techniques in case a borrower defaults. Therefore, the company depends on a user’s deposited assets as collateral. You can deposit multiple assets to maintain a positive loan-to-value ratio. This ratio is an indicator of your ability to settle the debt. If you default, Nexo will automatically initiate a sale of your deposited assets until the desired balance is achieved. 

Final Thoughts

‘Earn passively from your idle crypto assets’ sounds just as cool as it is, especially when using Nexo. The platform allows you to deposit a variety of crypto assets and earn up to 12% interest. Interestingly, all you need to do is deposit funds to your Nexo wallet, just as you would do with a crypto exchange. Nexo’s investment terms are quite friendly. For instance, there are no minimum deposits, you can deposit or withdraw at any time, payouts are done daily, and so on. Additionally, the platform ensures the security of your funds is guaranteed by implementing 2-factor authentication for deposits and withdrawals, insuring depositors’ funds, and storing them in multisig cold storage wallets. The only downside with Nexo is the limited information on the website, which might leave new investors struggling to get started. 

Categories
Crypto Videos

Grayscale GBTC Faces Competition!


GBTC Faces Competition in the OTC Bitcoin Trust Market

Osprey Funds has just entered the crypto sector and is trying to become Grayscale’s competitor. The firm is offering an over-the-counter Bitcoin trust under the ticker symbol OBTC. The trust Osprey offer is similar to Grayscale’s Bitcoin Trust, also known as GBTC.

“The Osprey Bitcoin Trust provides an easy access to Bitcoin,” the firm’s website says. They charge a 0.49% management fee, which is the lowest cost solution currently on the market. As they stated, Osprey is an entity that “builds digital asset solutions for intelligent investors,” with the OBTC trust considered its “flagship offering.”

“OBTC began operating and being quoted in the OTC market on Friday, Jan 15,” Osprey Funds’ CEO, Greg King, said, adding:

“As of Jan 14, the product met all the requirements to become quoted under the OBTC ticker in the OTC market. In the next 30 days, the fund will attempt to become DTC eligible, and after Feb 14, all additional market makers will be allowed to quote it. 

Osprey’s launch in the BTC trust market is a direct poke at the largest Bitcoin trust, Grayscale. Grayscale has become one of the largest BTC holders in the world, currently possessing over 500,000 BTC.

GBTC stepped into the market with the idea to provide the public with easier access to Bitcoin through more traditional avenues, all while not even requiring them to custody their own funds. GBTC comes with a yearly 2% management fee, which is where Osprey wants to step in and beat the competition. Osprey’s recently unveiled BTC trust announced a management fee of only 0.49%. 

“We are always happy to see cryptocurrency access products enter the market, especially here in the US,” CEO of Grayscale Michael Sonnenshein told Bloomberg.

Accredited investors will require a $25,000 minimum to buy directly into the trust. Additionally, OBTC shares have a lock-up period of one year before they can be sold in the secondary market. As a comparison, Grayscale’s Bitcoin Trust requires a six-month lock-up. However, based on King’s comments to Bloomberg, the public may expect Osprey’s lock-up period to be cut in half in the near future.

Categories
Crypto Videos

JPMorgan Chase Executives Talk About Stablecoins!


JPMorgan Chase Executives Talk About Stablecoins

During a JP Morgan Chase’s Q4 2020 earnings call, the firm’s CEO Jamie Dimon and CFO Jennifer Piepszak discussed the OCC’s recent approval of banks being able to use stablecoins for payments, as well as whether or not this approval will have any significant impact on the development of JPM Coin, the company’s private digital currency. 

During the Q&A portion of the call, Portales Partners analyst Charles Peabody asked the executives about the OCC approval for banks to use various public blockchain networks for payments.

“That guidance enables an offering of stablecoins going on a public blockchain. That doesn’t impact the JPM coin. You should think about JPM coin as the tokenization of our customer deposits,” stated JP Morgan CFO Jennifer Piepszak, according to the call transcript.

However, she did not completely rule out the possibility of a stablecoin backed by JPM if customers showed interest.

“It’s obviously very early. We will assess the use cases and customers’ demands. But, it is still too early to see where everything goes for us.”

JPM CEO Jamie Dimon was quick to jump in and mention that the bank is currently “using blockchain for sharing data with banks,” and adding that their bank is at the forefront of development.

Debuted in Oct 2020, JPM Coin is used on the backend of JPM’s payments systems, helping the firm settle nearly $6 trillion in payments on a daily basis. 

Ultimately, Dimon seemingly implied that crypto payments settlement wouldn’t greatly change how JP Morgan operates.

“I do expect that stuff is coming soon, and it may not change our world all that much.”

However, Dimon may be underestimating the impact that crypto will have on the payments landscape. Paypal is one of the Fintech giants that Dimon mentioned by name as a direct competitor, confirmed that crypto payments would be available in 2021. The CEO — a former skeptic of cryptocurrencies — made it very clear that payments will become an increasingly crowded field over the next decade:

“I expect it to be a very, very tough competition in the next ten years. However, I expect to win. So help me, God.”

Categories
Crypto Daily Topic Cryptocurrencies

Earn Passively with VeriBlock’s Latest Tech: Proof of Proof

Innovations in the cryptosphere are fast and wild. Recently, VeriBlock released the novel proof-of-proof protocol, which allows blockchains to inherit Bitcoin’s security. The organization’s unique technology solves two problems simultaneously. First, a diverse ecosystem of blockchains – each focused on addressing a unique need – is secured. Secondly, gains made from the increased adoption of these alternate blockchains will drive more transactions out of the Bitcoin network, thereby increasing Bitcoin’s scalability, and by extension, solving the pioneer blockchain’s major headache.

While this technology is expected to transform Bitcoin and the entire crypto universe, the best part is that you can take part in the revolution and earn passively. 

In this article, we will look closely at this interesting concept and discuss the opportunity in it.

What Is Proof-of-Proof (PoP)?

At the core of it, PoP is a form of mining. VeriBlock envisioned an ecosystem of blockchains – each addressing diverse problems – but with the full security of Bitcoin. But why Bitcoin? You may ask. 

Currently, Bitcoin is the largest cryptocurrency network and is rightfully considered the golden standard of security. Attacking the network would require massive investment in specialized computational infrastructure, all thanks to the high number of nodes in the network paired with its consensus algorithm. It is argued that to stage a 51% attack against Bitcoin, even the world’s fastest supercomputer would be of no use. Smaller blockchains have had to endure this vulnerability for years, but not anymore.

Simply put, VeriBlock’s PoP scheme will allow participating blockchains to use Bitcoin for a second-layer of consensus. So, first, they do their own proof-of-work consensus then push the transactions to Bitcoin through VeriBlock’s blockchain. 

The VeriBlock ecosystem acts as an aggregation layer between alternative blockchains and Bitcoin. Whenever a new blockchain joins this ecosystem, VeriBlock becomes even more decentralized and more secure due to the increased network effect. 

What’s The Deal?

For VeriBlock’s technology to work, PoP miners are needed, and that’s where you come in. As discussed above, the technology works by having transactions mined in their original blockchains then published to Bitcoin in a decentralized, trustless, transparent, and permissionless (DTTP) manner. Hence, your work as a PoP miner will be pushing blockchains, which already have intermediate consensus, to Bitcoin to receive the final security seal. The backend mechanics are complex, but the user’s role is suitable for a layperson.

With VeriBlock’s PoP, everyone stands to benefit. We have seen that PoP miners get their commissions by pushing transactions to the second layer of verification. On the other hand, innovators working on alternative blockchains will see their projects boosted as users become more confident in adopting these blockchains. The thing is, it is easier for developers to build applications on alternative blockchains where speed and scalability are non-issues. But security remains a challenge for such networks. Therefore, it is easy to understand why the whole crypto community should rejoice at the release of this invention.

How Do You Earn?

Unquestionably, VeriBlock’s PoP technology is too complex to be discussed here, but luckily, you do not need to understand the intricacies to participate and earn.

Send Bitcoin, get paid! Earning with VeriBlock’s PoP is that simple. The company has partnered with ZelCore to make this dream a reality. From December 2020, ZelCore users can earn $VBK by sending Bitcoin from their wallets. On the updated wallets, users will find $VBK alongside BTC, BCH, LTC, and other major cryptos. 

For the earning part, all you really need to do is update your ZelCore wallet to get the new feature. Any time you send Bitcoin from your ZelCore wallet, you will be taking part in VeriBlock’s second layer of consensus and getting paid for the hard work. Again, for emphasis, you do not need to do any manual validations – sending BTC is sufficient to earn you rewards.

In the bag of goodies, we also had some 1.5 million $VBK, which was to be shared among the first 15,000 users to upgrade their wallets by December 21. If you did upgrade before then, kudos! If not, your second chance is to earn by sending BTC from your ZelCore wallet.

Rewards are earned in VeriBlock coins ($VBK), which can be converted to other major cryptocurrencies. The conversion is expected to be smooth as $VBK is already listed as an asset in the updated wallet. Paying out earnings through $VBK was necessary because that’s the network that performs the final consensus, which is understandably confusing as Bitcoin would be expected to be doing this task. 

Which Wallets Are Supported?

At the moment, you can only participate in this passive earning scheme if you are using the ZelCore wallet. Some consider this a disadvantage given that the wallet is not open-source, and for being a commercial wallet, users are charged monthly maintenance fees to use some features. Nonetheless, the developers have tried to compensate for this by offering highly reliable customer support and unmatched user experience. 

About the ZelCore Wallet

ZelCore is a multi-asset crypto commercial wallet that supports over 170 digital assets. It integrates the services of a number of major exchanges, including Changelly, InstaSwap, Coinswitch, and Kyber, so you have it all under one roof. The application, which is available for both mobile and desktop devices, offers beautiful interfaces, best-in-class security, including two-factor authentication, great usability, and seamless integration of new features, which the company promises to roll out continuously. 

Why Should You Participate in VeriBlock’s PoP?

First, to earn passively. VeriBlock’s PoP gives ordinary Bitcoin users – those without any special mining equipment – the opportunity to earn from mining. This idea is not only novel but exciting too. It is not often that you can make money by almost investing nothing. Also, mining has, hitherto, been a reserve of those with the financial muscle to invest what it takes to set up the specialized infrastructure.

Secondly, your participation in VeriBlock’s PoP scheme will be for the greater good of the cryptoverse. The growth of alternate blockchains has been hampered significantly by security issues related to the 51% attack. It has been difficult for merchants and exchanges to list tokens from alternate blockchains when the risk of double-spend stares at them. Thus, when you take part in proof-of-proof validations, you are helping alternate blockchains to grow.

Final Thoughts

Earning passively is one of the easiest and effortless ways to earn from crypto. With VeriBlock’s proof-of-proof invention, ordinary Bitcoin users can make extra money by validating transactions. Participating is easy – one only needs to download a ZelCore wallet (or update it for existing users) and start sending BTC from the wallet. There is a slight limitation in the use of the ZelCore wallet as it is a commercial product. Nonetheless, its usability, security, customer support, and its wide variety of features make it worth the trouble. VeriBlock may extend the technology to other wallets, but as to which ones and when, that remains a matter of conjecture. Overall, we may point out a few areas of improvement for VeriBlock’s PoP earning scheme. Still, we must also agree that this is a noteworthy opportunity for Bitcoin users to earn effortlessly.

Categories
Crypto Market Analysis

Daily Crypto Review, Jan 20 – ETH Reaches a New All-Time High; Crypto Sector in the Red

The crypto sector ended up mostly in the red as altcoins started retracing after their moves to the upside. Bitcoin is currently trading for $35,776, representing a decrease of 2.1% compared to yesterday’s value. Meanwhile, Ethereum’s price has increased by 3.28% on the day, while LTC lost 3.44% of its value.

Daily Crypto Sector Heat Map

Folder Protocol gained 813.46% in the past 24 hours, making it the most prominent daily crypto gainer by far. It is followed by Global Gaming’s 198.29% and Benchmark Protocol’s 159.89% gain. On the other hand, 3XT TOKEN lost 85.20%, making it the most prominent daily loser. It is followed by Ether Kingdoms Token’s loss of 61.70% and Matrix AI Network’s loss of 52.48%.

Top 10 24-hour Performers (Click to enlarge)

Bottom 10 24-hour Performers (Click to enlarge)

Bitcoin’s market dominance has moved down since our last report as altcoins started to outperform, with its value currently being 64.9%. This value represents a 0.7% difference to the downside when compared to the previously reported value.

Weekly Crypto Market Cap Chart

The cryptocurrency sector’s market capitalization has decreased slightly since we last reported, with its current value being $1.024 trillion. This represents a $10 billion decrease when compared to our previous report.

_______________________________________________________________________

What happened in the past 24 hours?

_______________________________________________________________________

_______________________________________________________________________

Technical analysis

_______________________________________________________________________

Bitcoin

Bitcoin’s daily time-frame shows us that the largest cryptocurrency by market cap is still contained within the triangle formation (purple). Any break of the current sideways movement may contest the triangle as well. On the other hand, BTC on the 1-hour time-frame is bouncing between the $34,627 support and the $37,445 resistance level for the past five days.

Bitcoin’s price will soon have to break the sideways trading pattern and contest the triangle formation. If BTC bulls or bears manage to break the triangle formation, we could see a large move in the same direction.

BTC/USD 1-hour chart

Bitcoin’s short-term (4-hour and daily) technicals are slightly tilted towards the sell-side but still show a hint of neutrality or bullishness. Its weekly and monthly technicals are exactly the opposite, as they are slightly bullish but show some bearishness alongside it.

BTC/USD 1-day Technicals

Technical factors (1-hour Chart):

  • Price is slightly below both its 50-period EMA and its 21-period EMA
  • Price is slightly below its middle Bollinger band
  • RSI is neutral (44.32)
  • Volume is average (low)

Key levels to the upside:          Key levels to the downside:

1: $37,445                             1: $34,627

2: $40,000                             2: $32,350

3: $42,000                             3: $27,960

Ethereum

The second-largest cryptocurrency by market cap took advantage of the “altcoin season” as money moved from Bitcoin and onto other altcoins. Ever since Ether’s price bounced from the $1,211 level on Jan 18, we could see bulls coming to the market in larger numbers. This made the $1,350 level fall, and ETH finally set a new all-time high of $1,440. While the new ATH is just $20 away from its previous one, this is considered a testament to Ethereum’s upside potential.

Ether couldn’t position itself above the $1,420 (previous ATH) and fell below as it started retracing. Its price is now testing the $1,350 level but will most likely stay above it.


ETH/USD 1-hour Chart

Ethereum’s technicals on all time-frames are tilted towards the buy-side, but all show a hint of bearishness in the oscillator department.

ETH/USD 1-day Technicals

Technical Factors (1-hour Chart):

  • Price is above its 50-period and at its 21-period EMA
  • Price is slightly below its middle Bollinger band
  • RSI is neutral (50.69)
  • Volume is above average

Key levels to the upside:          Key levels to the downside:

1: $1,420                               1: $1,350

2: $1,440                               2: $1,211

3: $1,450                               3: $1,183.85

Litecoin

Litecoin spent the day retracing from the recent $166.2 high after bulls reached exhaustion. LTC was trying to push towards the $180 levels and contest the 2021 highs but failed to do so as bulls spent too much strength in the $160 area, where the cryptocurrency faced heavy resistance.

Litecoin is now having a downward trajectory and has failed to break the 50-hour moving average in an attempt to break it. LTC traders may look for a trade after the cryptocurrency finishes testing the $142.1 level.

LTC/USD 1-hour Chart

Litecoin’s technicals on the 4-hour and monthly time-frames are completely bullish and show no neutrality or bearishness. On the other hand, its daily and weekly overviews show some form of bearishness.

LTC/USD 1-day Technicals

Technical factors (1-hour Chart):

  • Its price is below both its 50-period EMA and its 21-period EMA
  • Price sightly below its middle Bollinger band
  • RSI is neutral (44.85)
  • Volume is average

Key levels to the upside:          Key levels to the downside:

1: $161.5                               1: $142.1

2: $181.3                               2: $128.42

3: $186.3                               3: $114.75

Categories
Crypto Daily Topic Cryptocurrencies

What Is It Like Investing in Tezos (XTZ)?

Smart contract safety, long-term upgradability, and open participation: these are the problems Tezos promised to solve when it was created in 2018. So, the developers built the network to facilitate peer-to-peer transactions and launch smart contracts. Behind the network sits the Tez (also called Tezzie) digital token, which is the focus of this article. 

If you are familiar with Ethereum smart contracts, you might already understand Tezos’ offering. However, the slight difference between smart contracts on these two networks is that Tezos allows participants to directly control the network’s rules. This makes Tezos not just a re-invention of the Ethereum wheel but a rather more flexible and scalable platform for implementing smart contracts. 

Tez can be considered a major crypto. By market capitalization, it ranked #19 at the time of writing. It’s availability in multiple exchange pairs and listing on major exchanges indicates that it is a popular asset among investors. 

This article will look at what it is like investing in Tez and answer questions such as is it a good investment.

What is Unique about Tezos?

One of the things that make Tezos unique is its proof-of-stake consensus. Unlike Bitcoin, consensus on the Tezos network is achieved by stakers, whose mining power depends on how much Tez they hold. Relying on this consensus mechanism might have given the crypto some resilience against the cryptocurrency bear market of 2019. Between October 2019 and February 2020, the crypto recorded triple growth. This is a remarkable movement – at the time of writing this, even Bitcoin, in its current biggest bull run yet, has not attained triple growth.

Performance in 2020

Tezos is known for euphoric investment. During its ICO launch, it raised $232 million, one of the biggest ICOs at the time. Well, in 2020, the crypto has shown similar tendencies – fluctuating between less than a dollar and $4. Such volatility has only been shown by a few cryptocurrencies. Again, we must acknowledge how large these fluctuations are. Despite the relatively low price, the percentage changes are tremendous. 

Tez was trading at roughly $1.3 at the beginning of 2020. By mid-February, it had rallied to trade at $3.7. Prices soon crashed to lows of $1.3 a month later. Between April and July, Tez demonstrated rare stability exchanging at about $2 and only fluctuating slightly. In August, the crypto experienced its largest spike of the year, and at some point, fetched a whopping $4.2 at exchanges. The prices have since dropped to $2, which so far seems like its point of equilibrium.

24-hour trading volumes for the crypto indicate drastic changes in investor activity. There was only 30 million worth of trade per day as the year opened, but by mid-February, this number had increased 10-fold. By mid-August, the volume was 20 times. Even when the prices dropped to the $1.3 figure witnessed at the start of the year, 24-hour trading volumes never declined below $70 million. 

The volume of trading exhibited by Tez shows how enthusiastic investors have been with this crypto. Coupled with its relatively high volatility, we can conclude that Tez has been the perfect asset for short-term trading, at least according to investors’ 2020 trading patterns. 

The Future of Tezos

We have seen that, due to its volatility and high trading volume, Tez performs impressively in the short term. For investors who seek to grow their investment in the long term, questions on Tez’s suitability still persist. 

Tezos had a promising start right from its introduction to the initial coin offering. As earlier mentioned, the crypto raised one of the highest amounts ever raised in a cryptocurrency ICO. The faith investors have placed on the crypto from the start indicates its potential and guarantees some level of support for its growth.

Tez has also shown tremendous resilience in the past. After the successful ICO, legal disputes delayed its launch for almost a year. Even so, when it finally launched in 2018, investors had not lost faith in the project – which can be proven by how fast it rallied to reach triple gains. Tezos’ market rank is another indicator of its resilience and aggressive growth. For a crypto that is only 2 years in the market, claiming a position among the top 20 cryptocurrencies is no mean feat.

These past indicators describe a crypto with a solid foundation, good reputation, and the community support needed for future growth.

Adoption in The Banking Sector

The network’s flexibility and scalability also imply that we will see new use cases regularly. In 2019, barely a year after Tezos was launched, BTG Pactual and Dalma Capital (both are reputable investment banks) announced that they will be using the Tezos blockchain for security token offerings (STO).

Tezos adoption in the banking sector is also likely to increase, particularly due to its security. Least Authority, an esteemed security auditing company, released a report affirming that ‘Tezos protects against chain reorganizations and selfish baking.’ Such approvals will go a long way in promoting the crypto’s adoption in the financial sector. 

Stability and Reliability

Tezos’ designers spent a lot of thought on the network’s stability. Unlike most crypto, Tezos has an advanced infrastructure that is not prone to hard forks. Users can vote on proposals to upgrade the protocol on the main blockchain. Through a process known as baking, users stake an amount of XTZ to participate in the voting process. Changes to the protocol become effective only after they have been backed by a super majority. This form of governance ensures the network is ‘built to last.’ As an investor, you will be protected from the uncertainty that comes with hard forks and the subsequent possibility of making a loss on your investment.

Is it Risky Investing in Tezos?

Cryptocurrencies are inherently risky investments. Tezos appears as a stable, secure, and well-governed blockchain. However, the currency faces the same volatility and speculation that all other cryptos face. No matter how lucrative Tezos might appear, the golden rule remains, never risk more than you can afford to lose.

Final Thoughts

Investing in Tezos can be an exciting experience – you can quickly gain or lose, and by high margins. The currency’s relatively high volatility makes it a particularly suitable asset for short term investment. In the long term, Tezos looks equally promising. It is secure, stable, and reliable. These characteristics position the crypto strategically for widespread adoption in the mainstream financial sector. The network’s immunity against hard forking is a guarantee of stability against hard fork uncertainties. While Tezos is a good investment, it is still risky due to the virtue of being a cryptocurrency. Therefore, it is best to exercise caution and avoid hype when making the decision to invest in Tezzie. 

Categories
Crypto Market Analysis

Daily Crypto Review, Jan 19 – Ether Breaks $1,300; Litecoin Skyrockets

The crypto sector was mostly green, with altcoins attempting to push up and reduce Bitcoin’s market dominance. Bitcoin is currently trading for $36,423, representing an increase of 3.85% compared to yesterday’s value. Meanwhile, Ethereum’s price has increased by 9.89% on the day, while LTC gained 13.38% of its value.

Daily Crypto Sector Heat Map

4THPILLAR TECHNOLOGIES gained 441.52% in the past 24 hours, making it the most prominent daily crypto gainer by far. It is followed by CryptoAds Marketplace’s 221.1% and YAMv2’s 181.43% gain. On the other hand, CY Finance lost 66.83%, making it the most prominent daily loser. It is followed by Basiscoin Share’s loss of 39.38% and Trading Membership Community’s loss of 37.1%.

Top 10 24-hour Performers (Click to enlarge)

Bottom 10 24-hour Performers (Click to enlarge)

Bitcoin’s market dominance has moved down since our last report, with its value currently being 65.6%. This value represents a 0.5% difference to the downside when compared to the previously reported value.

Weekly Crypto Market Cap Chart

The cryptocurrency sector’s market capitalization has returned above the $1 trillion mark since we last reported, with its current value being $1.034 trillion. This represents a $41.3 billion increase when compared to our previous report.

_______________________________________________________________________

What happened in the past 24 hours?

_______________________________________________________________________

_______________________________________________________________________

Technical analysis

_______________________________________________________________________

Bitcoin

Bitcoin spent the day mostly trading sideways, bound by the $34,627 to the downside and $37,445 to the upside. The price hopped between these levels and created a higher high higher low pattern, which later on broke after BTC couldn’t pass its immediate resistance level.

Bitcoin’s price has created a triangle pattern on the daily chart, and breaking this triangle to the upside or downside will determine the short-term price direction.

BTC/USD 1-hour chart

Bitcoin’s technicals on all time-frames show a slight bullish tilt, with its oscillators pointing towards the sell-side.

BTC/USD 1-day Technicals

Technical factors (1-hour Chart):

  • Price is at both its 50-period EMA and its 21-period EMA
  • Price is at its middle Bollinger band
  • RSI is neutral (49.56)
  • Volume is average (low)

Key levels to the upside:          Key levels to the downside:

1: $37,445                             1: $34,627

2: $40,000                             2: $32,350

3: $42,000                             3: $27,960

Ethereum

Unlike Bitcoin, Ethereum has spent the day first slowly preparing for a move and then explosively pushing to the upside. The second-largest cryptocurrency by market cap has, after confirming its position above the $1,211 level, shot up towards the $1,350 level, which it was not able to break. With the volume descending after that move, ETH will most likely not be able to break $1,350 unless a new wave of bulls comes into the market.

ETH/USD 1-hour Chart

Ethereum’s 4-hour, daily, and monthly technicals are completely bullish and show no signs of neutrality or bearishness. On the other hand, its weekly overview shows some neutrality.

ETH/USD 1-day Technicals

Technical Factors (1-hour Chart):

  • Price is above both its 50-period and its 21-period EMA
  • Price is at its top Bollinger band
  • RSI has just left the overbought area (67.24)
  • Volume has spiked up in the recent hours

Key levels to the upside:          Key levels to the downside:

1: $1,350                               1: $1,211

2: $1,420                               2: $1,183.85

3: $1,450                               3: $1,060.5

Litecoin

Litecoin was one of the largest daily gainers after its price suddenly shot up from $141 all the way up to $160 in just one hourly candle. While it seemed at first like the retracement will eat away the gains LTC made, the cryptocurrency made another push towards the upside and stopped just below the $161.55 resistance level.

Litcoin’s descending volume and price movement, as well as the number of sell orders near the $161.55 level, will most likely be enough to keep LTC below the resistance level for now.

LTC/USD 1-hour Chart

Litecoin’s technicals on the 4-hour, daily, and weekly time-frame are completely bullish, while its monthly technicals are slightly more neutral.

LTC/USD 1-day Technicals

Technical factors (1-hour Chart):

  • Its price is above both its 50-period EMA and its 21-period EMA
  • Price close to its top Bollinger band
  • RSI is neutral (66.70)
  • Volume is above average

Key levels to the upside:          Key levels to the downside:

1: $161.5                               1: $142.1

2: $181.3                               2: $128.42

3: $186.3                               3: $114.75

Categories
Crypto Daily Topic Cryptocurrencies

How to Take Advantage of Ethereum 2.0

Ethereum, the decentralized blockchain that features smart contracts, will be getting a series of upgrades that will see improved scalability, security, and sustainability. This massive upgrade will create new opportunities for investors. Apart from allowing Ethereum users to earn passively from staking, smart investors can take advantage of price changes during the launch of Ethereum 2.0 and multiply their investments. 

In this article, we will look at what is Ethereum 2.0, what investment opportunities it creates, and how you can be part of this development.

What is Etherum 2.0 All About?

Also known as Eth2, Ethereum 2.0 is fundamentally a shift from the current proof-of-work (PoW) consensus mechanism to a proof-of-stake (PoS) model. In the PoW model, the generation of new blocks relies on the computing power of each node on the network that is taking part in transaction validation. On the other hand, PoS relies on virtual miners (also called validators) and Ether deposits to achieve consensus. 

Besides changing the consensus mechanism, Eth2 also introduces shard chains – a mechanism that ‘splits’ the Ethereum blockchain and shares the processing task among different nodes. This approach increases the network’s processing capability by allowing concurrent processing of transactions – a shift from the traditional sequential processing. 

While the upgrade is squarely technical, its economic and financial implications will be far-reaching. 

How Will Eth 2.0 Affect Prices?

Whenever a major event happens on certain crypto, its prices are bound to change due to increased speculation. In the wake of the anticipated Eth2 launch, upward price movements were observed. The launch was set to happen on 1st December, and a week to this launch, ETH prices had gone as high as $600. While this rally might have been due to other factors, such as the general positive sentiment on cryptocurrencies, the surge observed just a week before the event can’t be coincidental. 

Speculation aside, Eth2 is bringing improved transaction speeds and lower costs – factors likely to increase demand for the crypto. Already, exchanges are reporting declined sell pressure, which indicates that investors are not eager to sell ETH at the moment. The speed and transaction cost improvements will also automatically cascade to tokens that run on the Ethereum blockchain. This will trigger even more demand for the crypto and, thus, better prices. 

Staking in Eth 2.0

The introduction of staking in Eth2 creates a new opportunity for investors to earn by validating transactions, and this is the latest investment opportunity we would like to discuss. 

Simply put, staking in Eth2 implies depositing 32 ETH to activate validator software – the tool you will be using to process transactions. As a validator, you will have the power (and duty) to process transactions and add new blocks to the blockchain, and earn rewards while at it.

Rewards are given to validators for pushing transaction batches into new blocks and validating other validators’ work. While there are bountiful rewards in staking, you might lose ETH if you are unavailable to perform validations or if you use your stake against Eth2 validation specifications. 

How to Stake in Eth 2.0

Staking involves sending 32 ETH to the following address: 

0x00000000219ab540356cbb839cbe05303d7705fa

However, you will need to use the launchpad dedicated for this purpose. The address above is for verification purposes only. The process involves several distinct steps, summarized as follows:

  1. Review Eth2 staking agreement/ terms and conditions
    1. Sign up on the launchpad. This will involve depositing the 32 ETH.
    2. Agree that it is your responsibility to keep your validator online.
    3. Agree that you are liable to slashing (incurring a large penalty) if you act against validation specifications.
    4. Agree that you understand that your mnemonic (or seed) is the only way to access your funds and that you will keep it safe.
    5. Agree to safeguard your key stores, which will hold your keys, and provide the public keys to the launchpad site to activate your validator.
    6. Agree that you cannot transfer your staked ETH until Phase 1 and that you cannot withdraw until Phase 2.
    7. Agree that once you exit, you cannot rejoin as staking is a long-term commitment. (The completion of each phase depends on reaching a certain amount of staked ETH. Thus, withdrawals will keep extending timelines for this smart contract).
    8. Accept early adoption risks, i.e., software and design flaws that may result in the loss of your ETH.
    9. Agree that you are technically capable of configuring a validator.
  2. Select an Eth1 client that will run parallel to your Eth2 client. This is necessary to process deposit transactions coming from the Eth1 chain.
  3. Select an Eth2 client and set up a node. You can choose between Prysm, Nimbus, Lighthouse, and Teku. Nimbus is one of the most versatile as it can run even on older smartphones.
  4. Select the number of validators you would like to run and the operating system you will use. Remember, to operate each validator, you will need 64 ETH.
  5. Upload the validator which you downloaded/ built from the previous step.
  6. Finally, connect your wallet.

While staking in Eth2 is quite technical, especially for the average user, a comprehensive step-by-step guide is provided on the Ethereum launchpad website. It is also worth acknowledging the thoroughness with which the documentation was put together by the Eth2 team to guide potential validators. If you use this guide, you are unlikely to get stuck simply due to technical difficulty. 

Is Eth 2.0 Staking a Good Idea?

Staking in Eth2 is a double-edged sword – it comes with both benefits and risks. When you commit your ETH to the staking contract, you are almost guaranteed returns just from staking. However, returns are highly variable. In fact, it is impossible to tell how much you can earn by staking a fixed amount of ETH until you actually receive the reward. Even so, if you stake and consistently participate in validation, you will get rewarded. 

Secondly, staking means locking your ETH to the network for some time, without the possibility of withdrawing it at least until Phase 1.5. This is akin to depositing with a fixed account, whose interest can be compared to the growth of ETH in the near future. 

While staking is a good way to earn from Eth2, you might want to consider the following risks:

  • Staking is a one-way deposit. ETH you send to the contract address cannot be withdrawn until an unknown future date (this is until Phase 1.5 of the upgrade is reached).
  • Profits you earn from staking also remain staked until this unknown future date.
  • Validation is a responsibility that all stakers must undertake. By being offline, you will lose as much as you would have earned if you were available for validation.

Final Thoughts

The coming of Eth2 brings with it exciting investment opportunities. Other than the traditional trading and HODLing, Eth2 allows you to commit some funds to the network and join other validators and earn exclusive rewards from it. Risks, including early-adoption software bugs and slashing due to being offline, exist. However, all considered, staking is a worthy venture that ETH investors should consider. 

Categories
Crypto Market Analysis

Daily Crypto Review, Jan 18 – Bitcoin Drops During the Weekend, ETH Remains Strong

The crypto sector spent the weekend in a mostly descending fashion, with BTC continuing its short-term downtrend. Bitcoin is currently trading for $35,258, representing an increase of 0.14% compared to yesterday’s value. Meanwhile, Ethereum’s price has decreased by 0.39% on the day, while LTC lost 0.46% of its value.

Daily Crypto Sector Heat Map

Astosch gained 285.95% in the past 24 hours, making it the most prominent daily crypto gainer by far. It is followed by ALL BEST ICO’s 273.67% and Yeld Finance’s 264.65% gain. On the other hand, Bestay lost 87%, making it the most prominent daily loser. It is followed by Zugacoin’s loss of 85.51% and VKF Platform’s loss of 77.77%.

Top 10 24-hour Performers (Click to enlarge)

Bottom 10 24-hour Performers (Click to enlarge)

Bitcoin’s market dominance has moved down since our last report, with its value currently being 66.1%. This value represents a 2.3% difference to the downside when compared to the previously reported value.

Weekly Crypto Market Cap Chart

The cryptocurrency sector’s market capitalization has dropped below the $1 trillion mark since we last reported, with its current value being $993.33 billion. This represents a $43.67 billion decrease when compared to our previous report.

_______________________________________________________________________

What happened in the past 24 hours?

_______________________________________________________________________

_______________________________________________________________________

Technical analysis

_______________________________________________________________________

Bitcoin

Bitcoin spent the weekend following the downtrend it started on Jan 14, with its price slowly declining from a high of $39,600 to a low of $33,833. During the downtrend, the price has contested and broken the $36,640 level to the downside and looks like it will contest the $33,200 level in the near future. BTC is currently trading at a little above $35,000, representing a weekly loss of 6.09% and a monthly gain of 29.87%.

Bitcoin’s price has responded well to the 21-day moving average and found very strong support there. Staying above this level will be crucial if BTC wants to turn to the upside.

BTC/USD 1-hour chart

Bitcoin’s technicals on the daily, weekly, and monthly time-frame are completely bullish and show no neutral or bearish signs. On the other hand, its 4-hour overview is completely bearish.

BTC/USD 1-day Technicals

Technical factors (1-hour Chart):

  • Price is slightly below its 50-period EMA and its 21-period EMA
  • Price is slightly below its middle Bollinger band
  • RSI is neutral (43.00)
  • Volume is descending

Key levels to the upside:          Key levels to the downside:

1: $36,640                             1: $33,200

2: $40,000                             2: $30,640

3: $42,000                             3: $27,960

Ethereum

Unlike Bitcoin, Ethereum’s weekend was not spent in a downfall. The second-largest cryptocurrency by market cap headed towards the $1,300 level but failed to break it, which prompted a weekend of sideways trading. While ETH did break the $1,211 level to the downside, the $1,183.85 level held up. Ether is currently trading in a very narrow range, bound by the aforementioned levels.

ETH’s short-term movement will greatly depend on two factors: Bitcoin’s volatility and Ether itself, breaking its immediate support or resistance levels.

ETH/USD 1-hour Chart

Ethereum’s technicals all time-frames are tilted towards the buy-side, with the 4-hour, daily, and weekly overviews fully pointing towards the buy-side. Its monthly overview, however, has oscillators pointing towards neutrality.

ETH/USD 1-day Technicals

Technical Factors (1-hour Chart):

  • Price is slightly below its 50-period and its 21-period EMA
  • Price is between its middle and bottom Bollinger band
  • RSI is neutral (43.72)
  • Volume is slightly below average

Key levels to the upside:          Key levels to the downside:

1: $1,211                               1: $1,183.85

2: $1,255                               2: $1,060.5

3: $1,350                               3: $1,047.5

Litecoin

Litecoin mirrored Bitcoin’s movements over the weekend, stepping into a downtrend that started on Jan 14, after Litecoin couldn’t push its price to $160. The price is currently fighting for the $142.1 level, which it has recently broken to the downside.

While Litecoin’s movements seem to mirror Bitcoin’s, its volume remains stable despite Bitcoin’s volume dropping. At the moment, LTC might be a better choice for people that want to be less affected by Bitcoin’s volatility.

LTC/USD 1-hour Chart

Litecoin’s technicals on the daily, weekly, and monthly time-frame are completely bullish and show no neutral or bearish signs (though they are slightly less bullish than Bitcoin’s overviews). On the other hand, its 4-hour overview is completely bearish.

LTC/USD 1-day Technicals

Technical factors (1-hour Chart):

  • Its price is slightly below its 50-period EMA and its 21-period EMA
  • Price close to its bottom Bollinger band
  • RSI is neutral (42.47)
  • Volume is average

Key levels to the upside:          Key levels to the downside:

1: $142.1                               1: $128.42

2: $161.5                               2: $114.75

3: $181.3                               3: $97.8

Categories
Crypto Videos

Is Bitcoin sucking the life out of the Forex market?


Is Bitcoin sucking the life out of the Forex market?

Thank you for joining this forex academy educational video.

In this session, we will be asking if bitcoin is having a negative impact on the forex market by reducing the volume of transactions?

In this daily chart of bitcoin to the US dollar, it was only back in October that we reported that bitcoin had found a support line at 10000, and at the time of writing, we suggested there could be a surge up to and above 12,000 by the end of 2020. A retest of the previous high in 2017 around the 19,500 level, shown here at position B, would have then been on the cards.

Here we can see a somewhat muted pullback to position C, but the 2017 crash to the 3,000 level was not repeated, and the price went on to find support above the key 20K exchange rate.

The acceleration during position d up to 42000 was a purely speculative fuelled bull run,  where most of this move can be put down to companies such as PayPal, the CME  clambering balls, the bitcoin euphoria bandwagon, and countries such as Switzerland  opening its arms too to companies in the bitcoin space.  These factors only go to legitimise bitcoin’s space in the investment market arena and where it has called a modern-day gold Rush with day traders in a spare room buying on the CFDs market, hedge funds, and banks and other institutions clamouring aboard the bull run in fear of missing out.

A potential side effect of this incredible move higher and interest in the bitcoin space may well be the reason why the currency markets seem to be flattening out. Certainly, cable,  seen here with its recent top of 1.3700, since leaving the European Union with an eagerly anticipated free trade agreements in place,  has flatlined since the beginning of January.  And while some of this might be attributed to the increased rates of Covid spreading through the United Kingdom, one has to wonder if some traders in the forex space are throwing caution to the wind to buy bitcoins while side-lining currencies.

The flatlining of the cable exchange rate also coincides with the most volatile period of buying activity for bitcoin, and this period is also reflected in this one-hour chart of the US dollar to Japanese yen, which is also trading within a fairly narrow range of just 146 pips during a similar timeline.

Again, this is repeated with the euro US dollar pair over the same timeline price is relatively flat and consolidating within a fairly narrow 145 pip range.

The similarity between the timelines of activity and flattening with the forex pairs while exponential growth in bitcoin to the upside cannot be ignored.  However, is this trend, if based on our hypostasis correct, likely to continue?

It is completely natural for professional traders to bail out of one asset class a jump into another if they see potential to make money.  This is what training is all about recognising opportunities and jumping aboard.

Before we consider if this is likely to continue, let’s go back to our bitcoin US dollar daily chart, where we have highlighted the most recent candlestick.

This one single daily candlestick on the 7th of January shows a range between 42,000 at the top and 36,500 at the bottom, which is a huge 5,500 dollar move in a single date.

If institutional or retail traders get it wrong, the consequences can be grave, with enormous losses piling up. The problem at these levels is that traders will be wondering if this incredible bull run has reached the top of the market and is due for a crash, with memories going back to 2017 where bitcoin to the dollar crashed from 19,500 to just above 3000 in a short space of time.  Here we are seeing swings of over 5,000 points in a single day,  which is unnerving,  making it dangerous to trade. 

And this is why many investors in bitcoin will be dubious about buying at the current levels, which might see some inflows back into the forex currency space, with other investors In digital currencies looking for more opportunities with potential for long-term growth.

PLEASE LINK https://www.youtube.com/watch?v=GEtlPyBDU3g

A few months ago, we reported on a new digital coin with its own ecosystem: the AXIA Coin, which might be a front runner for alternative investments in digital currencies.  We understand that the company is close to launching, so please watch out for updates, which we will bring you soon. Meanwhile, you can find more details about the AXIA coin at www.axiacoin.org.  

 Meanwhile, watch out for extra volume creeping into the forex space, causing currencies to break from their current consolidation trends, as we have demonstrated here.

Categories
Crypto Daily Topic

What is coin burning all about?

The crypto adoption juggernaut rolls full steam ahead. You need only look at the increasing number of outlets accepting crypto payments to prove this. Even governments that once approached them with cynicism have caught on to the act. The big migration to CBDCs is now a matter of time.

Whereas the growing acceptance is positive, it comes with its misgivings. Although the proliferation of coins and tokens expands choices, it raises concern about sustaining cryptos’ value within the cryptosphere.

Cryptos are good at mitigating inflation, but they’re not immune to it. Crypto projects have had to devise the means of controlling this. As such, coin burns have been the tool of choice. But what are coin burns? How does one execute them? Importantly what is their value? Stick around as we go deep into the subject. 

What Is Coin Burning?

Coin burning is the process of removing a set volume of cryptos from circulation.  In doing so, developers and miners reduce their total supply. 

Eater Addresses/ Blackholes

Coin burning entails sending cryptos to public addresses with unobtainable private keys. Also known as eater addresses or blackholes, these addresses render the coins useless. Nevertheless, they allow for their public viewing and peer verification on the blockchain.

Coin Burning Varies With The Project

Depending on the frequency of the coin burning process, we can classify it into two broad categories:

  • One time burns – are one-off coin burns popularly embraced by  ICO projects to clean the market of unsold coins.
  • Periodic Burns- these are undertaken repeatedly at either fixed or varying intervals; Binance holds quarterly coin burns while Tether does so per withdrawal or collection

What are The Approaches to Coin Burning?

There are two major approaches to coin burning. These are:

  • Mechanisms relating to the token’s blockchain protocol
  • Mechanisms driven by economic sense

Protocol Related Mechanisms

In this category, we have coin burning mechanisms embedded in the project’s core protocol layer. We may divide these into two main groups.

  • Proof of Burn Mechanisms
  • Anti Spam mechanisms
i) Proof of Burn Mechanisms

These use the  Proof of Burn (PoB) consensus that requires miners to prove that they’ve burnt some of their coins. PoB has several variants:

  • Burning Native Coins for Mining Rights- miners must burn some of their coins to acquire block mining rights;  an example is Slimcoin.
  • Burning Bitcoins to Create New Native Coins- projects like  Counterparty (XCP) use PoB that burns BTC in exchange for a similar value of coins in the native currency, XCP
  • Burn-And-Mint Equilibrium: an advanced version of PoB used by  Factom (FCT) that burns native tokens in return for Entry Credits for storing data on its blockchain
ii) Anti Spamming Mechanisms

Introducing a cost to transactions prevents spamming and DDOS attacks that compromise the network. Projects like  Ripple (XRP) and Request Network (REQ) integrate a burning mechanism for every transaction on their network. Though indirectly, their Users ‘incur’ the cost of trading on them. The ecosystem gains in value resulting from a reduced supply of native coins. 

Mechanisms Driven By Economic Sense

These are mechanisms informed by a project’s economic considerations. They may be one-offs or periodic.

i) Mopping up of The Unsold ICO Tokens

At times ICOs fail to meet their hardcaps. Consequently, remain with unsold tokens. The projects may decide to destroy these to maintain their credibility.

ii) Paying out Dividends to the Coin Holders

Profitable projects may use their profits in buying back their native coins from the public. They then destroy the repurchased coins, thus paying them some dividend, which increases the value to coin holders.

What are the Steps Followed in a Coin Burning Event?

The coin burning event follows a sequence of four steps. Here’s its breakdown:

  • Institution of the burn function- the coin holder starts by calling the burn function, indicating the number of coins they intend to burn.
  • Verification of the coins  for burning- The contract proceeds to determine the ownership and validity of the selected coins, considers positive numbers only
  • Abortion of the burn function- The process aborts if the instigator has fewer coins or uses a negative value or zero.
  • Execution of the Burn function- the smart contract withdraws  the sums from the instigator’s wallet, permanently cutting them from circulation 

Why do Crypto Project’s Institute Coin Burns?

You’d think that coin burning is beneficial. Wouldn’t you? After all, you have Key players like Binance and Tether performing them. What then are its benefits

i) Appreciation in the Crypto’s Value

Cryptos are decentralized. In essence, market forces determine their prices. Coin burning depletes the sum of coins serving the market. As a result, their value rises to attain equilibrium. The attainment of market equilibrium is essential in stabilizing the price(value) of the crypto.

ii) Ensuring Network Stability

As stated elsewhere in this article, coin burning is key to eliminating Spam and DDOS. Accordingly, the network becomes stable.

iii) To Mop Up The Unsold Tokens From an ICO or Token sale

Crypto projects initiate ICOs to get public buy-in. Towards these, they set aside a certain percentage of the coins hoping that the investors will acquire the whole lot. However, things don’t always go that way, resulting in a remnant of those coins.

iv) Winning Investors’ Trust

The token insurer burns the coins remaining unsold from the ICO. They do this to ensure a level playing field for all investors. Were the issuer to keep the unsold coins, they’d have a massive advantage over other investors. Coin burning helps win the trust of other investors and incentivizes their stay within the project. 

A case in point is the Neblio cryptocurrency. Its team burned 122 million tokens that remained from their ICO. It sent them to an unspendable NEBL address.

v) Correcting Errors in Coin Issuance

At times projects realize errors in the creation of their tokens or coins. As such, they turn to coin burns to remedy this situation. A case in mind is Tether. The company realized that it had erroneously produced $ 5 Billion USDT. It resorted to a coin burn to maintain its 1:1 peg to the USD. Allowing the extra coins to stand would have destabilized the ratio.

vi) Guaranteeing The Developers’ Commitment to the Project

Coin burning signals the Developers’ commitment to the project. Look at it this way: the coin burn reduces their supply. At the same time, it increases the value of the coin or token in question. Burning is indicative of the developers’ desire to see the project grow in value and network function.

vii) Reduction of The Competition Between Miners

The Proof of Burn (PoW)  consensus is a popular offshoot of coin burning. Through it, a user destroys their coins to gain mining rights.

Managing Mining

PoB matches the number of blocks a miner can verify to the volume of coins they burn. This way, one’s mining ability increases with increased burning. Thus it reduces the number of miners and competition for resources between them.

Leveling the Playing Field Through Decay Rates

Since PoB favors the large-scale miner, they employ decay rates. This feature reduces one’s mining capacity with every verification. For them to remain profitable, it compels them to invest in more tokens to burn.

Final Thoughts

Although touted as the fix against inflation, cryptos aren’t immune to the same. Consequently, projects have had to find ways of guarding against it. Their default method has been the institution of coin burning: the deliberate removal of a given amount of coins from the market. It may be a one-off event or a periodic undertaking. Additionally, it could be a procedure hardwired into the project’s core protocol layer or driven by economic consideration. Whatever the cause, coin burning is an essential undertaking that, among other positives, infuses stability and confidence in any crypto project.

Categories
Crypto Market Analysis

Daily Crypto Review, Jan 15 – Bitcoin Retraces After Hitting $40k; Ethereum Contests $1.2k

The crypto sector was mostly stable in the past 24 hours, as most cryptocurrencies were trying to find their top or retraced slightly. Bitcoin is currently trading for $37,766, representing a decrease of 0.42% compared to yesterday’s value. Meanwhile, Ethereum’s price has increased by 5.98% on the day, while LTC gained 0.33% of its value.

Daily Crypto Sector Heat Map

FastSwap gained 244.13% in the past 24 hours, making it the most prominent daily crypto gainer by far. It is followed by HedgeTrade’s 225.26% and Capital.Finance’s 145.48% gain. On the other hand, Zugacoin lost 87.51%, making it the most prominent daily loser. It is followed by Roti Bank Coin’s loss of 77.52% and BitiPro Exchange Token’s loss of 74.35%.

Top 10 24-hour Performers (Click to enlarge)

Bottom 10 24-hour Performers (Click to enlarge)

Bitcoin’s market dominance has moved down slightly since our last report, with its value currently being 68.4%. This value represents a 0.6% difference to the downside when compared to the previously reported value.

Weekly Crypto Market Cap Chart

The cryptocurrency sector’s market capitalization has made negligible gains since we last reported, with its current value being $1.037 trillion. This represents a $5 billion increase when compared to our previous report.

_______________________________________________________________________

What happened in the past 24 hours?

_______________________________________________________________________

_______________________________________________________________________

Technical analysis

_______________________________________________________________________

Bitcoin

Bitcoin has ended its uptrend by hitting a high of $40,112 yesterday, prompting a slight pullback. The pullback was, just like the price increase, happening on low volume and had the same intensity as well. The only differentiating factor was its direction. The move to the downside ended with BTC’s price hitting the 50-hour moving average and pushing up.

Bitcoin has a couple of strong resistance lines to the upside, one being the immediate 21-hour EMA, and then the $40,000 and ultimately $42,000 levels. On the other hand, its support is guarded by the 50-hour EMA and the $36,640 level.

BTC/USD 1-hour chart

Bitcoin’s technicals on the daily and monthly time-frame are overall bullish but have oscillators pointing to the sell-side. On the other hand, its 4-hour and weekly overviews are completely bullish.

BTC/USD 1-day Technicals

Technical factors (1-hour Chart):

  • Price is between its 50-period EMA and its 21-period EMA
  • Price is slightly below its middle Bollinger band
  • RSI is neutral (50.19)
  • Volume is average

Key levels to the upside:          Key levels to the downside:

1: $40,000                             1: $36,640

2: $42,000                             2: $33,200

3: $43,600                             3: $30,640

Ethereum

Ethereum’s push to the upside has, just like with Bitcoin, seemingly ended. However, its pullback hasn’t started at all, as its price kept fluctuating between the recently $1,183.85 support level and the recent high. Trading in such a narrow range is not sustainable, and ETH will break either to the upside or downside very soon.

ETH traders can finally catch a nice trade as the cryptocurrency has (at least a bit) moved in a different manner than Bitcoin. Ether’s upside is guarded by the heavy resistance zone slightly below $1,300 as well as the $1,350 level. Its downside has smaller support levels, some of them being $1,211, $1,183.85, as well as the 21-hour and 50-hour EMAs.

ETH/USD 1-hour Chart

Ethereum’s technicals on the 4-hour and daily time-frames are overall bullish but have oscillators pointing to the sell-side. On the other hand, its weekly and monthly overviews are completely bullish.

ETH/USD 1-day Technicals

Technical Factors (1-hour Chart):

  • Price is above its 50-period and at its 21-period EMA
  • Price is near its top Bollinger band
  • RSI is neutral (61.37)
  • Volume is slightly below average

Key levels to the upside:          Key levels to the downside:

1: $1,255                               1: $1,211

2: $1,350                               2: $1,183.85

3: $1,419                               3: $1,060.5

Litecoin

Litecoin continued trading within its range, bound by $142.1 to the downside and $161.5 to the upside. Its price is now also between the 21-hour and the 50-hour EMAs, which have proven to be strong support and resistance levels, especially when paired with low trading volume.

Litecoin is currently mirroring the direction of Bitcoin’s moves, but with much less intensity. This makes it a very unattractive trading pair at the moment.

LTC/USD 1-hour Chart

Litecoin’s technicals on all time-frames are completely bullish and without any signs of neutrality.

LTC/USD 1-day Technicals

Technical factors (1-hour Chart):

  • Its price is slightly above its 50-period EMA and at its 21-period EMA
  • Price at its middle Bollinger band
  • RSI is neutral (53.10)
  • Volume is descending

Key levels to the upside:          Key levels to the downside:

1: $161.5                               1: $142.1

2: $181.3                               2: $128.42

3: $186.3                               3: $114.75

Categories
Crypto Videos

Bitcoin Price Dump Shakes Investors!

Bitcoin price dump! was the writing on the wall?

Thank you for joining this Forex Academy educational video.

In this session, we will be looking at the recent bitcoin US dollar price dump and what might have been the possible contributing factors.

In this daily chart of bitcoin to the US dollar, we can see a steady bull run, as highlighted in section A, with a critical area of support on the $10 k line, which lends itself nicely for a price action move up to the resistance line, which was breached in section B, which coincides with the all-time high of around $19.5K from 2017, and where eventually price reaches the key $20K figure, and from there on over the Christmas period and into the new year, we see exponential growth, where bitcoin skyrockets to $42k.
With market analysts and investors talking up the value of bitcoin from anywhere in the region of $30 to 40K and even 140k, it’s hardly surprising that euphoria crept in and where everybody was buying, especially in the CFDs market.
This was a gold rush in all but name. And one has to ask oneself a question; when assets are being talked up by investors, or even talked down, what are the real motives behind this? Are they simply looking for a market reaction in favour of their own investment strategy, for example? This is a question for another day.
Getting back to the issue, was the writing on the wall all for a price collapse? Yes, it was, and for a number of reasons:
Firstly, when a market is moving steadily as in a trend, it is less likely to see extreme volatility unless there are fundamental reasons behind it. And because bitcoin is essentially a speculative instrument, fundamentals can be set aside in favour of a trending market.

The problem with this, as highlighted here, is that this is unchartered territory. We are looking at a $20,000 price increase in just a few days, which is almost unheard of. Technical analysis becomes difficult to gauge, and professional traders don’t know where to get in on the trend or place stops. Many are forced into buying for fear of missing out, and this is extremely dangerous.

Certainly, the writing was on the wall when on the 4th of January, we see a $6K price range move on this bearish daily candlestick. However, volatility continued with the bulls regaining control taking bitcoin to a record high of around $42,000.
Professional traders will know from history that a correction was on the cards, and with the UK FCA warning retail traders about the potential of losing all of their money trading bitcoin assets, it very likely contributed to price action hitting a brick wall all and to the collapsed….

Of around $12K in 24 hours. Many investors and retail traders were still buying well above $40,000, while the price was tanking, causing billions of dollars to be wiped off of the price, and where billions were lost in margin calls, with accounts being liquidated, because of the massive move lower.
Bitcoin should have a health warning on it, buyer beware, and with more and more weekend traders getting involved in this market, which operates 7 days a week, and where these part-time traders in there are spare rooms have a punt, with many losing their cash deposits, it is not a surprise that the FCA have banned retail traders from trading cryptocurrencies in the UK from the 6th of January this year, and where the EU are now calling for tighter regulation in this space.
Weekend bitcoin traders will be licking their wounds. But let’s not forget that a lot of people are still in the money and sitting back waiting to see if the price steadies itself and then continues to move higher, or if it will continue to slide.
Advice on this one would be too to look at trends on lower time frames…..

Such as this one-hour chart, while looking for support and resistance lines, and pick out trends that are set by big money investors, such as institutional traders, where they typically operate Monday to Friday. Be ultra-cautious when going long during aggressive rallies and around huge candlesticks, especially the bearish ones, as highlighted, which represents an overall move of $4000 dollars. They spell out danger. And set tight stop losses.

Categories
Crypto Daily Topic Crypto Videos

Pension Funds Are Investing In Bitcoin!


“Pension Funds are Investing in Bitcoin” – Grayscale


Grayscale’s newly-appointed CEO, Michael Sonnenshein, told Bloomberg that pension funds and endowments are actively investing in the Grayscale family of funds. Sonnenshein’s interview with Bloomberg came on Jan 7.

He further explained the statement: “We have started to see participation not just from the hedge funds, which we’ve seen participation from for a long time now, but now it’s recently coming from other institutions, pensions, and endowments. The sizes of allocations that they are making are also growing rapidly.”

Grayscale has been at the forefront of the recent Bitcoin buying spree, and its holdings now account for roughly 3% of the circulating Bitcoin. The fund manager continues to increase its position by buying even more cryptocurrencies as more institutional investors seek exposure to Bitcoin and other digital assets. 

Grayscale’s total assets under management, or AUM for short, have eclipsed $27 billion across ten different investment products. The Grayscale Bitcoin Trust remains its most popular product by far, with over $23 billion in AUM. Its Ethereum trust is the second most popular product, and it is currently valued at around $3.7 billion, while its Digital Large Cap Fund holds somewhere in the ballpark of $340 million.

Pension funds are starting to follow a hoard of institutional buyers that started to enter the Bitcoin and crypto market in 2020. A survey conducted by Fidelity Investments in late 2020 found that 36% of financial institutions across both the United States and Europe said they own cryptocurrencies or derivatives. Over 25% of the respondents reported holding Bitcoin, while 11% said they own Ether.

According to Grayscale Investments, the institutional interest for cryptocurrency and Bitcoin is intensifying at an alarming rate, with pension funds and endowments being the most recent entrants into the space.

The company’s aggressive Bitcoin buying is likely contributing to the digital currency’s rapid price increase. With more Bitcoin taken out of circulation and miners not being able to produce as much Bitcoin as it is requested, the already scarce asset is becoming even more difficult to get at current prices. Sonnenshein stated:

“This is a verifiable scarce asset, so when there are mechanisms that are removing Bitcoin from circulation, that’s inherently making it an even more scarce asset.”

Categories
Crypto Market Analysis

Daily Crypto Review, Jan 14 – Bitcoin Records Double-Digit Gains as it Passes $38K; Crypto Market in the Green

The crypto sector ended up almost completely in the green as Bitcoin recorded double-digit gains and pulled the rest of the market up. Bitcoin is currently trading for $38,222, representing an increase of 11.05% compared to yesterday’s value. Meanwhile, Ethereum’s price has increased by 9.00% on the day, while LTC gained 6.48% of its value.

Daily Crypto Sector Heat Map

Simbcoin gained 366.72% in the past 24 hours, making it the most prominent daily crypto gainer by far. It is followed by Penta’s 229.88% and DEX’s 187.13% gain. On the other hand, Daiquilibrium lost 88.91%, making it the most prominent daily loser. It is followed by Dynamic Supply Tracker’s loss of 80.15% and Dynamic Supply’s loss of 63.83%.

Top 10 24-hour Performers (Click to enlarge)

Bottom 10 24-hour Performers (Click to enlarge)

Bitcoin’s market dominance has moved up slightly since our last report, with its value currently being 69%. This value represents a 0.4% difference to the upside when compared to the previously reported value.

Daily Crypto Market Cap Chart

The cryptocurrency sector’s market capitalization has made significant gains since we last reported, with its current value being $1.032 trillion. This represents an $88.3 billion increase when compared to our previous report.

_______________________________________________________________________

What happened in the past 24 hours?

_______________________________________________________________________

_______________________________________________________________________

Technical analysis

_______________________________________________________________________

Bitcoin

Bitcoin had started changing its price direction on Jan 13, when it started to slowly push towards the upside. The largest cryptocurrency by market cap managed to pass the $36,640 level and reach as high as $38,789 before pulling back slightly. This steady price increase was followed by average (or even slightly descending) volume.

The pullback BTC went into after hitting the recent high was quickly stopped by the 21-hour and 50-hour EMAs, changing the overall stance from an expected downturn to uncertainty.

BTC/USD 1-hour chart

Bitcoin’s technicals on the 4-hour, daily and monthly time-frame are overall bullish, with oscillators pointing to the sell-side. On the other hand, its weekly overview is completely bullish.

BTC/USD 1-day Technicals

Technical factors (1-hour Chart):

  • Price is above both its 50-period EMA and its 21-period EMA
  • Price is between its middle and top Bollinger band
  • RSI is neutral (62.38)
  • Volume is average

Key levels to the upside:          Key levels to the downside:

1: $40,000                             1: $36,640

2: $42,000                             2: $33,200

3: $43,600                             3: $30,640

Ethereum

Ethereum’s period of heavy correlation with Bitcoin has continued as its price slowly gained momentum towards the upside. Ether managed to push its price to the $1,183.85 level but couldn’t quite break it. This caused a minor pullback, which ended very quickly.

Ethereum’s 21-hour and 50-hour EMAs play a significant role in determining its price direction and should be considered by the traders at all times. On top of that, any ETH trader should pay attention to BTC’s movements, as those ultimately determine the price direction of most cryptocurrencies.

ETH/USD 1-hour Chart

Ethereum’s technicals on the daily and weekly time-frame are currently completely bullish, while its 4-hour and monthly overviews show some signs of neutrality.

ETH/USD 1-day Technicals

Technical Factors (1-hour Chart):

  • Price is above both its 50-period and its 21-period EMA
  • Price is near its top Bollinger band
  • RSI is neutral (64.19)
  • Volume is slightly below average

Key levels to the upside:          Key levels to the downside:

1: $1,183.85                          1: $1,060.5

2: $1,211                               2: $1,047.5

3: $1,226.5                            3: $992

Litecoin

While Litecoin did follow Bitcoin’s price direction, it did so with much less conviction and intensity. Its price managed to pass the $142.1 level to the upside and establish its price above it but failed to move into the upper half of the trading range bound by $142.1 to the downside and $161.5 to the upside.

Litecoin currently has a very nicely-built support zone, while its upside is quite open. If Bitcoin’s price remains the same, traders can expect LTC to try to push towards or even contest the $161.5 level.

LTC/USD 1-hour Chart

Litecoin’s technicals on the shorter time-frames (4-hour, daily, and weekly) show overall tilt to the buy-side with hints of neutrality. Its monthly time-frame, however, is completely bullish.

LTC/USD 1-day Technicals

Technical factors (1-hour Chart):

  • Its price is slightly above its 50-period EMA and its 21-period EMA
  • Price slightly above its middle Bollinger band
  • RSI is neutral (57.08)
  • Volume is descending

Key levels to the upside:          Key levels to the downside:

1: $161.5                               1: $142.1

2: $181.3                               2: $128.42

3: $186.3                               3: $114.75

Categories
Forex Daily Topic Forex System Design

Trading System design – Basic Concepts

In previous articles, we explained the importance of a plan to succeed in Forex and described its general features. In this article, we will describe the concepts that need to be considered when designing a trading system.

A trading strategy is what most traders call a trading system, but it is not. A trading strategy is just a set of loose rules discretionary traders use to trade. A trading system is a set of closed rules used to systematically trade the market, usually through a computer EA, although a disciplined trader could also use it.

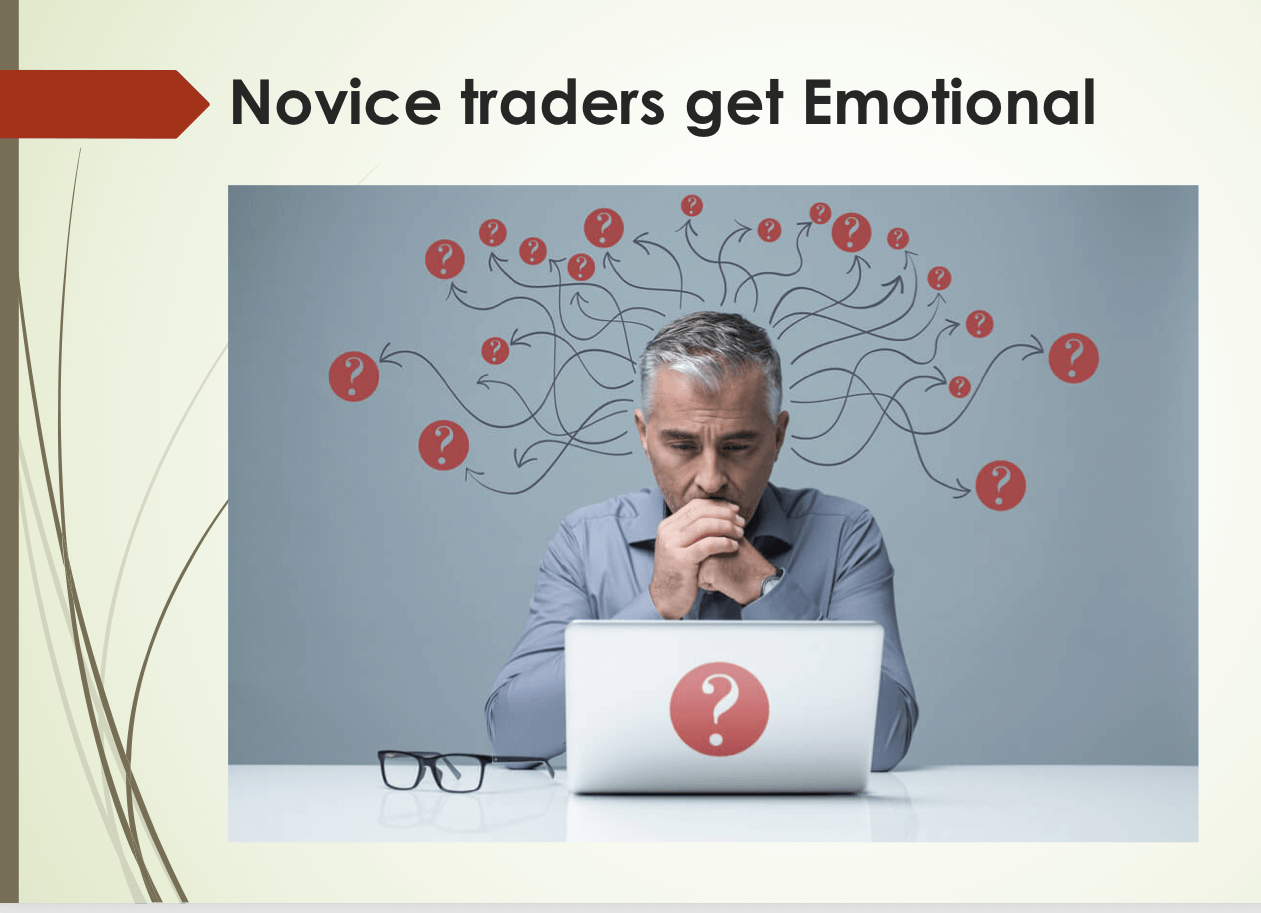
Traders, especially novice traders, get emotional and lose money because their emotions interfere and stop making rational decisions in the battle’s heat. Thus, the first thing to avoid is discretionary trading. Please read the article Know the Two Systems Operating inside Your Head. That’s why what we aim to create is a trading system that should be systematically traded.

Price imbalances

There are plenty of criteria to find these imbalances. There are two visual clues we can think of. The first one is a rubber band. The rubber band idea describes the price as if it was a rubber band or spring. When it moves far away from equilibrium, we expect the force to pull it to its center to increase and eventually drive it back to equilibrium.

The second visual clue is looking at the price moving in waves. Since there are numerous traders, their goals set in different timeframes, we can expect waves of different periods and amplitudes. A trend form when the combination of di
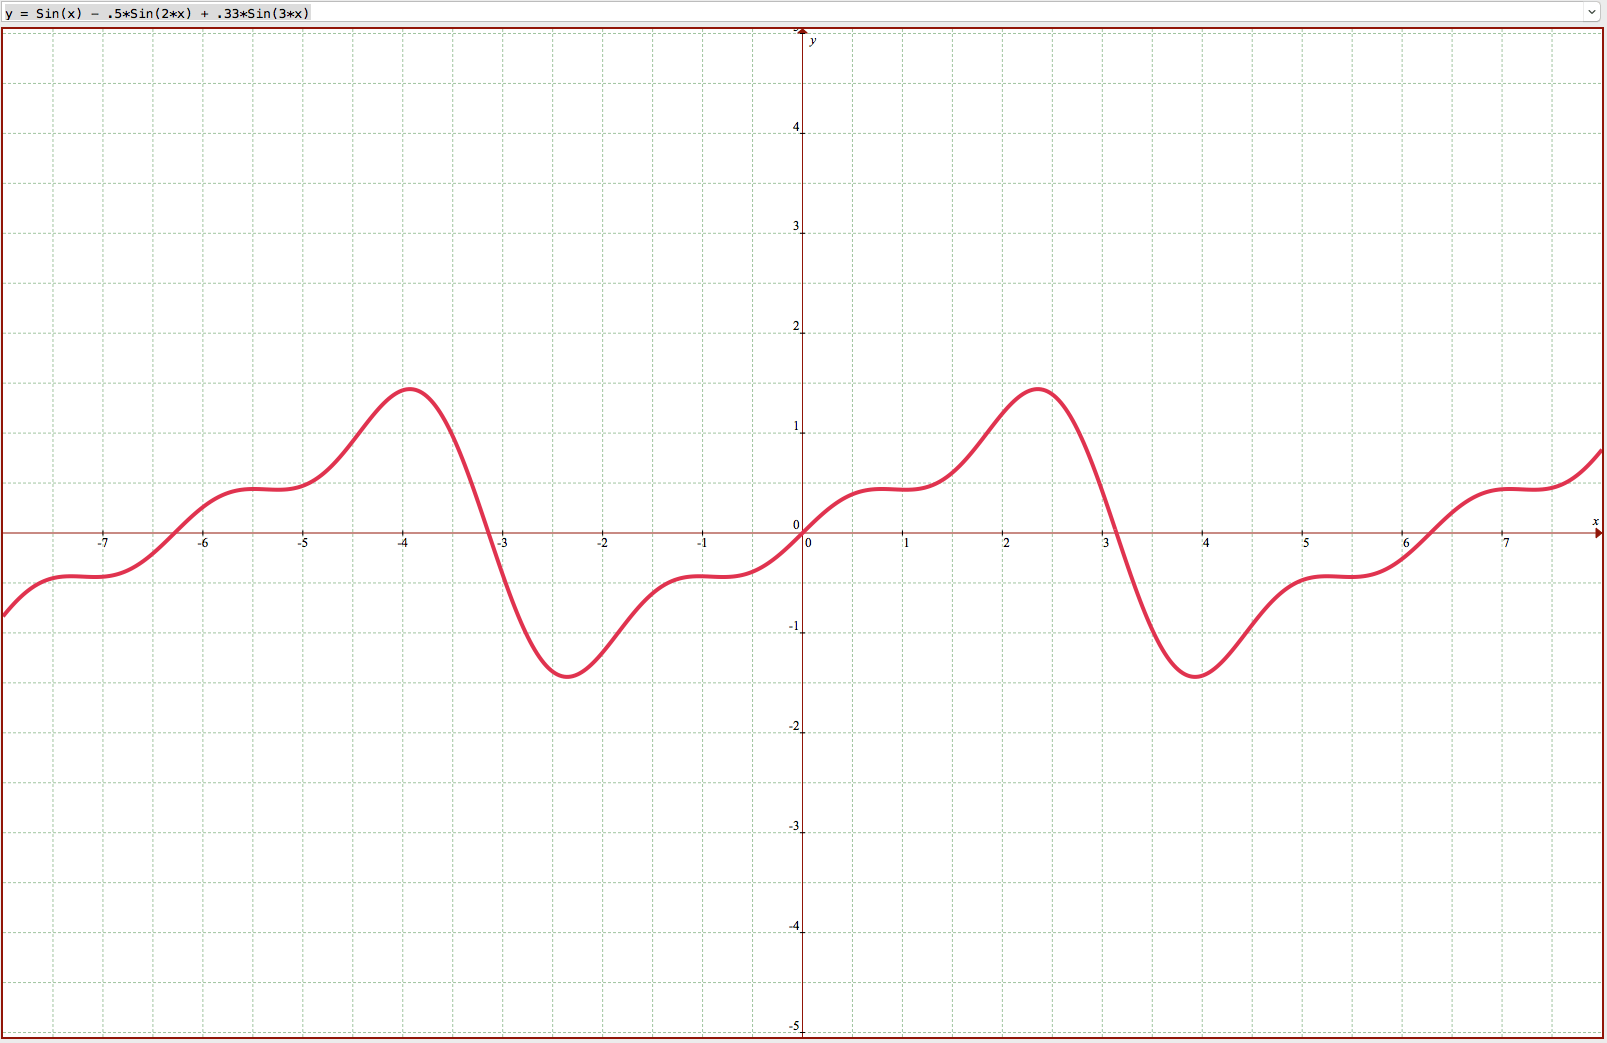
fferent waves are in sync, and chaotic moves occur when waves desync.

The main idea of a trading system is to find imbalances in the price and profit from it. Essentially, it takes the form of “buy low and sell high,” “sell high to buy back low,” or its variants “buy high sell higher,” “sell low, sell lower.”

The Effect of timeframes and a portfolio in the trading results

In their book Active portfolio management, Grinold and Kahn described the fundamental law of active management. The formula has two variables: The manager’s skill (IC) and the number of investments performed (N).

We could think of IR ( Information Coefficient) as a quality index of the results.

If we analyze the equation, we see that IC measures a trader’s ability to produce profits, since if N is constant, IR grows if IC grows.

But, if we keep the IC constant, we see that IR grows with the number of trades (N).

This explains that a portfolio of assets will be more profitable than only one asset. It also explains why shorter trading timeframes would produce higher results. Of course, with very short timeframes, the trading costs would eat a growing portion of the profits, so there is a limit to how short we could go.

Diversification

Diversification is a key concept to reduce the overall risk in trading. The idea is simple. Let’s say we have a long position the EURUSD with an overall dollar risk of 10 pips. If the dollar moves up and drives the pair southwards, we lose $100 on every lot. If we have an equivalent long position on the USDJPY, we will cover the risk on the EURUSD with the gains on the USDJPY, driving it to zero or, even, being positive overall.

If the assets are uncorrelated and the risk on each trade is similar on all trades, the overall basket’s risk will less than 50% of the sum of all open trades risk.

The profitability rule

Two parameters define the profitability of a system: the percent winners and the reward risk ratio.

The formula that tells the minimum percent winners (P) required with a determined reward/risk ratio (Rwr) for the system to be profitable is:

P > 1 / (1+Rwr) 

Conversely, below is the formula of the minimum reward/risk ratio needed with a determined percent winners figure on a profitable system:

Rwr > (1-P)/P

If you play with the second formula, you will see that at reward/risk ratios below one, the system should grant winners higher than 50 percent. Furthermore, Systems with high reward risk ratios would need less than 50% winners to be profitable.

The conclusion is we must look for systems with high reward/risk ratios to protect us from periods of low winner’s percent.

Assessing the quality of a trading system

There are several methods to measure the quality of a trading system. We propose the use of Van Tharp’s SQN, which is a variation of the chi-square test, a well-known method to evaluate the goodness of a sample against a random distribution. The SQN test is a Chi-square test that is capped to 100 samples so that the length of the sample does not modify its value.

  SQN = 10 x E / STD(E)

Where E is the expected profit on each trade, which is the sum of all profits divided by the number of trades, and the denominator is the standard deviation of E.

But if the sample is less than 100 instead of 10, the multiplier is the square root of N, the number of trades.

SQN = √N x E / STD(E)

Systems below 1 are bad. systems of 1.5 to 2 average, and from 2 to 3 good and over 3 excellent.

Elements of a Trading System

We can decompose a trading system into its several elements, although not all of them need to be present.  We have already discussed this, but let’s describe its basic elements.

A Setup: The setup is a market state where we think there is an imbalance in the price, or a condition we expect can be resolved with a price move, for example, the price reaching a top or a bottom of a channel.

A permissioning filter: This forbids trading under specific market conditions: Low volume, extreme volatility, particular hours or days.

Entries: This the stage that times the market. It can be a breakout, a candlestick pattern, or an indicator signal.

Stop-loss: This defined an invalidation level, under which the trade is likely no longer profitable. This level will limit our losses and save our capital for further trades.

Take-profit: It defines our planned profit. It may be set using support/resistance levels or any other sign the current trade movement is over, such as a reversal signal or the crossover of averages.

Re-entry rule: You may also consider this rule in your findings. For instance, a market failing to do something, for example, continue moving up, may signify it will move down. Thus, you could stop and reverse instead of close the position. Also, if you got out of a position, you could consider re-entry if the market flags a continuation of the previous movement. That way, you could tight your stops keeping most of your profits and reenter instead of loose stops, which may eat a large portion of your hard-earned profits if the market does not recover.

Categories
Crypto Videos

Crypto User Recovers Lost Private Keys to Over $4M in Bitcoin! $$$


Crypto User Recovers Lost Private Keys to Over $4M in Bitcoin

A student has claimed to have found their long-lost private keys that accidentally HODLed Bitcoin starting as early as 2011. By finding the keys, he will be able to unlock more than $4 million in Bitcoin.

According to a Reddit throwaway account from BitcoinHolderThankU, they were able to cash out roughly $4.2 million in Bitcoin after finding the lost keys to 127 BTC on Dec 22, 2020. At that time, the price of the crypto asset was in the $23,000s. The user stated that they later liquidated the coins somewhere in the bull run.

“I spent the next week just trying to figure out how to safely and securely liquidate such a large Bitcoin position for the lowest price possible,” stated the Redditor. “I went back and forth between different OTC principal desks and ultimately ended up selling every single one of my 127 Bitcoin for a price of $33,439.02 per coin. The net was roughly $4.24 million.”

They claim to have earned the aforementioned Bitcoin in 2011 or 2012 through various “surveys, watching videos, as well as completing random tasks” to ultimately use the Bitcoin for purchasing in-game currency for the online game DarkOrbit. The lost private keys were reportedly never really missing, but rather forgotten on an older model Dell computer.

Unfortunately, if the Redditor’s story is true, they missed out on $1 million in additional profit by not just holding for a few more weeks. Since December 2020, the price of Bitcoin has experienced a lot of volatility and even hit $42,000 to reach new all-time highs. BitcoinHolderThankU stated that they “would not have sold all 127 Bitcoin” if the same situation presented again.

“To give myself credit, I did hold it for 8-9 years, which is more than the vast majority of cryptocurrency users,” they said. “I definitely would’ve done things a bit differently if I were given a second chance.”

Despite their sudden fortune, they said that they would avoid “expensive luxuries,” as well as that they intend to put the bulk of the funds into the S&P 500 index, adding:

“I don’t want to end up like one of those people who happen to win the lottery and then blow it all in a matter of months or years. I’m going to continue living my life the same way I was living it on Dec 21 and every day before that.”

Categories
Crypto Videos

Morgan Stanley Bought 10% Stake in Michael Saylor’s MicroStrategy!


Morgan Stanley Bought 10% Stake in Michael Saylor’s MicroStrategy

MicroStrategy has been in the crypto news for months now – this time regarding a major player joining in on their venture to become a major Bitcoin HODLer. Per a filing with the US Securities and Exchange Commission released on Jan 8, an investment bank mogul Morgan Stanley had acquired 792,627 shares in the business intelligence firm MicroStrategy. This massive investment represents a 10.9% stake in the company that has recently made astonishing investments in Bitcoin. 

While the purchase itself mostly likely happened on Dec 31, the news was released to the public nine days after that. The Morgan Stanley investment into MicroStrategy came after Michael Saylor’s company performing incredibly and its shares moving from $289 on Dec 8 to a whopping $545 as of Jan 8.

In August 2020, MicroStrategy took some very bold steps by investing crypto, making Bitcoin its primary reserve asset. At the time of investing, CEO Michael Saylor talked about why his company decided to invest so much into Bitcoin:

“This is not a speculation, nor just a hedge. It is a deliberate strategy to adopt the Bitcoin Standard.”

Just a couple of weeks ago, MicroStrategy announced a whopping $400 million securities offering, stating that the purpose of raising funds is to buy even more Bitcoin. As of Dec 21, 2020, the firm had managed to stockpile 70,470 Bitcoin. 

At current prices, MicroStrategy’s Bitcoin holdings came up to a worth of over $2.8 billion. 


Institutional investors such as Morgan Stanley have warmed up to cryptocurrencies considerably over the past year. Many analysts have attributed Bitcoin’s recent bull market to this institutional uptick, compared to the FOMO coming almost strictly from the retail market that was so critical to Bitcoin’s 2017 highs, which subsequently fell apart. 


Categories
Crypto Market Analysis

Daily Crypto Review, Jan 13 – Polkadot Outperforms the Market as it Heads Towards $10; Crypto Sector in the Red

The crypto sector ended up mostly trading in the red as cryptocurrencies such as Ether, Litcoin, and Bitcoin Cash dropped over 5% on the day. Polkadot was one of the few cryptocurrencies that managed to score double-digit gains and outperform the market by a large margin. However, this is purely due to fundamental reasons (immense support coming from the Binance exchange) rather than technicals.

Bitcoin is currently trading for $34,223, representing a decrease of 3.03% compared to yesterday’s value. Meanwhile, Ethereum’s price has decreased by 4.09% on the day, while LTC lost 3.07% of its value.

Daily Crypto Sector Heat Map

Metacoin gained 103.61% in the past 24 hours, making it the most prominent daily crypto gainer by far. It is followed by OVR’s 98.72% and Latamcash’s 92.88% gain. On the other hand, Amun Bitcoin 3x Daily Short lost 75.44%, making it the most prominent daily loser. It is followed by Zugacoin’s loss of 73.82% and KIMCHI.finance’s loss of 66.82%.

Top 10 24-hour Performers (Click to enlarge)

Bottom 10 24-hour Performers (Click to enlarge)

Bitcoin’s market dominance has moved down very slightly since our last report, with its value currently being 68.6%. This value represents a 0.1% difference to the downside than the value it had when we last reported.

Daily Crypto Market Cap Chart

The cryptocurrency sector’s capitalization has decreased since we last reported, with its current value being $948.23 trillion. This represents a $17.92 billion decrease when compared to our previous report.

_______________________________________________________________________

What happened in the past 24 hours?

_______________________________________________________________________

_______________________________________________________________________

Technical analysis

_______________________________________________________________________

Bitcoin

Bitcoin spent the day hovering between the $33,320 support level and the $36,640 resistance level, with its price mostly being in the bottom part of the range. The price even breached the support level and went past it on several occasions, but it always returned back up. While it currently seems stable and on decreasing volume, Bitcoin might experience a stronger pullback and an attempt to retest $30,000 once again.

BTC/USD 1-hour chart

Bitcoin’s technicals on the daily and monthly time-frame bullish, but contain some neutrality alongside the bullishness. However, its weekly overview is completely bullish, while its 4-hour chart is completely bearish.

BTC/USD 1-day Technicals

Technical factors (1-hour Chart):

  • Price is between its 50-period EMA and its 21-period EMA
  • Price is near its middle Bollinger band
  • RSI is neutral (50.24)
  • Volume is descending

Key levels to the upside:          Key levels to the downside:

1: $36,640                             1: $33,200

2: $40,000                             2: $30,640

3: $42,000                             3: $27,960

Ethereum

Ethereum has traded almost exactly like Bitcoin in the past 24 hours, both in terms of price direction and intensity. The second-largest cryptocurrency by market cap is currently in an extremely narrow and unsustainable range, bound by the Fib retracement level of $1,060 to the upside and a 2017 Fib retracement sitting at $1,047.

Ethereum’s 21-hour and 50-hour moving averages play a significant role in determining price direction and should be considered by the traders at all times.

ETH/USD 1-hour Chart

Ethereum’s technicals on the daily and monthly time-frame bullish, but contain some neutrality alongside the bullishness. However, its weekly overview is completely bullish, while its 4-hour chart is completely bearish.

ETH/USD 1-day Technicals

Technical Factors (1-hour Chart):

  • Price is between its 50-period and its 21-period EMA
  • Price is at its middle Bollinger band
  • RSI is neutral (48.60)
  • Volume is descending

Key levels to the upside:          Key levels to the downside:

1: $1,129                               1: $1,060.5

2: $1,211                               2: $1,047.5

3: $1,226.5                             3: $992

Litecoin

Litecoin has been pretty stable in the past 24 hours, with its price trading within a range bound by $128.4 to the downside and $142.1 to the upside. These support/resistance levels, alongside the 21-hour and 50-hour EMAs, will determine Litecoin’s future price intensity, while Bitcoin’s next move will most likely determine its price direction.

LTC/USD 1-hour Chart

Litecoin’s technicals on the daily and monthly time-frame are completely bullish. However, its weekly overview shows slightly less bullishness, while its 4-hour chart is almost completely bearish.

LTC/USD 1-day Technicals

Technical factors (1-hour Chart):

  • Its price is between its 50-period EMA and its 21-period EMA
  • Price slightly below its middle Bollinger band
  • RSI is neutral (51.37)
  • Volume is descending

Key levels to the upside:          Key levels to the downside:

1: $142.1                               1: $128.42

2: $161.5                               2: $114.75

3: $181.3                               3: $98

Categories
Forex Daily Topic Forex System Design

Building a Trading System: Elements of a Trading Plan

Now that we know the importance of having a plan, let’s discuss the necessary components of a trading plan.

A trading plan should consist of at least these elements:

  1. A basket of instruments
  2. A trading system consisting of timeframes, permissioning filter, entry rules, trade management: stop-loss, take profits.
  3. A position sizing methodology
  4. A trading record
  5. Trade-forensics analysis.

In this article, we will provide an overview of these elements.

A basket of Instruments

Every asset has its characteristics, and its market movement differs from others on volatility, liquidity, and ranges. Therefore, professional traders track a limited basket of instruments to trade. A few, even, specialize and trade just one instrument.


The best criteria to decide which are best are:

  • Liquidity: It means how much trading volume it moves. Illiquid assets are easy to manipulate, spreads (the difference between the bid and ask prices) are wider, and the trading rules fail more often.
  • Price Action: The instrument should have enough swings in the trading timeframe to merit trading it. Instruments that do not move or move too erratically are prone to failed trades. A security that trends are the best.
  • Familiarity: As said, your trading results improve if you’re familiar with how an asset moves, its usual support and resistance levels, the typical length of swings, and so on.
  • Economic Data: Economic news releases affect the security and trading signals fail at the time of the release. Therefore, it is advisable not to trade it in the vicinity of a news release.

The Trading System

As said in our previous video, financial markets are unbounded territories where each trader needs to set his own rules; otherwise, they will be influenced by his emotions and fail. A trading system is their set of rules that enable them a long-term success.


Timeframes

The chosen timeframe should match the availability to trade. A trader with a day job would need to select a daily or a 12-hour timeframe, whereas a full-time trader could use shorter frames, such as 15-min, one, two, or four-hour timeframes.

Similarly to asset selection, the trader must familiarize himself with how his assets move in these timeframes and evaluate the liquidity and range at different times and weekdays to choose the best periods to trade.

Permisioning filter

A permisioning filter is a way to avoid trading under determined circumstances. It can be a filter that allows only trading in the direction of the primary trend or an overbought/oversold sign that should be on for a determined candlestick or pattern formation to be valid.

The key idea of the permisioning filter is to screen the trades and pick the ones with the best odds of success.

Entry rules

Entry rules can be technical or fundamental rules to time the market, although we will focus on technical rules.


There are two philosophies regarding entries.

  • Enter on the trend’s weakness

This methodology aims to profit from pullbacks of a primary trend to optimize the price entry. Different indicators and patterns may help time the entry: MA crossovers, Oscillators, or reversal candlestick patterns such as the engulfing pattern or morning star and evening star.

  • Enter on the trend’s strength.

Enter on strength aims to profit from an increasing momentum of the price. We acknowledge the trend’s strength is increasing and recognize the trend will continue for a while. Technical indicators such as the Momentum, RSI, and MACD may help time the entry. Price action patterns, such as range breakouts, are quite useful too.

Trade Management

Trade management is a vital element of any trading system. It is responsible for getting out of unprofitable positions, trails the stops to break-even, and above to optimize profits or close the trade when the target is hit or when a technical signal warns of a trend reversal.

Many top traders value more trade management than entries. The money is won on exits, they say.

Money management should be consistent with the concept of cutting losses short and letting profits run. A sound trading system should present an average reward/risk ratio at least over 1.5, and ideally above 2.

Position sizing

Position sizing is the part of your plan that tells you how much risk you should take on a trade. We have had a complete video section on this subject, which we encourage you to study. To summarize it here, position sizing is the tool to help you reach the trading objectives and put drawdown under the levels that fit you. Finally, proper position sizing enables you to minimize the risk of ruin while optimizing your trading account’s growth.

The trading record / Trade-forensics

The path to improvement is an analysis of past results. Nobody is perfect, and, also, markets aren’t immutable but changing. A trading record is necessary to evaluate your system’s performance, detect and correct weaknesses, such as stops or target placements, errors in timing – too late or too early on a trade, and evaluate how permisioning filters work. Finally, the trading record will help traders know their system’s key parameters: the average profit and its standard deviation, percent winners, and average reward/risk.

Key Elements of the trading record:

The main data you should record on the spreadsheet record are:

  • Entry date/time
  • entry price
  • trade size
  • entry level
  • stop-loss level
  •  $risk of the trade
  • planned take-profit level
  • Exit price
  • Exit date/ time

Other desirable parameters that would help optimize stops and take-profit targets are:

maximum adverse price of the trade if there were no stops.

maximum favorable price of the trade if not considering the take-profit

The first one would help you find better places for the stops, and the second one will show you the best place for the take-profit placement.

Main Parameters:

With the suggested trading record entries, you will be able to measure the key parameters of your system:

Average profit: Total profits/ number of trades

Standard deviation of profits: Use Excel’s Standard Deviation formula

Percent winners: Nr of Winners/ total trades x 100.

Average Reward/ risk:  Sum of Profits / sum of $risk

You may find an example of a trading record in this forex.academy article. Furthermore, since we consider it an essential element to your trading success, we offer you to download our freely available trading log. You are free to adapt it to your taste and needs.

Forensics

After the closure of a trade, you should analyze its quality, regarding execution and goals. A losing trade does not have to be of low quality if executed according to your system’s rules. But it is necessary to determine if you’re acting according to the rules and assess how much of the available profit did you take.

Points to consider

  • Percent of the available profit ( if any)
  • percent of the loss you’ve taken ( if any)
  • Timing: has it been right, too early, or too late?
  • Exit timing: right, too early, or too late?
  • Stop-loss: Can stop-loss settings be improved?
  • Take profit: Can they be improved?
  • Average Reward/risk: is it according to your settings?

Also, after  a determined number of trades/weeks, you should assess:

  • Is the system improving or worsening over time?
  • Losing streaks: are normal for the system you’re using or due to bad stop-loss settings?
  • How many trades could be on profit if you’ve loosened your stops?
  • How much profit could you pocket if your take-profit levels were moved here/there, based on the maximum favorable price data?


This ends our overview of the main elements of the trading plan.

Categories
Cryptocurrencies

The Major Risks of Investing in DeFi and How to Mitigate Them

For a crypto enthusiast, there could never be a better time to be alive. First, there’s their growing acceptance as a store of value. Additionally, developers keep churning out exciting products promising to revolutionize our financial lives. One such product is Defi, and 2020 has seen its popularity grow in leaps and bounds.

To the Defi proponents, it is the magic pill that will cure the shortfalls of conventional finance. Often Defi Investments are portrayed as a sure way to wealth. Though, a keen look at the sector reveals the presence of pitfalls amidst the opportunities always touted. Making headway in this space, therefore, demands prudence.

What then are the risks accompanying Defi Investments? What are the ways of mitigating them? Stay with me as we unearth the risks to expect when you invest in the sector and the measures to protect your investments from them.                

Which are the Major Risks in Defi Investments?

We can categorize the risks in the Defi sector into three, namely, technical risk, financial risks, and procedural risks. We shall now embark on explaining each of these briefly.

Technical Risks

Technical risks arise from malfunctions in the protocols, hardware, and software of a Defi platform. They are critical since they compromise the platform’s functions. They include:

Smart Contract Risks

Smart contracts are the lifeline of Defi. They are central to the execution of most functions. Therefore any error in their operation will impact the Defi they run on and imperil users’ funds.

Smart contracts are human-made and, therefore, prone to bugs and other vulnerabilities. Unscrupulous individuals will exploit these to gain unauthorized control over the protocol’s functions. Recently, there have been reports of incidences of smart contract exploits that led to the loss of funds.

Hardware risks 

Hardware is the foundation on which Defi services run. Compromised hardware impacts the proper functioning of a Defi platform. Common hardware risks affecting DeFi systems include:

  • The power issues may cause unreliability of the service or application, diminished service life and performance.
  • Sensitivity risks result from degradation, humidity, dust, or other similar issues.
  •  Incompatibility risks can limit the speed of the system and other issues.

Software Risks

The entire Defi ecosystem runs on software. A corrupted software impedes the proper functioning of the Defi platform. These risks present in different ways:

  • Distributed Denial of Service (DDoS) attacks disrupt the normal functioning of an app or service.
  • Injection risks introduce malicious code into the DeFi software, for instance, SQL injection into web apps.
  • Uncontrolled format strings execute malicious code in a web app.
  • Overflow risks cause the software to skip certain functions or implement them in error.

Financial Risks Related to DeFi

Most information on Defi only speaks of the profit-making part. Whereas it is true that with wise investments, one can make a ton, there’s also the possibility of incurring losses. Financial risks are those that put you in danger of losing your funds. These include:

Impermanent loss

Impermanent loss occurs when you fund a liquidity pool, and the price of your deposited assets falls compared to when you deposited them. In an ironic twist, you discover that you’d have been better off hodling them.

Currency Fluctuations

The whole crypto space is very volatile. Cryptocurrencies experience upturns and downturns spectacularly. If you invest funds in a particular crypto asset, then its price falls, you experience a loss. The same obtains for staked assets. Should the supporting asset decline in value, it will take the supported down with it.  

Scams

The Defi Sector is crawling with persons and entities of dubious intentions. These fashion different kinds of scams to the detriment of unsuspecting investors. Some of the means they employ include:

Exit Scams

Unscrupulous promoters dupe investors by setting up a project with a seemingly attractive concept. They collect funds through an ICO and melt away with the loot. A case in point is YFDEX. Finance’s heist.

Pump and Dump Schemes

Whales create an artificial demand for a coin/token, thereby drawing in investors. Later they withdraw their funds at a profit. Consequently, the market plummets, leaving the rest counting losses.

Fake Airdrops and Rewards

Scammers create fake Airdrops and giveaways to access private keys and personal info. They then use these to defraud you of your funds.

Defi Rug Pulls

Defi rug-pulls scams involve minting new tokens, marketing, and listing them on Uniswap. The masterminds inject liquidity, convincing trusting investors to swap their ETH for the token. After that, the cons withdraw the funds leaving holders high and dry.

Procedural Risks in DeFi

These are the risks arising from one’s usage of the Defi platforms and attendant infrastructure. They include:

Phishing Attacks 

Here a malicious player duplicates a website or service, duping the unsuspecting into sharing sensitive information. Alternatively, they could send emails that install malicious code on their devices. Then they use the victim’s sensitive information siphoning their funds.

Pretexting 

A hacker poses as a representative of a DeFi service and convinces users to share sensitive information.

Exposure of Login Credentials

At times a user may knowingly or unknowingly expose their login details. Anyone with ill motives will use these to access their accounts.

Loss Of Login Details

Users may forget their login credentials. They, therefore, cannot access their accounts, leading to a loss of investments.

How Do You Mitigate Risks Associated With Defi Investments?

The Defi space can be unforgiving to anyone who navigates it without caution. One needs to guard their investments jealously. Here’re a few pointers on how to protect yourself from the risks outlined above:

Deal with Authentic Products and Services Only

Use products and services whose authenticity you’re sure about. Before settling on a product/service, DYOR! Look at reviews and recommendations about them. From there, you’ll get a good feel of what you’re getting into. Negative reviews are your cue to take off.

Use Multi-Factor Authentication

Secure your logins with several verification instruments. Examples include email confirmations, two-factor authentication, and multi-sig authentication.

Keep it Private

Treat your Defi investments like any other sensitive and personal information: private! Doing so helps ward off hackers’ attention.

Secure Your Digital Assets

The security of your investment is a wallet away. Hot wallets are ideal for actively accessing DeFi services. Cold wallets, on the other hand, are suitable for offline storage. Invest in a dependable wallet

Make Updates and Backups Your Friends

You must keep a backup of your sensitive information, including login credentials. Besides improving user experiences, upgrades, and patches of Defi solutions resolve vulnerabilities.

Takeaways

Don’t be fooled! Defi is not always about sunshine and rainbows. Behind the much-publicized good lurks danger. The Defi space is full of risks that can wipe out our investments if we don’t exercise caution. These risks present themselves in three broad categories: that is technical, financial, and procedural. Each of these broad categories has its specific shape of risks as has been elucidated. That said, any investor should take comfort that there are mitigation measures that they can take to protect themselves. Their judicious utilization will shield them from funds loss.

Categories
Crypto Videos

Biden’s $3T Stimulus Bill Could Make Bitcoin Explode!


Biden’s $3T Stimulus Could Create Another Bitcoin Skyrocket Scenario


The incoming Biden administration’s plan to print almost an infinite amount of money into the US economy and supply it with trillions of dollars could likely ignite the next leg of the Bitcoin bull market, as more investors seek refuge from the United States dollar.
Aan Arlington-based news outlet Axios reported that Joe Biden had asked Congress to provide Americans with a stimulus check of $2,000 to help offset the economic devastation caused by Covid-19. The incoming president has also proposed a tax and infrastructure package as part of his “Build Back Better” program. The package would be worth $3 trillion.

Biden also doubled down on his call for more direct relief to American citizens after Jan 8 disappointing jobs report showing a loss of over 140,000 positions in the last month of 2020.
He stated: “Economic research confirms that, with the current conditions such as the crisis today, especially with such low-interest rates, taking action immediately– even with deficit financing – is certainly going to help the economy overall.”
If 2020 is anything to go by, the new wave of stimulus could be another catalyst for Bitcoin’s rise as more money floods the market and makes prices into assets.

Even the current president Donald Trump, a Republican, has played a role in vast government outlays. Under his leadership, the US passed a historic $2 trillion stimulus package bill in March. Trump also signed a relief package worth $900 billion in December. This document would then pave the way for $600 stimulus checks coming to every American citizen.
The federal government’s inflation-increasing policies have coincided with interventionism coming from the Federal Reserve, which deployed trillions of dollars in 2020 to combat a liquidity crisis and keep overnight rates somewhat under control.

Although the aforementioned policies provided a strong backstop for risk-on assets – a category that has previously included Bitcoin – the emerging narrative surrounding Bitcoin is that it’s a hedge against inflation.
Institutions are currently buying Bitcoin with a clear purpose and are hoping to one day become the industry’s whales.


Bitcoin’s digital gold narrative has recently been one of the biggest catalysts for Bitcoin’s price increase, as well as the institutional shift towards it. This narrative helped fuel BTC’s 300% rally in the previous year, as well as it more than doubling in price in this year alone. This trend could increase in intensity in 2021 as the purchasing power of the US dollar continues to erode.
Even a giant such as JPMorgan Chase publicly acknowledged that Bitcoin is taking market share from gold.

Categories
Crypto Videos

Experts State Investors Are Dumping Gold For BITCOIN!


Experts State – Gold outflows “ALL Going into Bitcoin”

According to multiple experts in the crypto sector, one possible reason for Bitcoin’s incredible recent price rise is massive investor outflows coming from another popular hedge from inflation: gold. 

Spot gold dipped heavily over the past week, losing 4.62% of its value, bringing it to $1,857. The asset has previously been surging in unison with Bitcoin, which managed to increase its price by 40% from $28,000 lows.

In a Tweet that came out on Friday, Jan 8, Charlie Morris, founder and CIO at ByteTree Asset Management, stated that the pullback in gold might be attributable to investors moving from it and into Bitcoin:

Likewise, earlier that week, CNBC’s Mad Money host Jim Cramer stated that the massive outflows coming from gold ETFs are “all going to crypto.” If we track inflows and outflows from Grayscale’s Bitcoin investment trust and gold ETFs back this assertion, as Grayscale has eclipsed gold: 

The moves could possibly be a sign of Bitcoin’s status as a legitimate asset class is on the rise. Gold and Bitcoin have been linked for a long time as both are seen as a way to hedge against inflation and macroeconomic uncertainty. However, if the price movements in the previous period are any indication, Bitcoin may be winning the narrative race due to its unprecedented gains. 

In an interview with Bloomberg, chief revenue officer at Coinshares, Frank Spiteri, said that the narrative surrounding Bitcoin being an inflation hedge is quickly gaining legs “in the face of an environment with highly unconventional monetary policies.”

“It seems like we are in the middle of an awakening among institutions to Bitcoin as a fairly uncorrelated store of value,” he said.

The observations from experts come after a very unique flippening that happened a while ago: as of Friday, Jan 8, a single Bitcoin is worth more than a 20-ounce gold bar.

With that being said, for all the bearish price action and Bitcoin’s skyrocketing, certain high-profile gold bugs still refuse to budge on their positions. In a tweet coming from a longtime Bitcoin skeptic and gold investor Peter Schiff, he claimed that once investors “understand” the risk of inflation, they’ll return to bullion.

Categories
Crypto Market Analysis

Daily Crypto Review, Jan 12 – XLM Back in the top10 Cryptos by Market Cap; Crypto Sector in the Green

The crypto sector has experienced a rally that brought the market to its feed after yesterday’s dip. One of the best daily performers was Stellar Lumens (XLM), which shot up in the past week on great fundamentals (and once again today), gaining over 30% just a couple of hours, reentering the top10 cryptocurrencies by market cap.

Bitcoin is currently trading for $35,887, representing an increase of 1.28% compared to yesterday’s value. Meanwhile, Ethereum’s price has increased by 1.89% on the day, while LTC lost 1.85% of its value.

Daily Crypto Sector Heat Map

Amun Bitcoin 3x Daily Short gained 1186.87% in the past 24 hours, making it the most prominent daily crypto gainer by far. It is followed by PengolinCoin’s 366.58% and Firdaos’s 330.42% gain. On the other hand, Zugacoin lost 94.92%, making it the most prominent daily loser. It is followed by the True Segniorage Dollar’s loss of 85.08% and Zero Collateral Dai’s loss of 62.33%.

Top 10 24-hour Performers (Click to enlarge)

Bottom 10 24-hour Performers (Click to enlarge)

Bitcoin’s market dominance has moved up very slightly since our last report, with its value currently being 68.7%. This value represents a 0.1% difference to the upside than the value it had when we last reported.

Daily Crypto Market Cap Chart

The cryptocurrency sector’s capitalization has increased since we last reported, with its current value being $964.21 trillion. This represents a $58.14 billion increase when compared to our previous report.

_______________________________________________________________________

What happened in the past 24 hours?

_______________________________________________________________________

_______________________________________________________________________

Technical analysis

_______________________________________________________________________

Bitcoin

Bitcoin managed to stop its descending move and push up slightly after pulling back to the $30,000 mark. The largest cryptocurrency by market cap has (on decreasing volume) seen a price increase to just below the $36,640 level. Many speculate that, while the drop was considered very healthy overall, the institutions bought even more BTC, which brought its price up without affecting the volume as much.

However, BTC/USD doesn’t seem like it currently has the strength to pass the $36,640 level, which may cause another downturn.

BTC/USD 1-hour chart

Bitcoin’s technicals on the daily and weekly time-frame are completely bullish. However, its monthly overview shows slightly less bullishness, while its 4-hour chart is completely bearish.

BTC/USD 1-day Technicals

Technical factors (1-hour Chart):

  • Price is between its 50-period EMA and its 21-period EMA
  • Price is near its middle Bollinger band
  • RSI is neutral (54.63)
  • Volume is descending to average

Key levels to the upside:          Key levels to the downside:

1: $36,640                             1: $33,200

2: $40,000                             2: $30,640

3: $42,000                             3: $27,960

Ethereum

Ethereum has once again matched Bitcoin in direction after hitting the $907 support level, and changed its price direction by pushing to the upside. The second-largest cryptocurrency by market cap is back at its peak from yesterday and seems like it cannot pass $1,129 with conviction at the moment.

Ethereum’s 21-hour and 50-hour moving averages play a major role and should be taken into account when looking for support or resistance levels.

ETH/USD 1-hour Chart

Ethereum’s technicals on the daily and weekly time-frame are completely bullish. However, its monthly overview shows slightly less bullishness, while its 4-hour chart is completely bearish.

ETH/USD 1-day Technicals

Technical Factors (1-hour Chart):

  • Price is between its 50-period and its 21-period EMA
  • Price is between its middle and top Bollinger band
  • RSI is neutral (53.69)
  • Volume is descending to average

Key levels to the upside:          Key levels to the downside:

1: $1,129                               1: $1,060.5

2: $1,211                               2: $1,047.5

3: $1,226.5                             3: $992

Litecoin

Even though Litecoin did follow Bitcoin’s price direction, it did so with less intensity, causing it to ultimately be in the red for the day. Its price is now at a major crossroads, as it is fighting for the $142.1 level. This pivot point will decide whether the price will immediately push towards the upside or downside.

Litecoin has created a strong resistance level near the $150 mark, and traders should pay great attention to it when trading.


LTC/USD 1-hour Chart

Litecoin’s technicals on the daily and monthly time-frame are completely bullish. However, its weekly overview shows slightly less bullishness, while its 4-hour chart is completely bearish.

LTC/USD 1-day Technicals

Technical factors (1-hour Chart):

  • Its price is between its 50-period EMA and its 21-period EMA
  • Price between its middle and bottom Bollinger band
  • RSI is neutral (50.33)
  • Volume is descending to average levels

Key levels to the upside:          Key levels to the downside:

1: $161.5                               1: $142.1

2: $181.3                               2: $128.42

3: $186.3                               3: $114.75

Categories
Forex Daily Topic Forex System Design

Building a Trading System: Why do you need a trading plan?

The necessity of a trading system has been discussed many times. Still,  new traders don’t consider it important when, in fact, it is a crucial element.  Could you conceive building a bridge without a project, playing tennis, or chess, with no strategy?


The trading profession is alike. If you take this business seriously, you’ll need to have a plan. Else, you’ll be in the loser team, in which are 90 percent of traders.

Reasons for a trading plan

1.- The financial markets are not deterministic

A market is a strange place where you cannot predict an outcome. An engineer can design a bridge, knowing that he can predict the bridge’s strength and behavior under heavy loads with proper calculations.  In the financial markets, you don’t have the benefit of an analytical formula to success. All you can expect is a small edge. Not following your plan is comparable to random trading; thus, losing the edge.

2.- Not following a plan weakens you psychologically

When you buy a lottery ticket or play roulette, you’re entering a bounded game. You know the cost of your ticket, the reward associated with a successful bet, and you don’t need to make any other decision. All parameters of the play, including the exit time, are fixed.

The financial markets are different. Everything there is unrestricted. The trader decides when, how much, exit time, stops, and target levels.  With so many parameters, a trader needs to define his rules and stick to them. Otherwise, he will be shattered by his emotions and lose money.

3.- The need to measure

Traders need to record and analyze their trades for many reasons.  The first is the need to analyze their performance and see if it has improved or not. Also, if the system performs as expected or lags its past performance. The most important reason is that traders need to know the strategy’s main parameters: percentage of winners, reward/risk ratio, the average profit and its standard deviation.

A trading plan that fits you

New traders don’t know much about statistics, and trading is about odds and their properties. One of them is streaks. There are winning streaks and losing streaks. The point is, streaks are mathematically linked to the ods of the system.

Let’s think of a system as a loaded coin, in which the odds of a winner can be different from 50 percent. Let’s say the odds of a system is 60 percent instead.  That means there is a 60 percent chance the next trade is a winner, and, consequently, a 40 percent chance it is a loser.

But what are the odds of a loser after a previous losing trade (a two-losing streak)? For the second trade to be a loser, the first one should also be a loser.  So the odds of two consecutive losing trades in a row is 0.4 x 0.4 = 16%. The odds of three successive losers would be 0.4×0.4×0.4 =6.4%, and so on.

The general formula for the probability of a losing streak is

n-losing-Streak = prob_lossn

which is the probability of one loss to the power of n, the size of the losing streak.

What we have shown here is that streaks are inherent to trading. In fact, inherent to any event with uncertainty. Golf pros, football players, and spot teams are subject to streaks, which are entirely expected. Trading systems are no different.

So, what’s the problem?

There are a variety of trading systems. Some, such as the well-established Turtles Trading System, which is trend-following, have less than 38 percent winners, although with average reward/risk ratios over 5. Other systems show over 70 percent success but reward/risk ratios of less than 1.

The odds of a 10-losing streak on the Turtles system, assuming 38% winners or 62% losers, is about 0.84%. That means we can expect ten losers in a row every 120 trades.

On a 70% winner system, the odds for ten losers in a row are one every 200 thousand trades.

The rationale behind the turtle is to lose small and profit big. When a Turtle trader sees they are right, they add to their position, and on and on, following the trend.

People who use the later system are scalpers that jump for the small profit and get our fast before the movement fades.

Nobody is wrong. They trade what best fits their psychology. You need to know your limits, as well. Many wannabe traders move from system to system after only a five-losing streak, discarding a sound strategy when its first perfectly normal streak occurs. Also, most traders use sizes inconsistent with the expected streaks and lose their entire account.

By now, you should have learned the importance of having a plan that fits your psychology and trading tastes.

In the coming article, we will discuss the components of a trading strategy or system. Stay tuned!