
The crypto sector was mostly green, with altcoins attempting to push up and reduce Bitcoin’s market dominance. Bitcoin is currently trading for $36,423, representing an increase of 3.85% compared to yesterday’s value. Meanwhile, Ethereum’s price has increased by 9.89% on the day, while LTC gained 13.38% of its value.
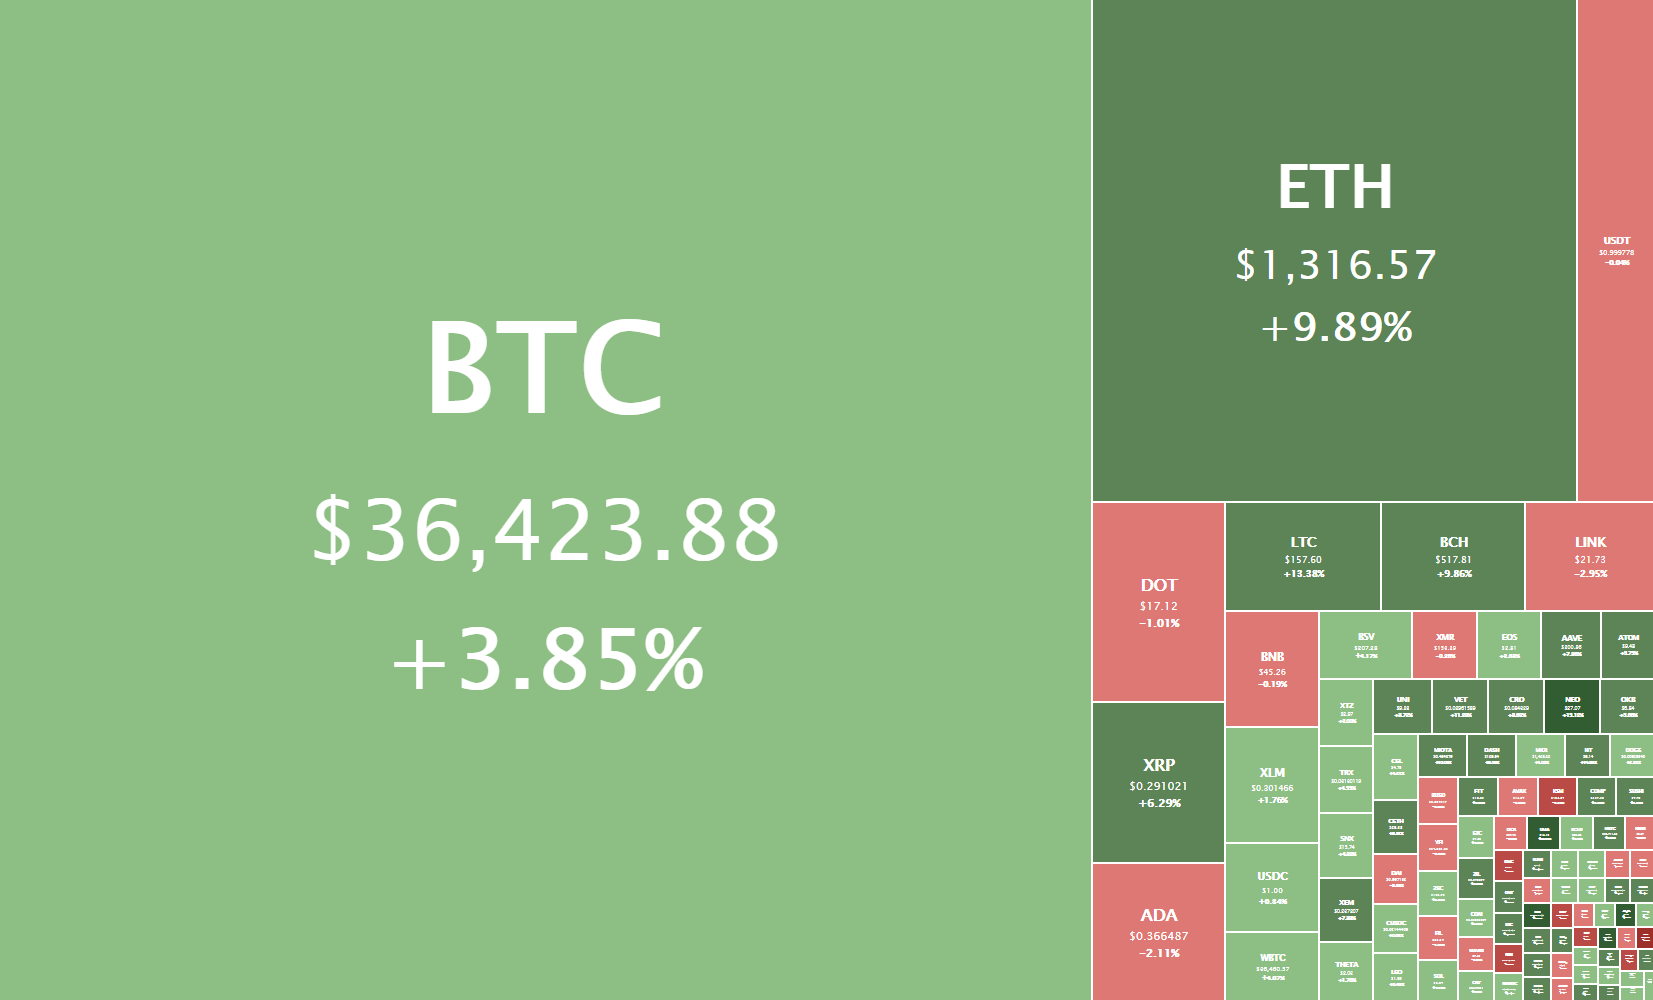
Daily Crypto Sector Heat Map
4THPILLAR TECHNOLOGIES gained 441.52% in the past 24 hours, making it the most prominent daily crypto gainer by far. It is followed by CryptoAds Marketplace’s 221.1% and YAMv2’s 181.43% gain. On the other hand, CY Finance lost 66.83%, making it the most prominent daily loser. It is followed by Basiscoin Share’s loss of 39.38% and Trading Membership Community’s loss of 37.1%.
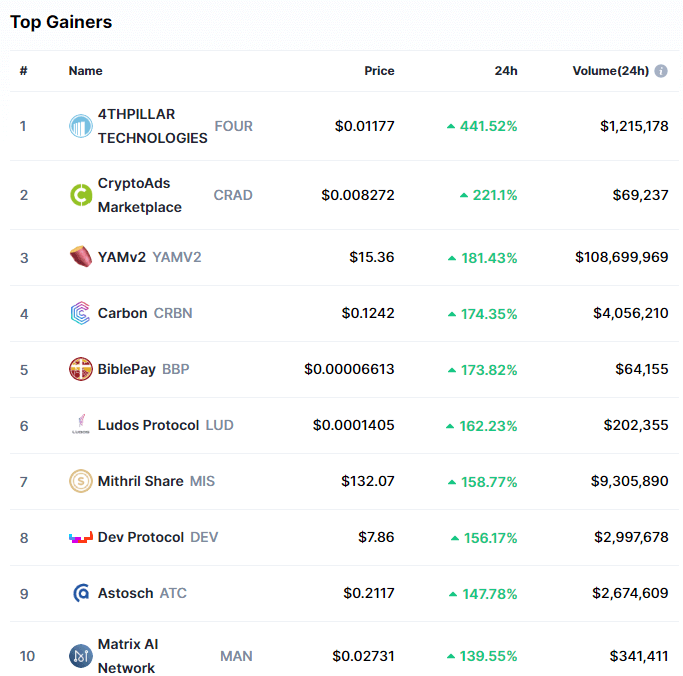
Top 10 24-hour Performers (Click to enlarge)
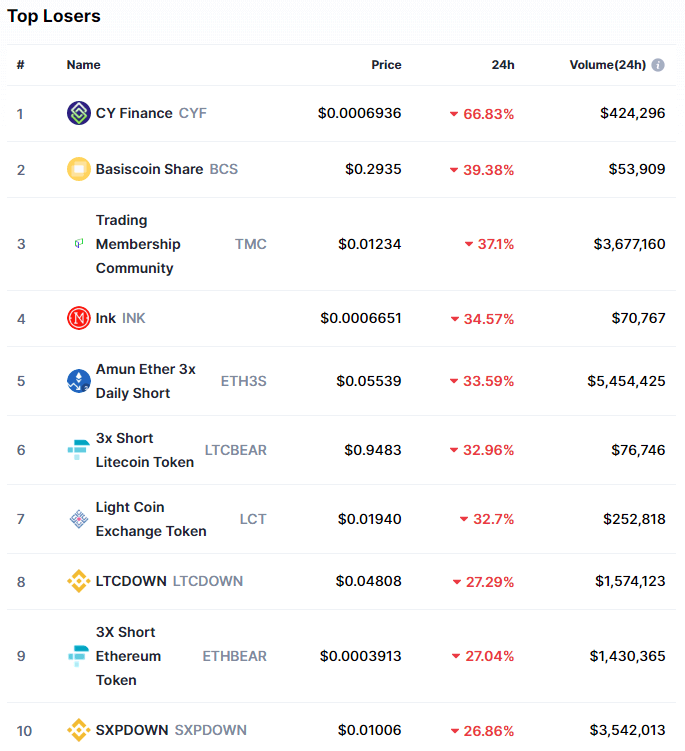
Bottom 10 24-hour Performers (Click to enlarge)
Bitcoin’s market dominance has moved down since our last report, with its value currently being 65.6%. This value represents a 0.5% difference to the downside when compared to the previously reported value.
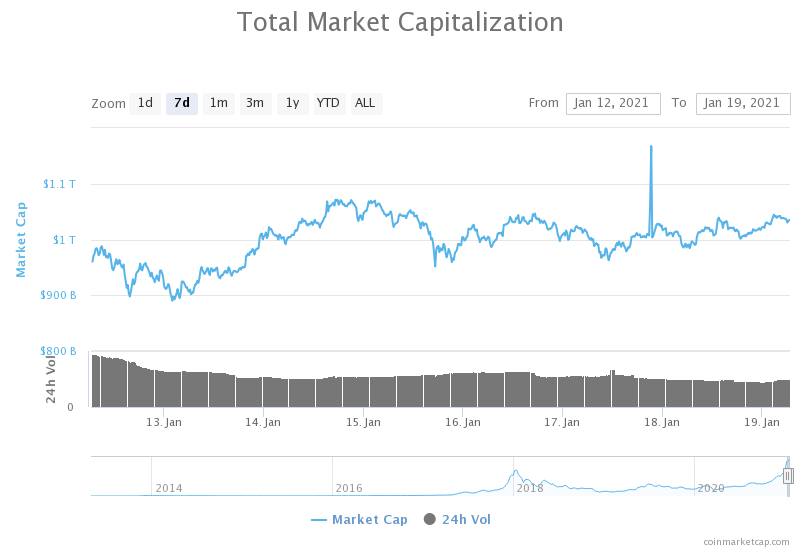
Weekly Crypto Market Cap Chart
The cryptocurrency sector’s market capitalization has returned above the $1 trillion mark since we last reported, with its current value being $1.034 trillion. This represents a $41.3 billion increase when compared to our previous report.
_______________________________________________________________________
What happened in the past 24 hours?
_______________________________________________________________________
- UK fund manager Ruffer: we are in the “foothills” of institutional adoption of bitcoin (The Block)
- Nvidia could make crypto mining GPUs again if there’s demand, says CFO (The Block)
- Shenzhen’s latest $3m digital yuan test sees nearly 140k transactions (The Block)
- Biden Will Name Gary Gensler as SEC Chairman (Cryptobriefing)
- Legendary Soccer Club AC Milan to Launch Fan Token (Cryptobriefing)
- Thread calling Bitcoin a “giant smoldering Chernobyl” goes viral on Twitter (Cryptoslate)
- Crypto Long & Short: No, Bitcoin Is Not in a Bubble (Coindesk)
- Ethereum price inches closer to a new all-time high as Bitcoin consolidates (Cointelegraph)
- More than 80% of LINK is controlled by 125 wallets (Cointelegraph)
- Uniswap’s founder wants your advice on how to spend $500 million (Cointelegraph)
_______________________________________________________________________
Technical analysis
_______________________________________________________________________
Bitcoin
Bitcoin spent the day mostly trading sideways, bound by the $34,627 to the downside and $37,445 to the upside. The price hopped between these levels and created a higher high higher low pattern, which later on broke after BTC couldn’t pass its immediate resistance level.
Bitcoin’s price has created a triangle pattern on the daily chart, and breaking this triangle to the upside or downside will determine the short-term price direction.
BTC/USD 1-hour chart
Bitcoin’s technicals on all time-frames show a slight bullish tilt, with its oscillators pointing towards the sell-side.
BTC/USD 1-day Technicals
Technical factors (1-hour Chart):
- Price is at both its 50-period EMA and its 21-period EMA
- Price is at its middle Bollinger band
- RSI is neutral (49.56)
- Volume is average (low)
Key levels to the upside: Key levels to the downside:
1: $37,445 1: $34,627
2: $40,000 2: $32,350
3: $42,000 3: $27,960
Ethereum
Unlike Bitcoin, Ethereum has spent the day first slowly preparing for a move and then explosively pushing to the upside. The second-largest cryptocurrency by market cap has, after confirming its position above the $1,211 level, shot up towards the $1,350 level, which it was not able to break. With the volume descending after that move, ETH will most likely not be able to break $1,350 unless a new wave of bulls comes into the market.
ETH/USD 1-hour Chart
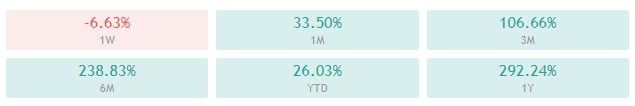
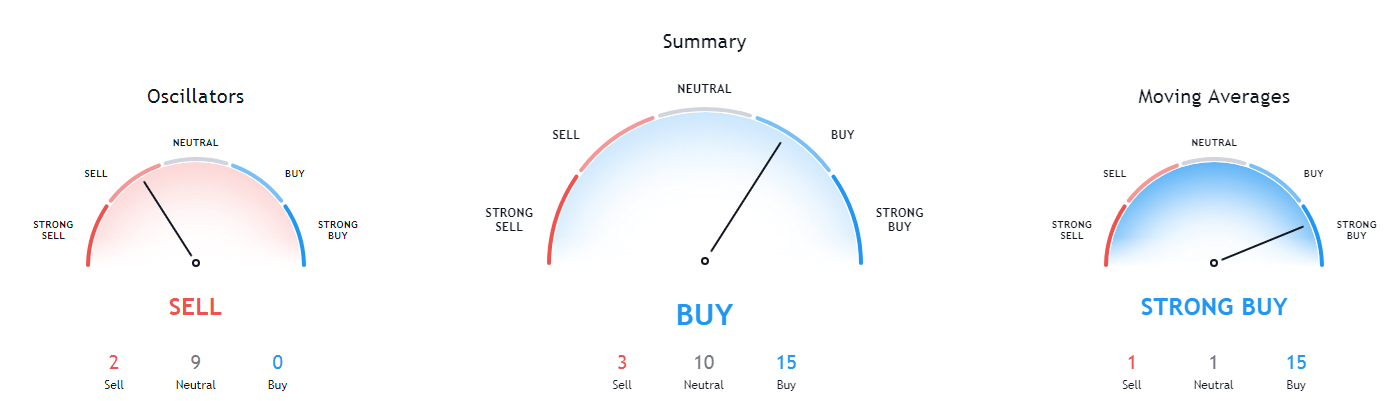
Ethereum’s 4-hour, daily, and monthly technicals are completely bullish and show no signs of neutrality or bearishness. On the other hand, its weekly overview shows some neutrality.
ETH/USD 1-day Technicals
Technical Factors (1-hour Chart):
- Price is above both its 50-period and its 21-period EMA
- Price is at its top Bollinger band
- RSI has just left the overbought area (67.24)
- Volume has spiked up in the recent hours
Key levels to the upside: Key levels to the downside:
1: $1,350 1: $1,211
2: $1,420 2: $1,183.85
3: $1,450 3: $1,060.5
Litecoin
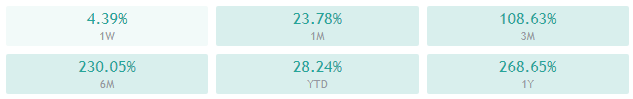
Litecoin was one of the largest daily gainers after its price suddenly shot up from $141 all the way up to $160 in just one hourly candle. While it seemed at first like the retracement will eat away the gains LTC made, the cryptocurrency made another push towards the upside and stopped just below the $161.55 resistance level.
Litcoin’s descending volume and price movement, as well as the number of sell orders near the $161.55 level, will most likely be enough to keep LTC below the resistance level for now.
LTC/USD 1-hour Chart
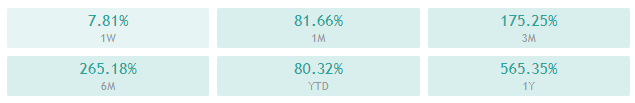
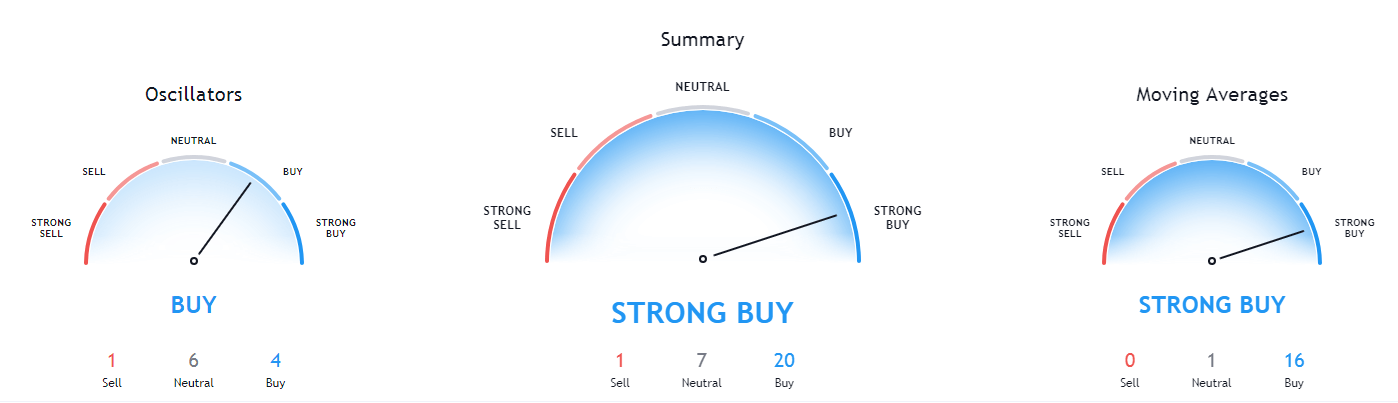
Litecoin’s technicals on the 4-hour, daily, and weekly time-frame are completely bullish, while its monthly technicals are slightly more neutral.
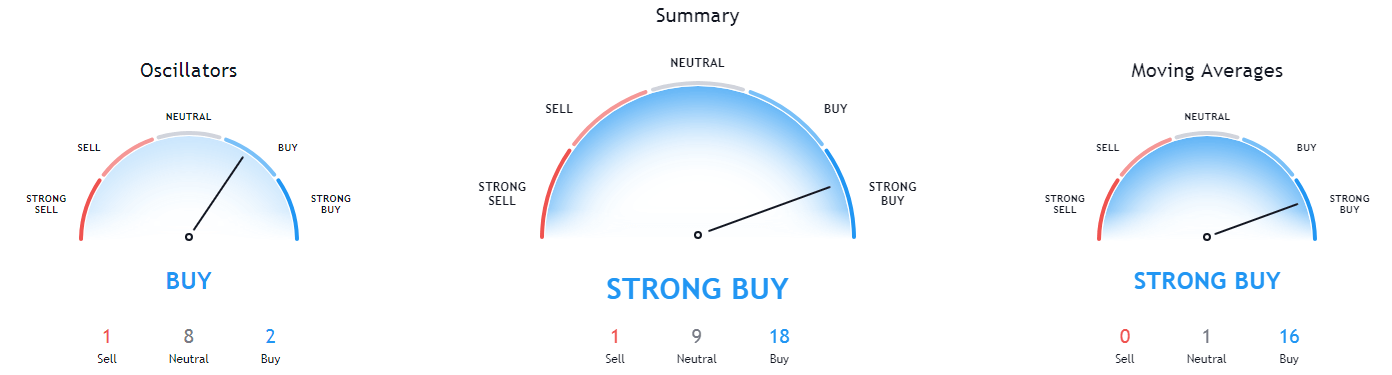
LTC/USD 1-day Technicals
Technical factors (1-hour Chart):
- Its price is above both its 50-period EMA and its 21-period EMA
- Price close to its top Bollinger band
- RSI is neutral (66.70)
- Volume is above average
Key levels to the upside: Key levels to the downside:
1: $161.5 1: $142.1
2: $181.3 2: $128.42
3: $186.3 3: $114.75
Related posts
 Daily Crypto Review, Jan 8 – Bitcoin Continues Its Rise as it Breaks the $40k Mark Briefly
 Daily Crypto Review, Jan 11 – Crypto Sector Plummets as BTC Drops to $32k
 Daily Crypto Review, Jan 20 – ETH Reaches a New All-Time High; Crypto Sector in the Red
 Daily Crypto Review, Jan 22 – Bitcoin Briefly Drops Below $30K; Market Sees Blood on the Streets