Categories
Crypto Market Analysis

Daily Crypto Review, Jan 29 – Dogecoin Skyrockets as r/Wallstreetbets Enters on Crypto; Bitcoin Jumps on Elon Musk’s Twitter Profile

The cryptocurrency space had a wild week, first because of the r/WallStreetBets community entering the market (and pumping Dogecoin’s price by over 1000%) and then because of Tesla’s CEO Elon Musk tweeting about Bitcoin and promoting it. This has, in turn, caused Bitcoin to spike from $31,000 all the way to $38,200 in a matter of one hour. An interesting fact is that Musk’s Twitter bio now has #bitcoin displayed for everyone to see.

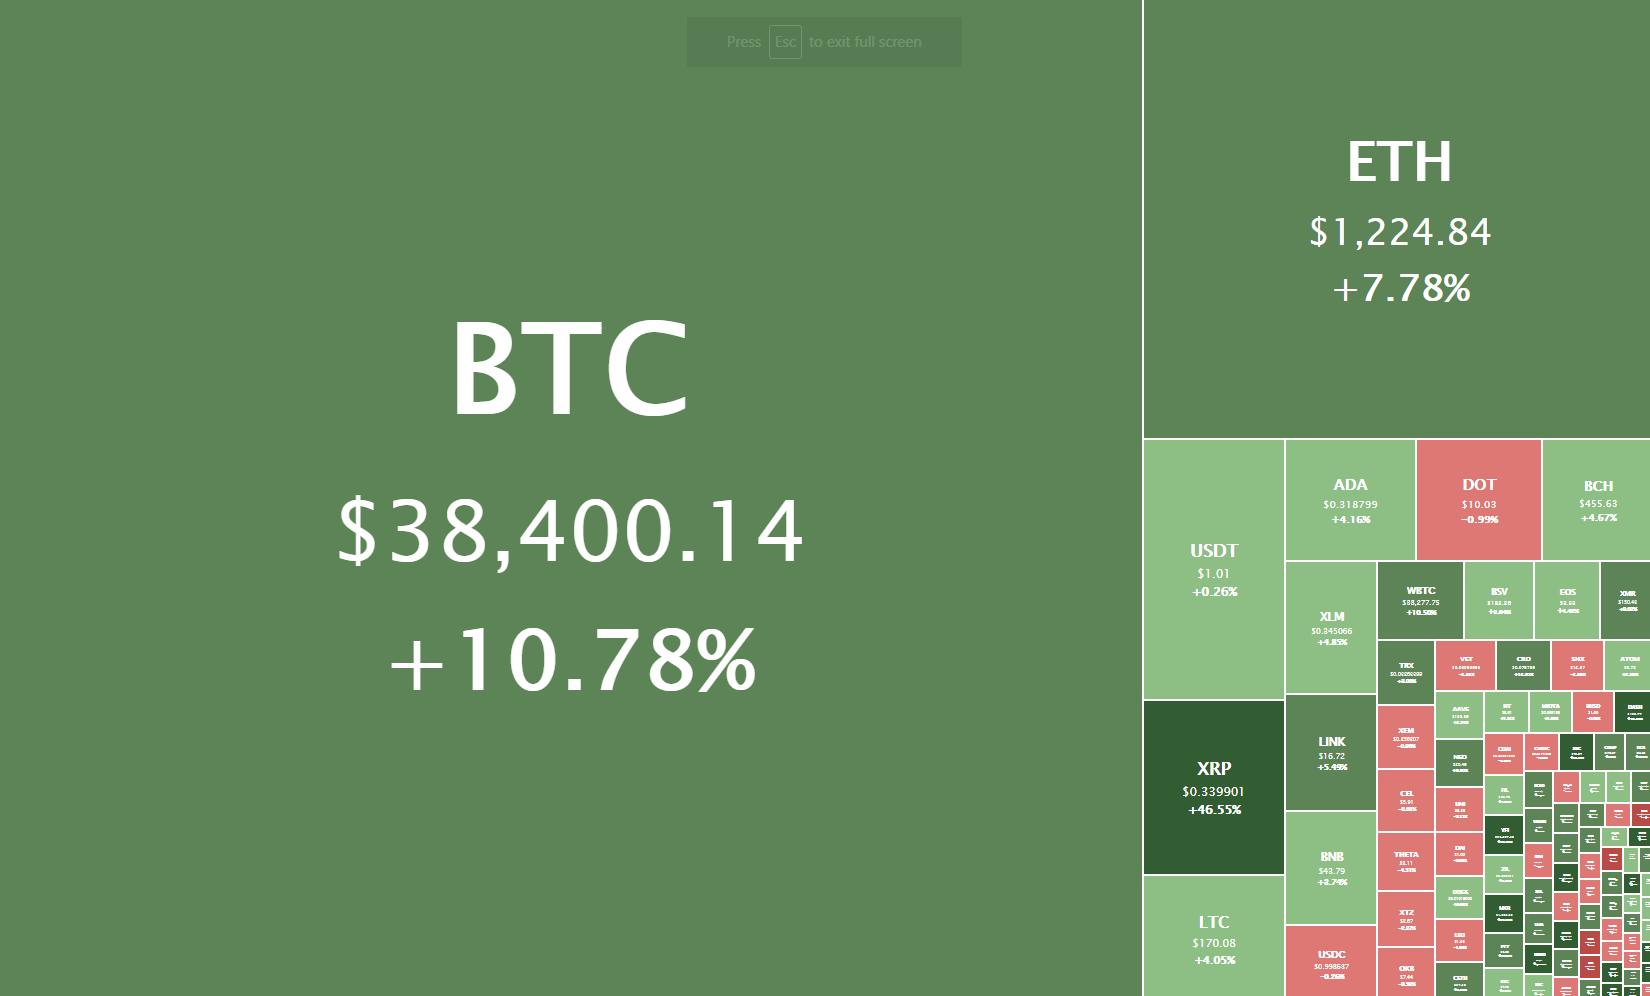
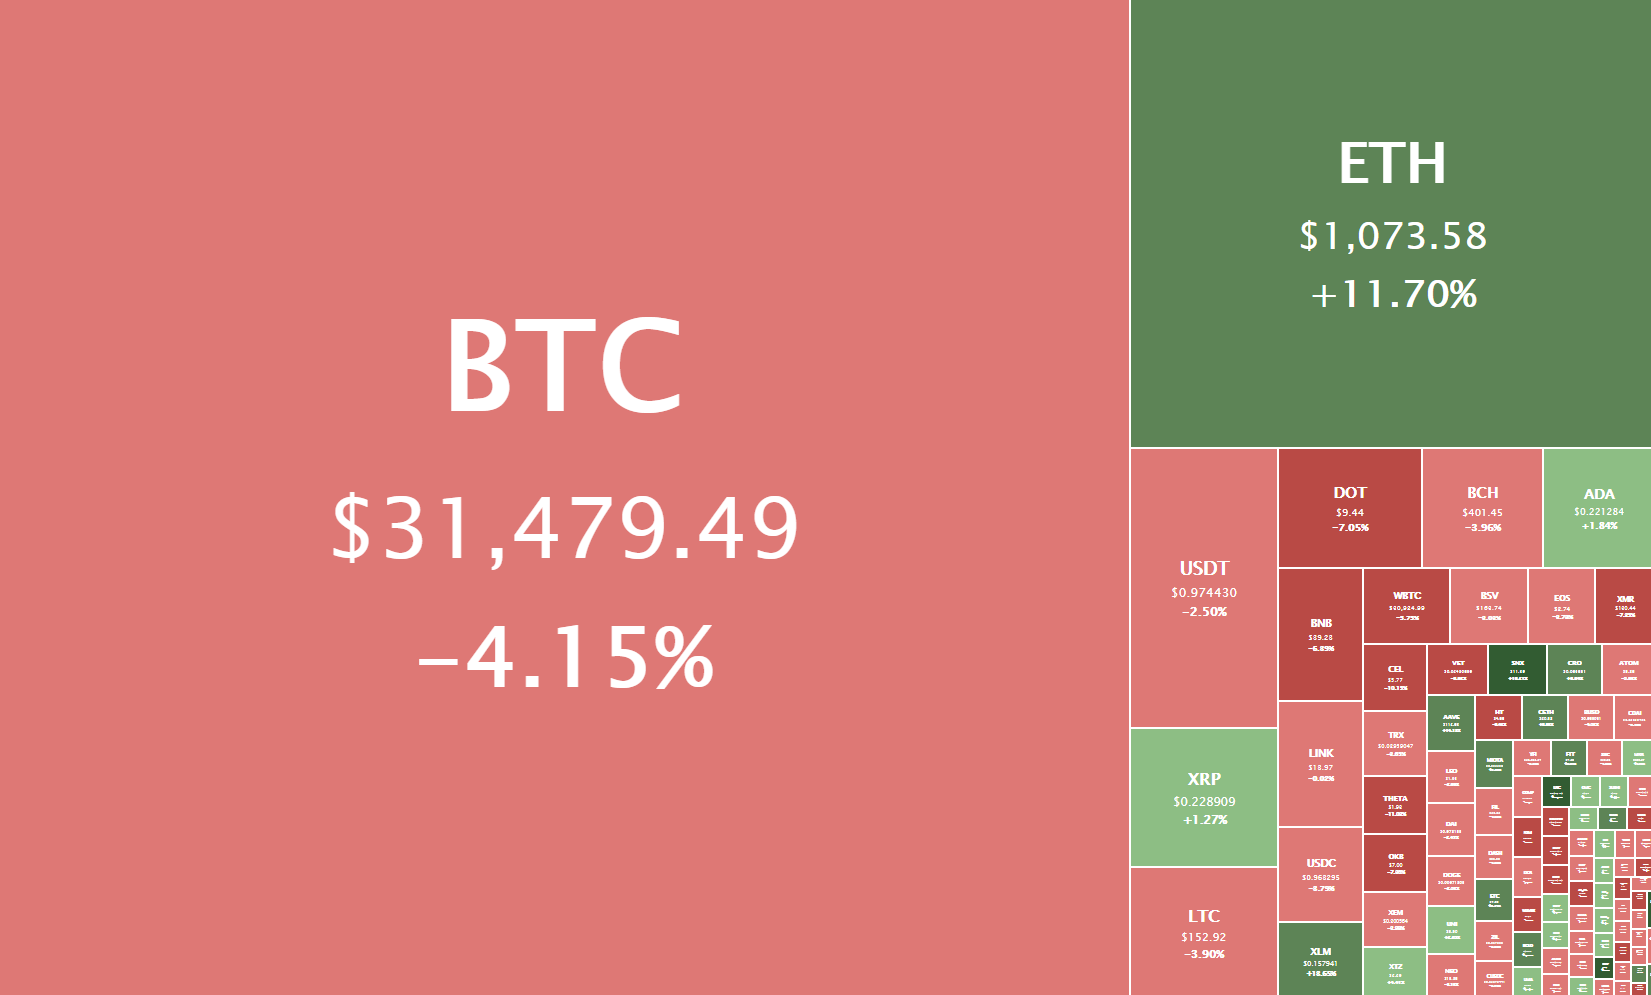
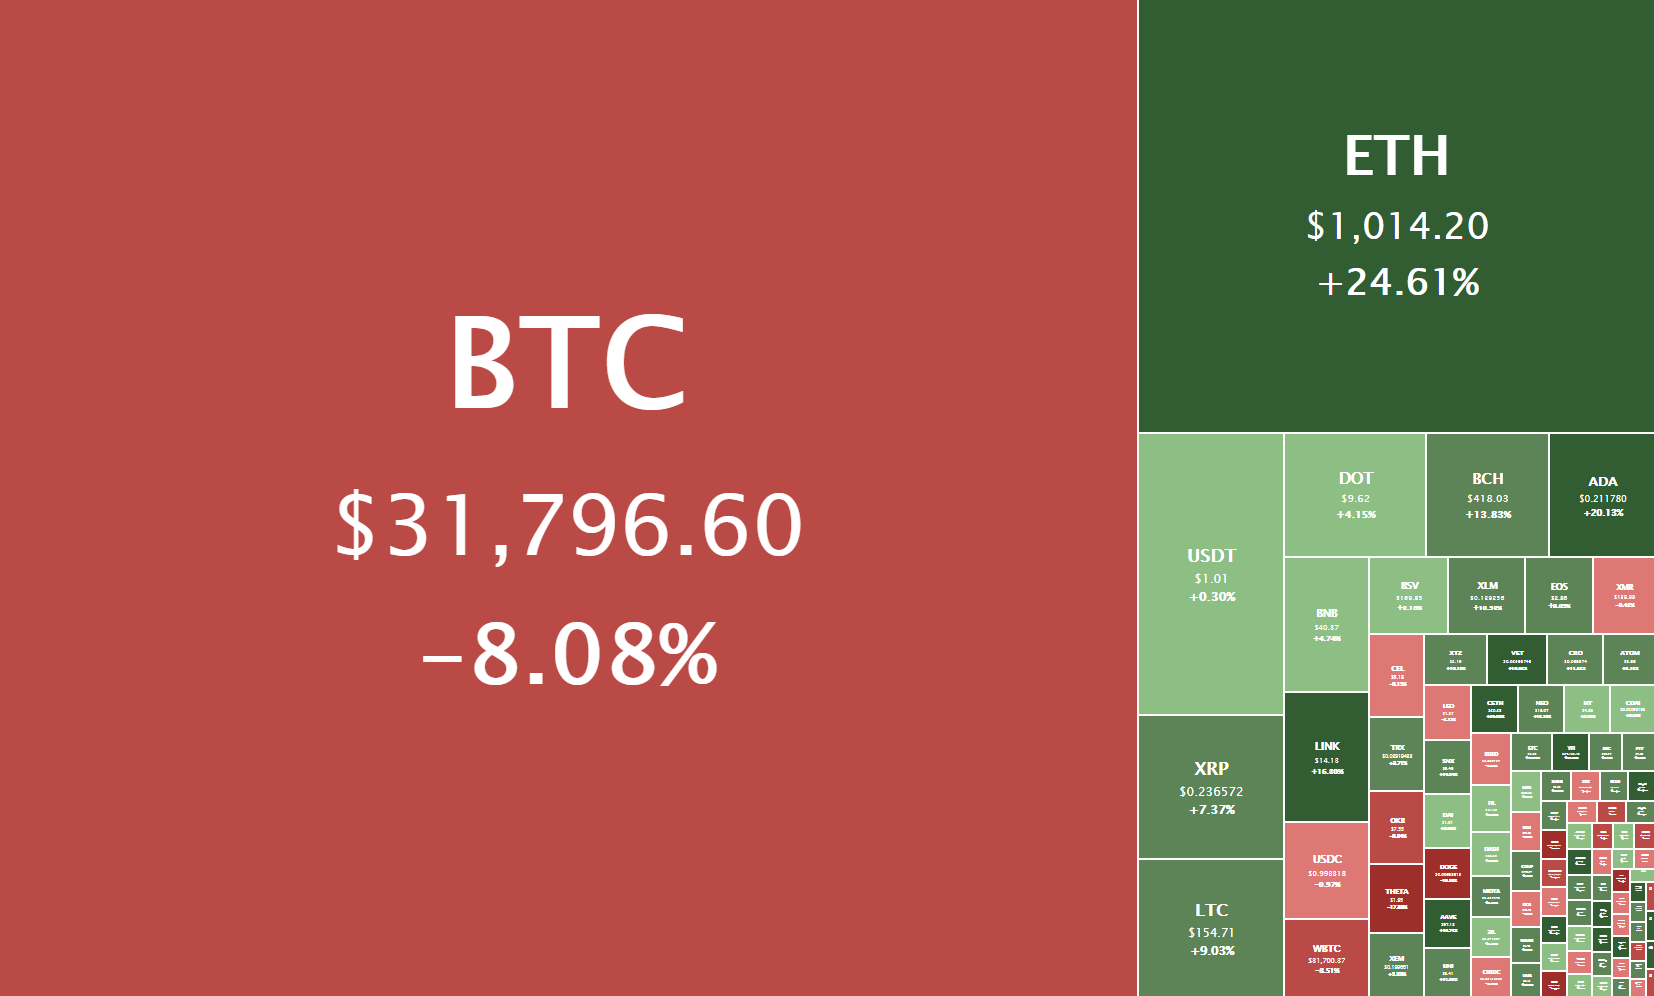
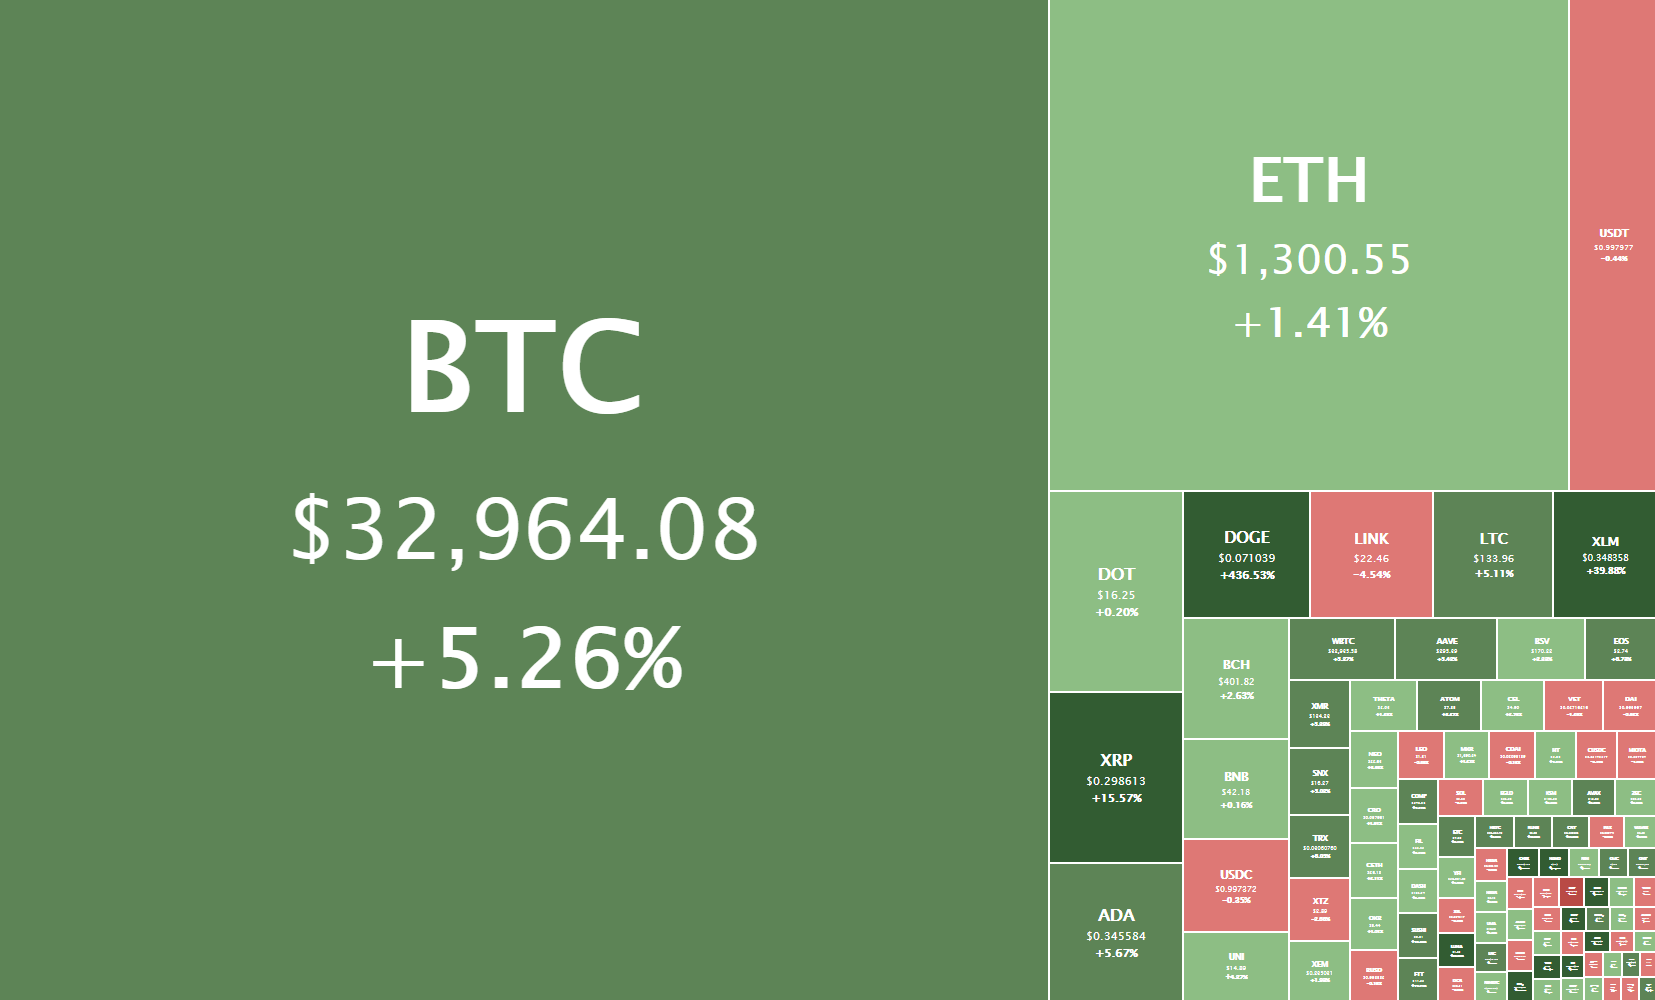
The crypto sector ended the day with most of the top cryptocurrencies in the green. Most analysts speculate that the recent wave of buyers came as a result of Dogecoin’s incredible pump, which was caused by the notorious r/WallStreetBets subreddit. Bitcoin is currently trading for $32,964, representing an increase of 5.26% compared to yesterday’s value. Meanwhile, Ethereum’s price has increased by 1.41% on the day, while Litecoin gained 5.11% of its value.

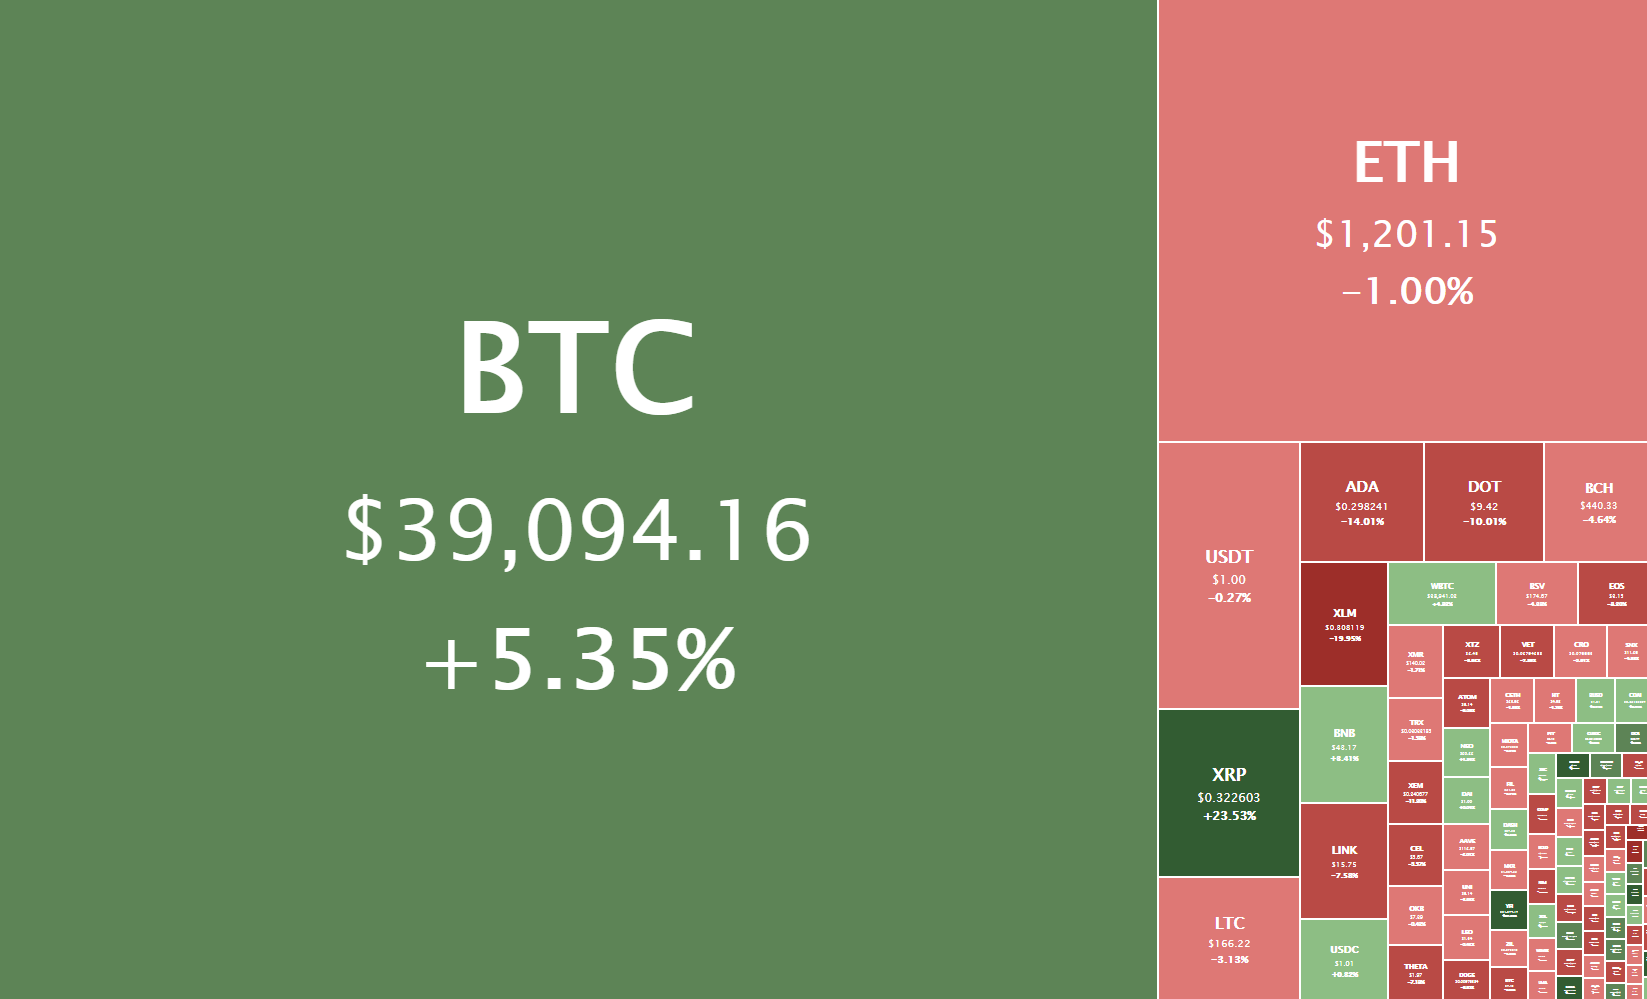
Daily Crypto Sector Heat Map

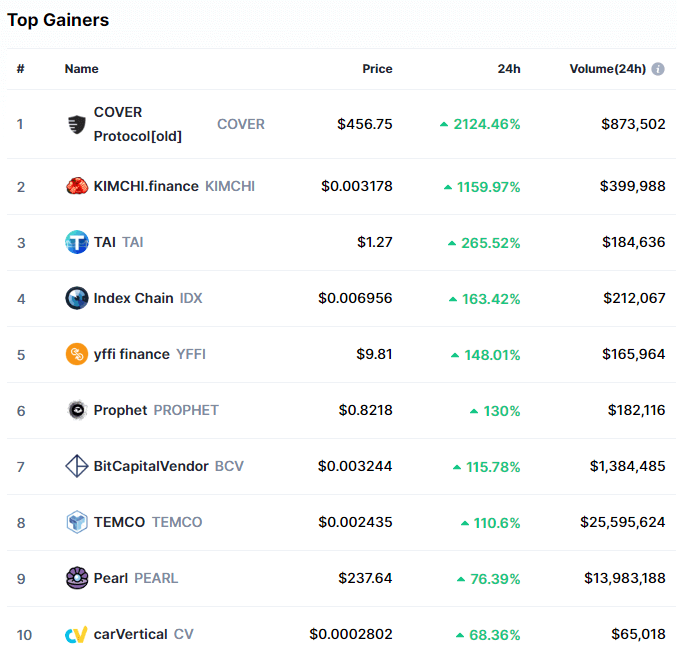
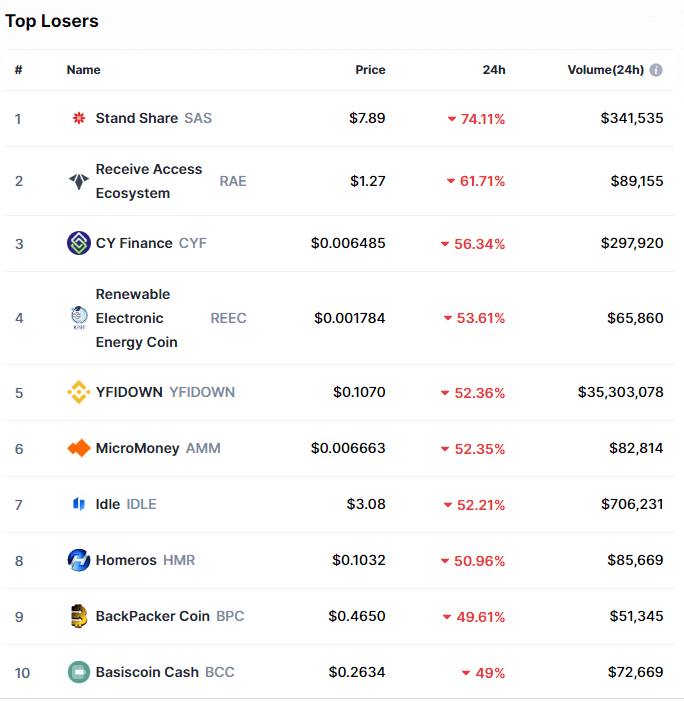
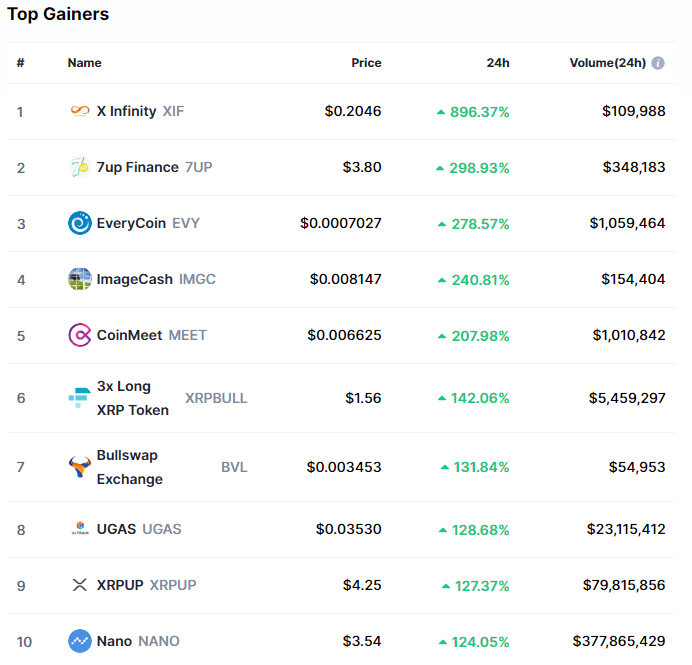
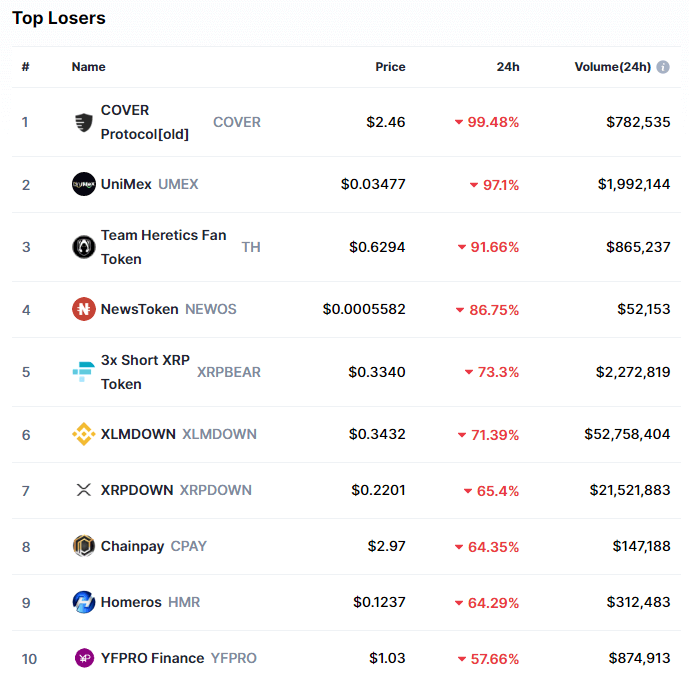
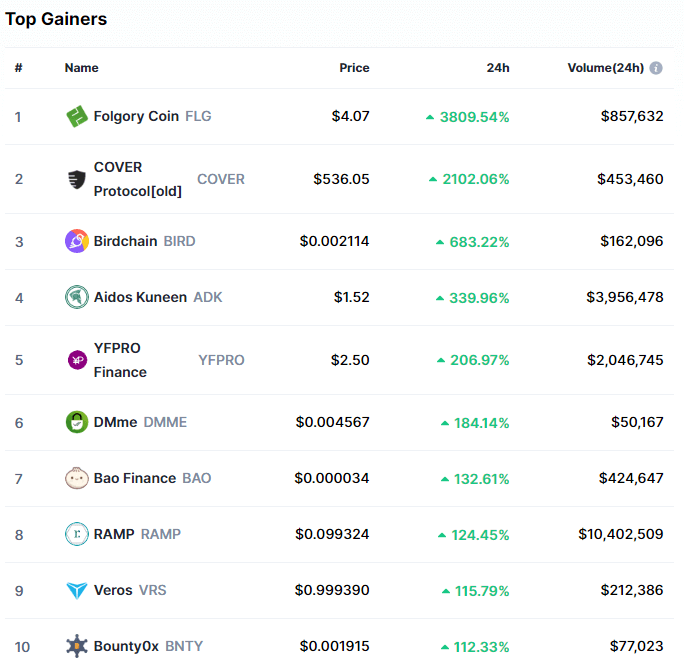
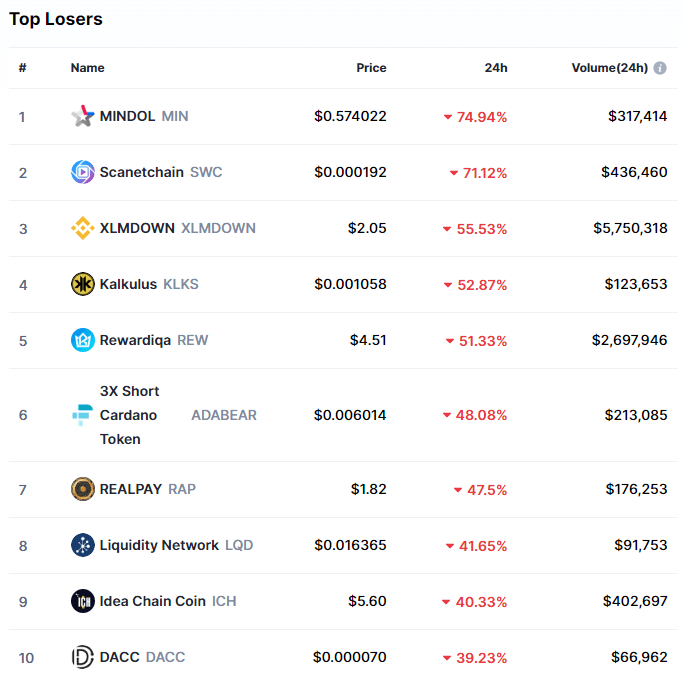
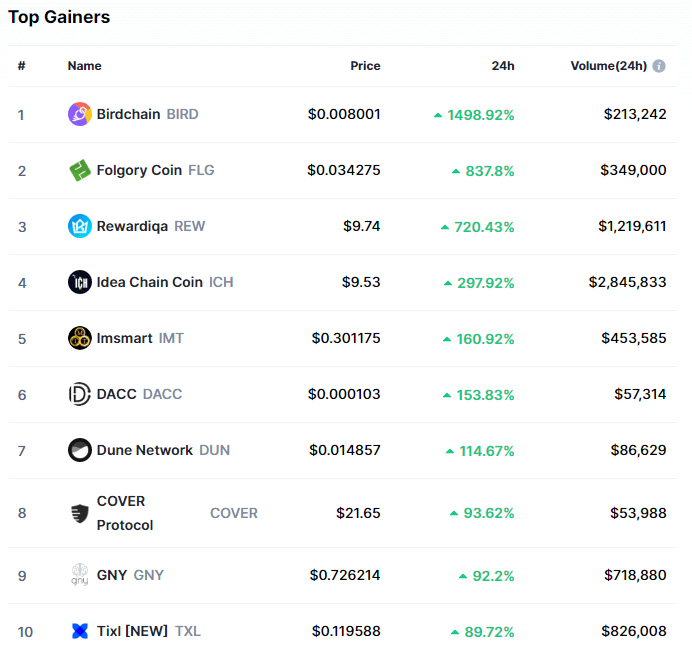
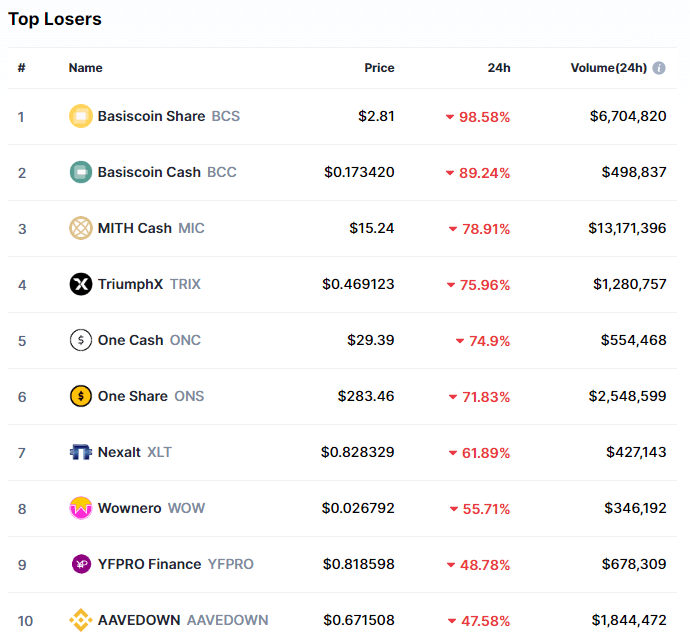
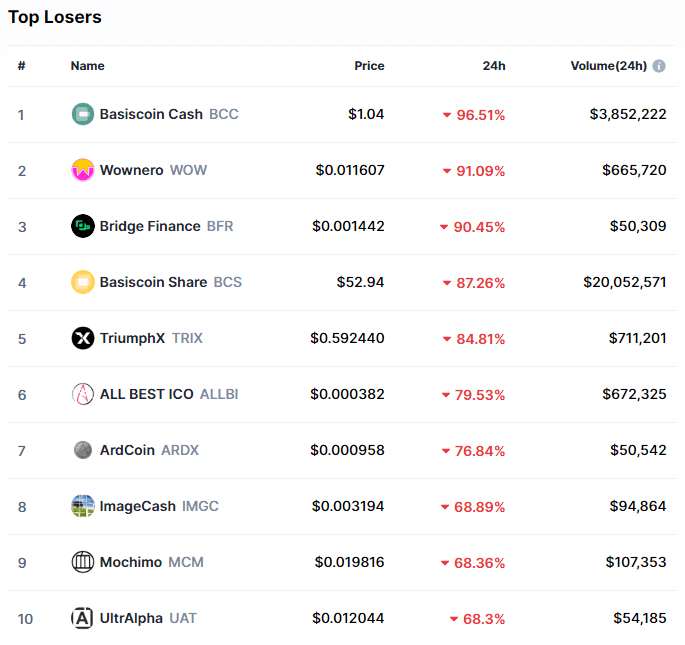
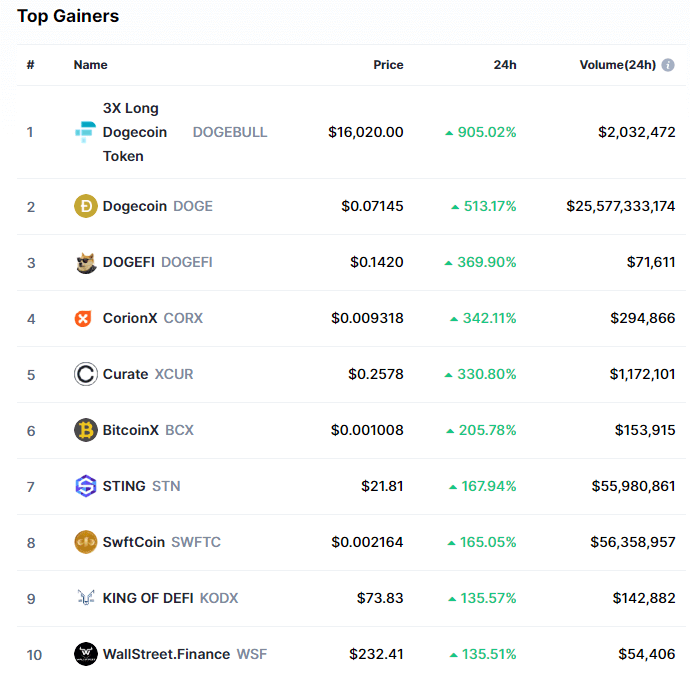
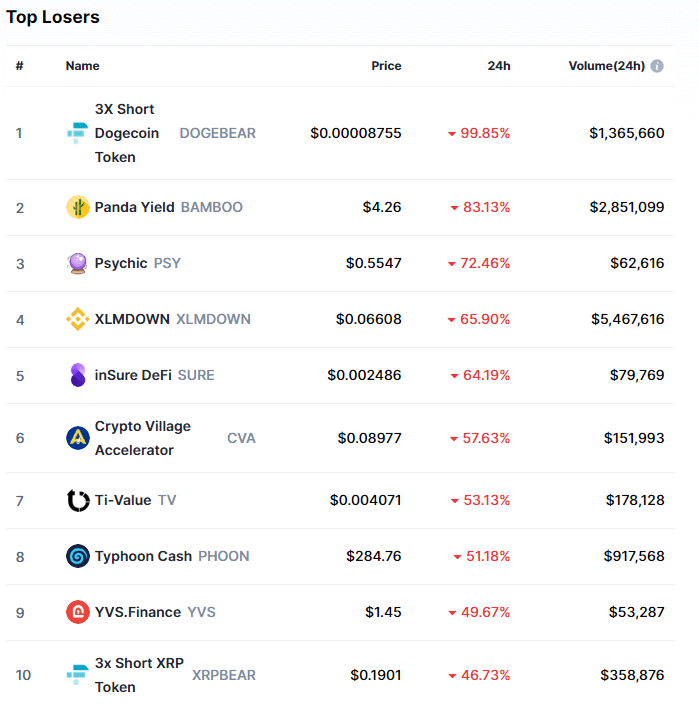
3X Long Dogecoin Token gained 905.02% in the past 24 hours, making it the most prominent daily crypto gainer by far. It is followed by Dogecoin’s 513.17% and DOGEFI’s 369.90% gain. On the other hand, 3X Short Dogecoin Token lost 99.85%, making it the most prominent daily loser. It is followed by Panda Yield’s loss of 83.13% and Psychic’s loss of 72.46%.

Top 10 24-hour Performers (Click to enlarge)

Bottom 10 24-hour Performers (Click to enlarge)

Bitcoin’s market dominance decreased slightly from when we last reported, currently 62.8%. This represents a 0.1% decrease from our previous report.

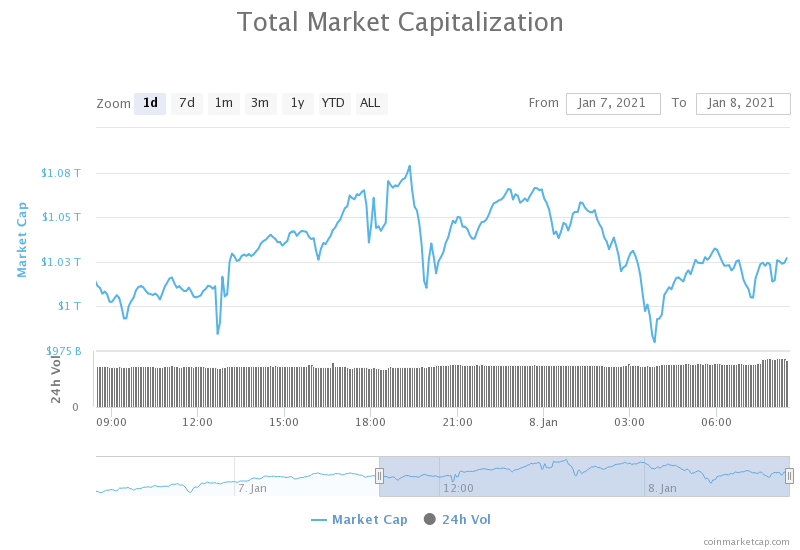
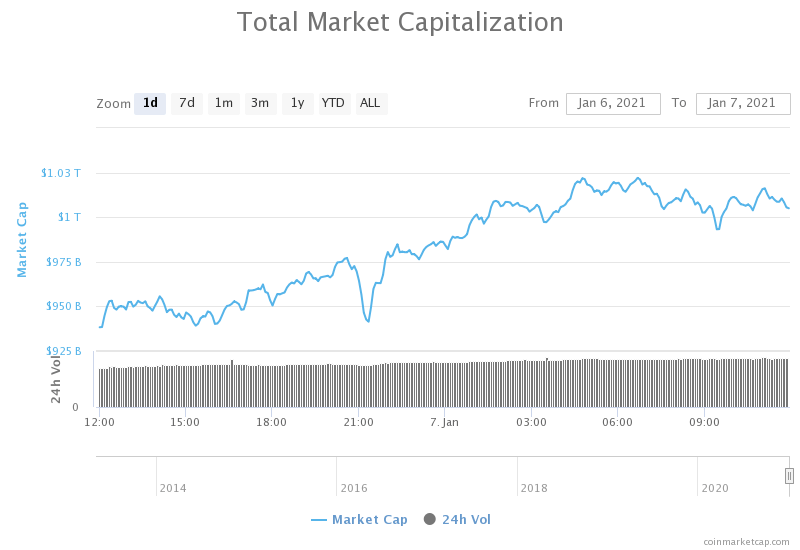
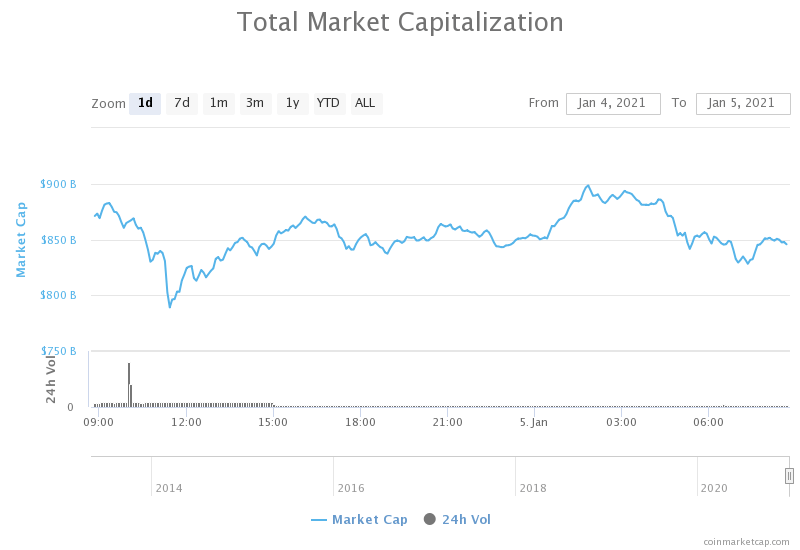
Weekly Crypto Market Cap Chart

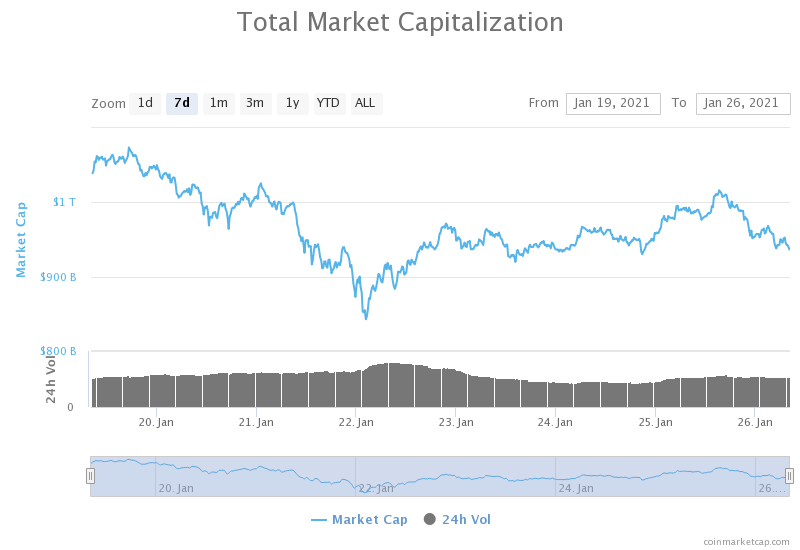
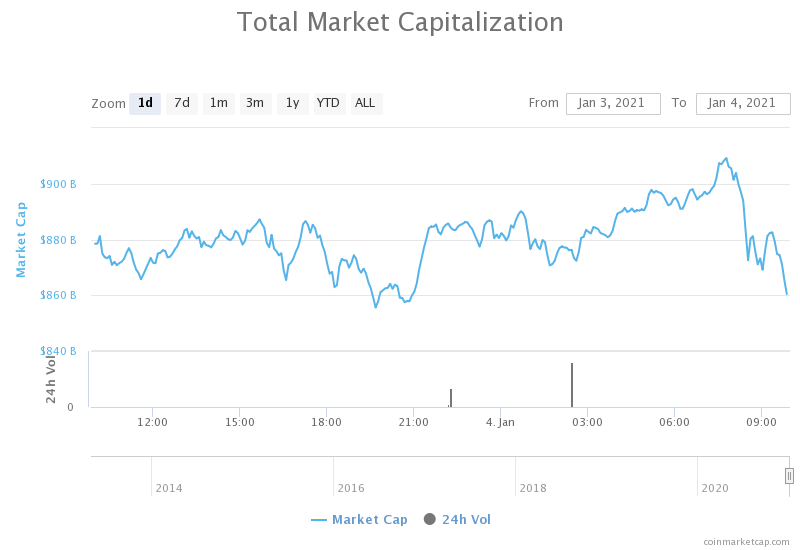
The cryptocurrency sector’s market capitalization has increased greatly since we last reported, with its current value being $979.02 billion. This represents a $54.27billion increase when compared to our previous report.

_______________________________________________________________________

What happened in the past 24 hours?

_______________________________________________________________________

_______________________________________________________________________

Technical analysis

_______________________________________________________________________

Bitcoin

Bitcoin has spent the day attempting to push its price up as the market turned to green. Its price conquered the $32,350 level and pushed higher without hesitation. The move ended as bulls reached exhaustion near the $34,627 level. BTC’s inability to push past its immediate resistance has triggered a pullback, and the cryptocurrency is now most likely to retest the $32,350 level.

The overall change in market direction today came as a result of (as most speculate) Dogecoin’s insane upswing triggered by r/WallStreetBets.

BTC/USD 1-hour chart

Bitcoin’s technicals on all time-frames are either neutral with a slight hint of bullishness or bullish with a slight hint of neutrality.

BTC/USD 1-day Technicals

Technical factors (1-hour Chart):

  • Price is above its 50-period EMA and at its 21-period EMA
  • Price is at its middle Bollinger band
  • RSI is neutral (51.01)
  • Volume is above average

Key levels to the upside:          Key levels to the downside:

1: $34,627                             1: $32,350

2: $37,445                             2: $30,072

3: $38,000                             3: $27,960

Ethereum

After yesterday’s failed break of the top downtrend line, the second-largest cryptocurrency by market cap pushed past and broke its descending pattern. Its price (at one point) went past the $1,350 level, but as bulls couldn’t confidently hold this level, bears initiated a pullback.

Ethereum’s short-term price direction will be dictated by how the cryptocurrency handles the top downtrend line (which is now a support rather than a resistance line) as well as by Bitcoin’s price direction.

ETH/USD 1-hour Chart

Ethereum’s technicals on all time-frames are bullish but also show a hint of bearishness.

ETH/USD 1-day Technicals

Technical Factors (1-hour Chart):

  • Price is slightly below both its 50-period and its 21-period EMA
  • Price slightly below its middle Bollinger band
  • RSI is neutral (45.66)
  • Volume is average

Key levels to the upside:          Key levels to the downside:

1: $1,350                               1: $1,211

2: $1,420                               2: $1,183.85

3: $1,440                               3: $1047.6

Litecoin

Litecoin has confirmed its position above the $128.4 level after pushing its price above it yesterday. LTC is now in consolidation mode and is currently testing the 21-hour EMA. Its recent moves seem slightly unenthusiastic, meaning that its short-term price direction will most likely be determined by other cryptocurrencies’ movements.

LTC/USD 1-hour Chart

Litecoin’s 4-hour and daily overviews are neutral/bearish, while its weekly and monthly overviews are completely bullish.

LTC/USD 1-day Technicals

Technical factors (1-hour Chart):

  • Its price is slightly above both its 50-period EMA and its 21-period EMA
  • Price slightly above its middle Bollinger band
  • RSI is neutral (55.45)
  • Volume is average

Key levels to the upside:          Key levels to the downside:

1: $142.1                               1: $128.42

2: $161.5                               2: $120

3: $181.3                               3: $114.75

Categories
Crypto Market Analysis

Daily Crypto Review, Jan 28 – Bitcoin Strong Bounce off the 30K level, Altcoins Reversals Followed

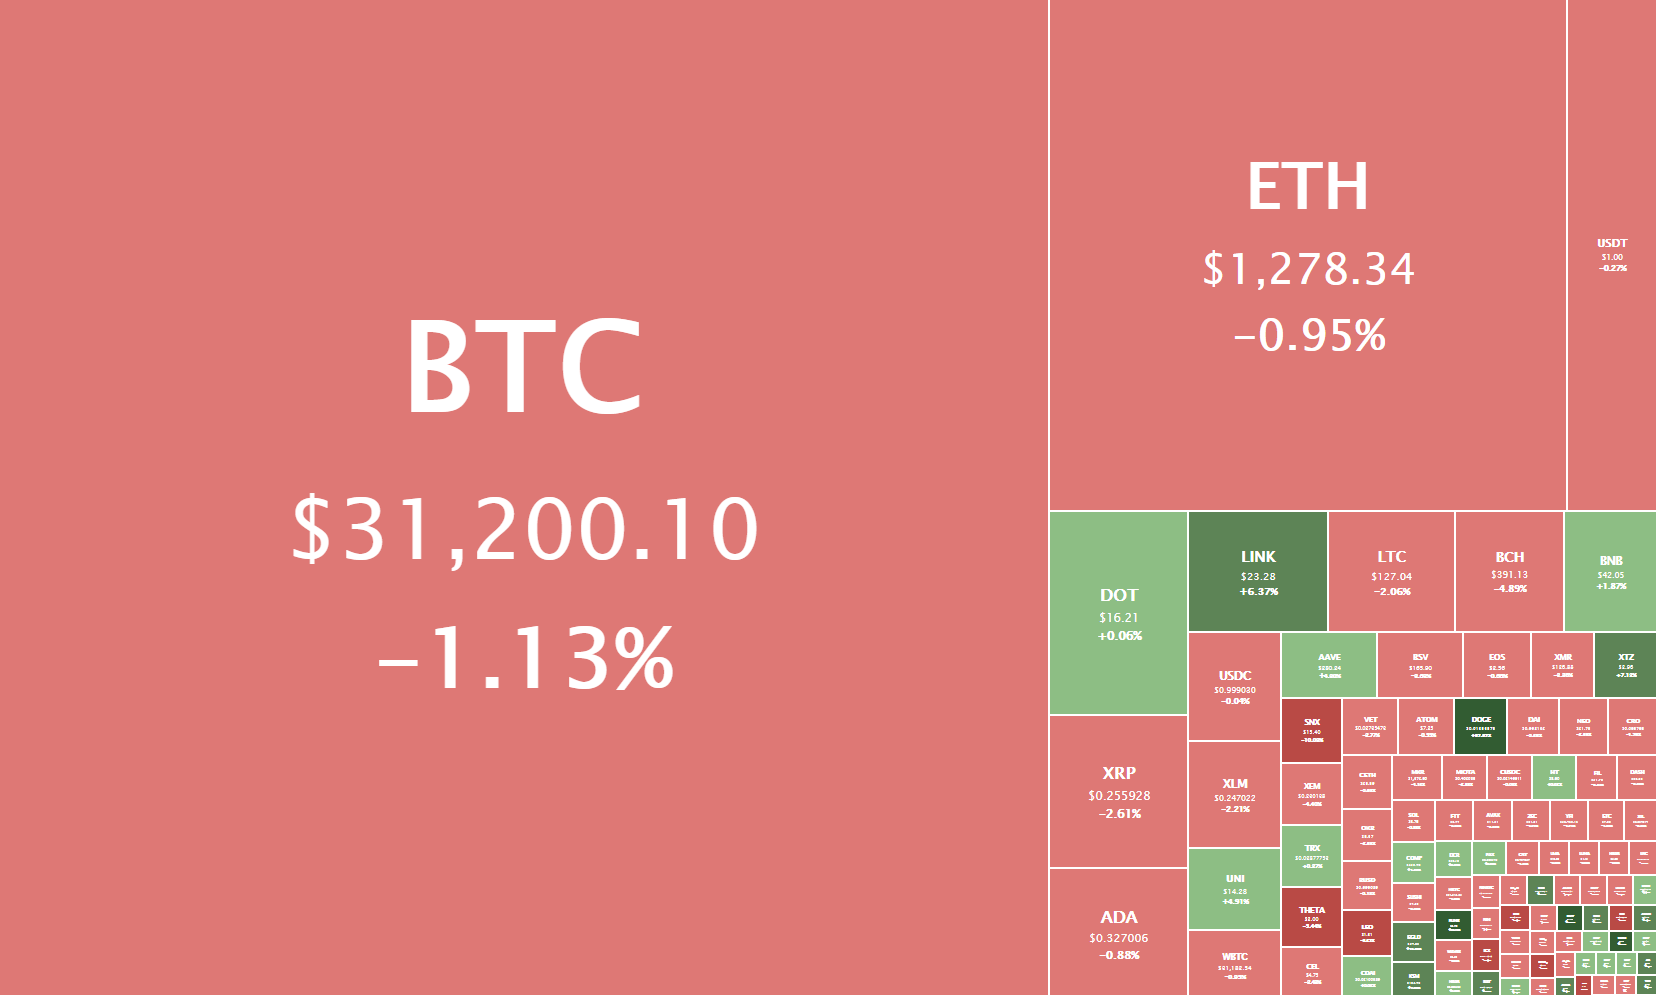
The crypto sector ended up almost completely in the red, though most cryptos barely lost any value. Bitcoin is currently trading for $31,200, representing a decrease of 1.13% compared to yesterday’s value. Meanwhile, Ethereum’s price has decreased by 0.95% on the day, while LTC lost 2.06% of its value.

Daily Crypto Sector Heat Map

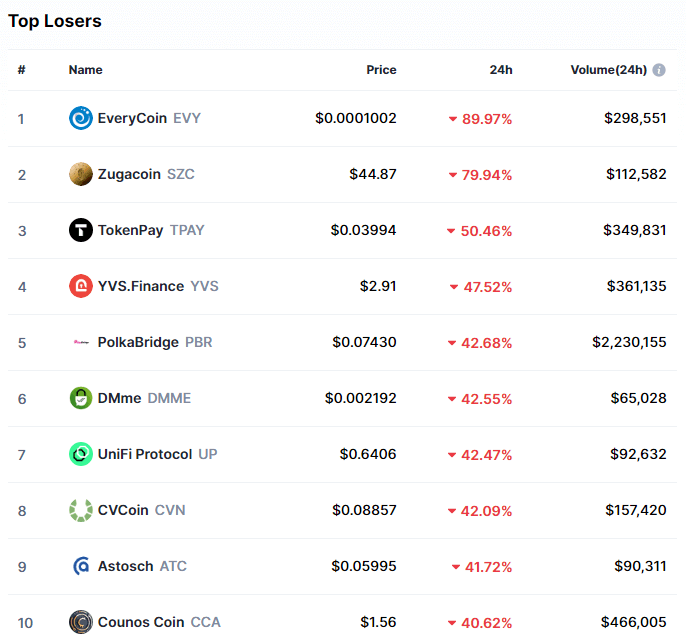
Zero Collateral Dai gained 828.50% in the past 24 hours, making it the most prominent daily crypto gainer by far. It is followed by QuadrantProtocol’s 327.68% and 3x Long Dogecoin Token’s 137.80% gain. On the other hand, EveryCoin lost 89.97%, making it the most prominent daily loser. It is followed by Zugacoin’s loss of 79.94% and TokenPay’s loss of 50.46%.

Top 10 24-hour Performers (Click to enlarge)

Bottom 10 24-hour Performers (Click to enlarge)

Bitcoin’s market dominance decreased slightly from when we last reported, currently 62.9%. This represents a 0.2% decrease from our previous report.

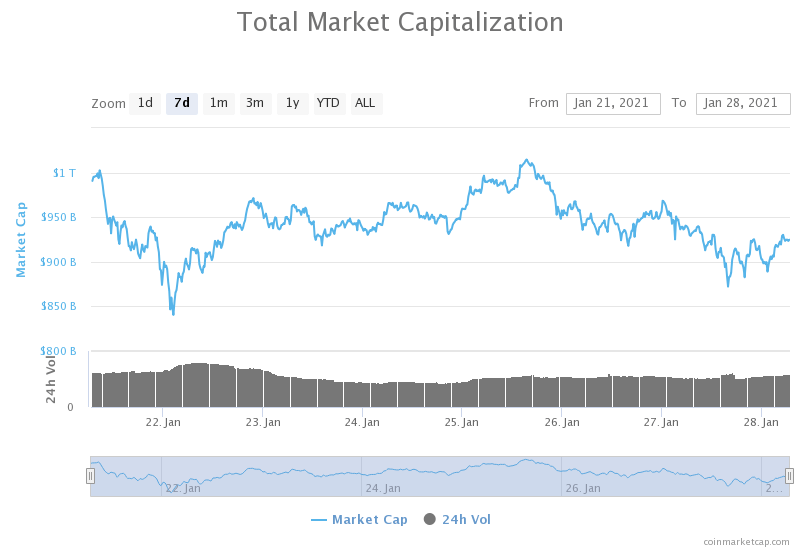
Weekly Crypto Market Cap Chart

The cryptocurrency sector’s market capitalization has decreased very slightly since we last reported, with its current value being $924.75 billion. This represents a $10.78 billion decrease when compared to our previous report.

_______________________________________________________________________

What happened in the past 24 hours?

_______________________________________________________________________

_______________________________________________________________________

Technical analysis

_______________________________________________________________________

Bitcoin


After another day of its price moving towards the downside, Bitcoin attempted a rally towards the $32,350 mark. After its price establishing strong support at the $30,000 level, the largest cryptocurrency by market cap started surging. There is a strong chance that BTC will pass the $32,350 level if the hourly candle ends up above the 21-hour EMA.

Scott Minerd, the CIO of investment services firm Guggenheim, said that the institutional demand is insufficient to keep BTC above $30,000. Many analysts agree with this short-term assessment, while almost all of them are bullish in the long-term.

BTC/USD 1-hour chart

Bitcoin’s daily overview is mostly neutral (with some hints of bearishness), while its weekly and monthly overviews are tilted towards the buy-side. On the other hand, its 4-hour time-frame is completely bearish.

BTC/USD 1-day Technicals

Technical factors (1-hour Chart):

  • Price is above its 50-period EMA and its 21-period EMA
  • Price is slightly above its middle Bollinger band
  • RSI is neutral (56.39)
  • Volume is above average

Key levels to the upside:          Key levels to the downside:

1: $32,350                             1: $30,072

2: $34,627                             2: $30,000

3: $37,445                             3: $27,960

Ethereum

The second-largest cryptocurrency by market cap spent the day testing the $1,211 level multiple times. After the support level held up on various occasions, ETH bulls entered the market and started pushing its price up. However, it is still uncertain whether this push towards the upside will end as another lower high and a continuation of the downtrend, or a break from the trend.

Ethereum’s immediate downside is guarded by the 21-hour and 50-hour EMAs, while its first major resistance level is the $1,350 mark, as well as the descending line that connects ETH’s recent lower highs.

ETH/USD 1-hour Chart

Ethereum’s technicals on the daily, weekly, and monthly time-frames are tilted towards the buy-side but also show some neutrality. Its 4-hour overview, however, is slightly bearish.

ETH/USD 1-day Technicals

Technical Factors (1-hour Chart):

  • Price is above both its 50-period and its 21-period EMA
  • Price at its top Bollinger band
  • RSI is neutral (57.04)
  • Volume is average

Key levels to the upside:          Key levels to the downside:

1: $1,350                               1: $1,211

2: $1,420                               2: $1,183.85

3: $1,440                               3: $1047.6

Litecoin

Litecoin managed to break out from its downtrend after breaking the $128.4 mark. What’s surprising is that such a strong trend was broken by just average volume. LTC found support in the 21-hour EMA, which currently stands right below the price level.

Litecoin has a zone of heavy resistance straight above it (above $130). It is very unlikely that it can “survive” without a major boost in volume, especially in these market conditions.

LTC/USD 1-hour Chart

Litecoin’s daily overview is mostly neutral (with some hints of bearishness), while its weekly and monthly overviews are tilted towards the buy-side. On the other hand, its 4-hour time-frame is completely bearish.

LTC/USD 1-day Technicals

Technical factors (1-hour Chart):

  • Its price is above both its 50-period EMA and its 21-period EMA
  • Price at its top Bollinger band
  • RSI is neutral (58.51)
  • Volume is average

Key levels to the upside:          Key levels to the downside:

1: $142.1                               1: $128.42

2: $161.5                               2: $120

3: $181.3                               3: $114.75
Categories
Crypto Market Analysis

Daily Crypto Review, Jan 27 – Bitcoin (BTC), Ethereum (ETH), Litecoin (LTC) Price Analysis

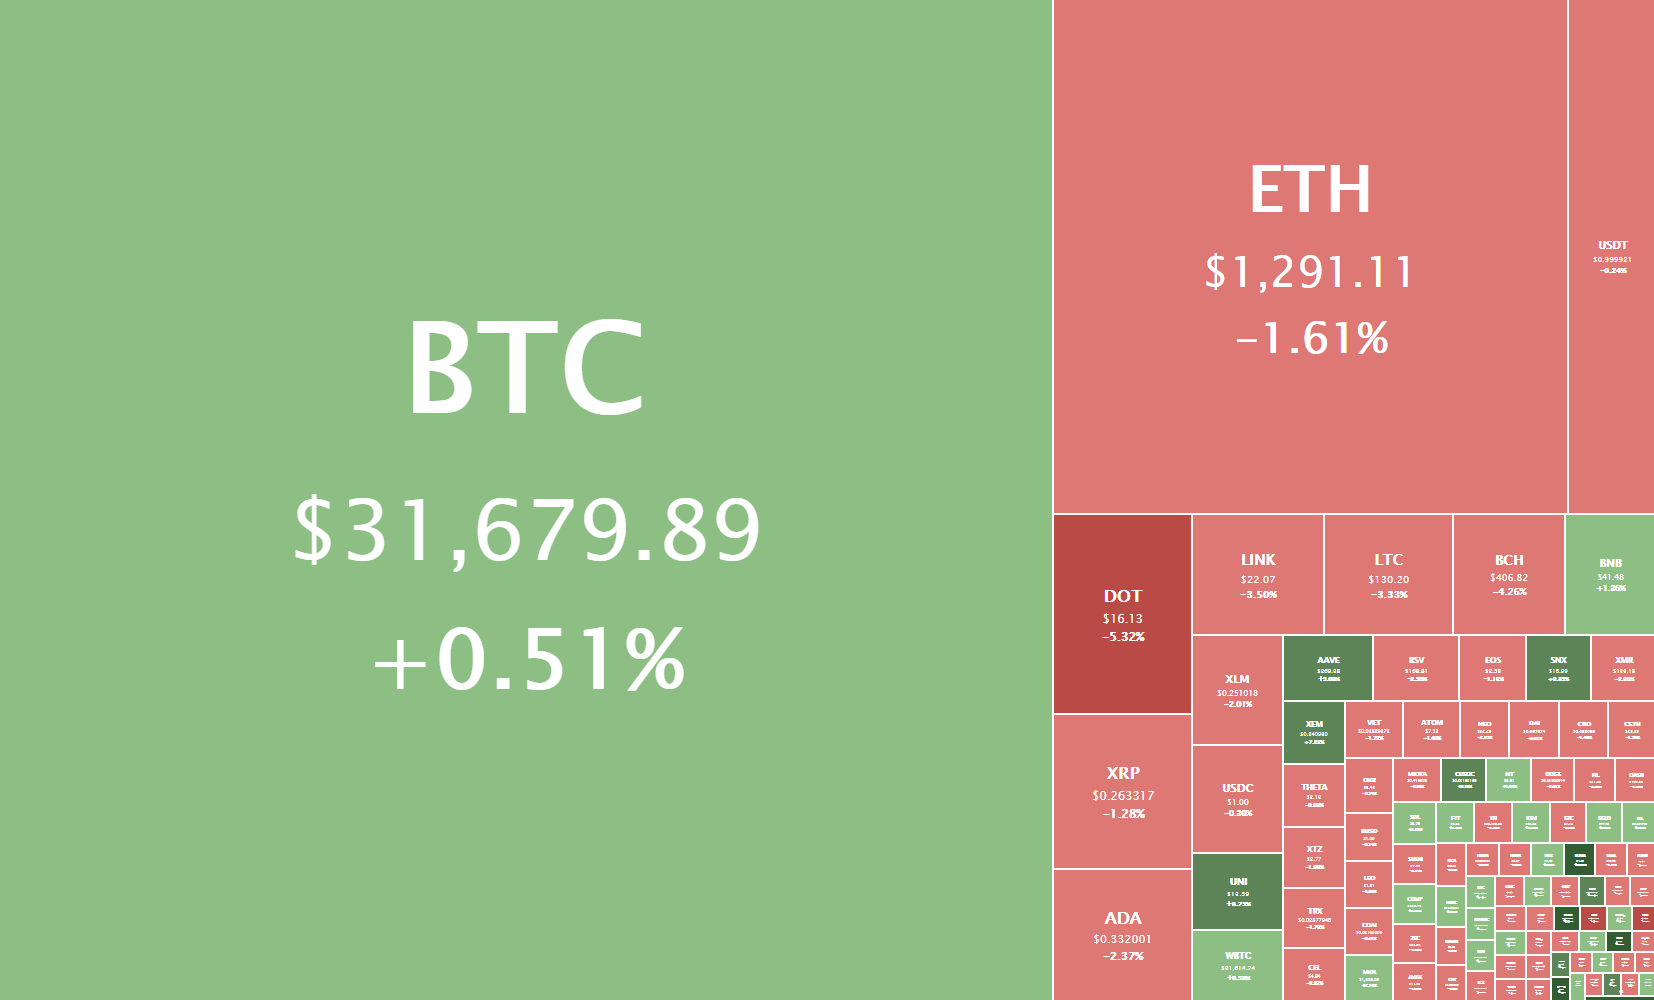
The crypto sector ended up either slightly red or slightly green, with only rare exceptions making significant moves to either side. Bitcoin is currently trading for $31,679, representing an increase of 0.51% compared to yesterday’s value. Meanwhile, Ethereum’s price has decreased by 1.61% on the day, while LTC lost 3.33% of its value.

Daily Crypto Sector Heat Map

Coupon Chain gained 74575.19% in the past 24 hours, making it the most prominent daily crypto gainer by far. It is followed by YVS.Finance’s 683.5% and Chonk’s 198.23% gain. On the other hand, Narwhale.finance lost 72.98%, making it the most prominent daily loser. It is followed by 3X Short Matic Token’s loss of 67.68% and MangoChain’s loss of 66.24%.

Top 10 24-hour Performers (Click to enlarge)

Bottom 10 24-hour Performers (Click to enlarge)

Bitcoin’s market dominance increased slightly from when we last reported, currently 63.1%. This represents a 0.2% increase from our previous report.

Weekly Crypto Market Cap Chart

The cryptocurrency sector’s market capitalization has decreased very slightly since we last reported, with its current value being $935.58 billion. This represents a $0.96 billion decrease when compared to our previous report.

_______________________________________________________________________

What happened in the past 24 hours?

_______________________________________________________________________

_______________________________________________________________________

Technical analysis

_______________________________________________________________________

Bitcoin

After a day of attempting to break out of its slightly descending channel, Bitcoin has returned to the downtrend. The largest cryptocurrency by market cap tried to regain the $32,350 level but failed in doing so. This created a strong sell-wall above its current price of just below $32,000.

Bitcoin’s immediate upside is guarded by the 21-hour and 50-hour EMAs, as well as the 32,350 level. Its downside, however, is a free-fall until the zone above $30,000.

BTC/USD 1-hour chart

Bitcoin’s daily overview is mostly neutral (with some hints of bearishness), while its weekly and monthly overviews are slightly bullish. On the other hand, its 4-hour time-frame is completely bearish.

BTC/USD 1-day Technicals

Technical factors (1-hour Chart):

  • Price is slightly below its 50-period EMA and its 21-period EMA
  • Price is slightly under its middle Bollinger band
  • RSI is neutral (46.41)
  • Volume is average

Key levels to the upside:          Key levels to the downside:

1: $32,350                             1: $30,072

2: $34,627                             2: $30,000

3: $37,445                             3: $27,960

Ethereum

The second-largest cryptocurrency by market cap returned to mirroring Bitcoin’s movement after entering its consolidation phase. Ethereum has, after failing to break the $1,350 level, returned to its slightly-downwards movement. The zone just above the $1,300 level mentioned yesterday was also broken, meaning that ETH is now trading between $1,211 to the downside and $1,350 to the upside.

Ethereum’s immediate upside is guarded by the 21-hour and 50-hour EMAs, as well as the $1,350 level. Its first major support level is sitting at $1,211.

ETH/USD 1-hour Chart

Ethereum’s technicals on the daily, weekly, and monthly time-frames are tilted towards the buy-side, but all have neutral oscillators. Its 4-hour overview, however, is completely neutral.

ETH/USD 1-day Technicals

Technical Factors (1-hour Chart):

  • Price is slightly below both its 50-period and its 21-period EMA
  • Price slightly below its middle Bollinger band
  • RSI is neutral (46.02)
  • Volume is average

Key levels to the upside:          Key levels to the downside:

1: $1,350                               1: $1,211

2: $1,420                               2: $1,183.85

3: $1,440                               3: $1047.6

Litecoin

Litecoin has seemingly created a double bottom formation after hitting and staying above the $128.4 level twice. This may be a bullish signal for LTC traders, but the move needs to be accompanied by at least a slight increase in volume.

Despite creating a double bottom, LTC will have a hard time moving past the 21-hour and 50-hour EMAs, as they seem to be its immediate resistance levels. On the other hand, its $128.4 support level is holding up well for now, making it very uncertain where LTC will go in the short-term.

LTC/USD 1-hour Chart

Litecoin’s daily overview is mostly neutral (with some hints of bearishness), while its weekly and monthly overviews are slightly bullish. On the other hand, its 4-hour time-frame is completely bearish.

LTC/USD 1-day Technicals

Technical factors (1-hour Chart):

  • Its price is below both its 50-period EMA and its 21-period EMA
  • Price slightly below its middle Bollinger band
  • RSI is neutral (41.89)
  • Volume is slightly below average

Key levels to the upside:          Key levels to the downside:

1: $142.1                               1: $128.42

2: $161.5                               2: $120

3: $181.3                               3: $114.75
Categories
Crypto Market Analysis

Daily Crypto Review, Jan 26 – Blood on the Streets: Crypto Market in the Red

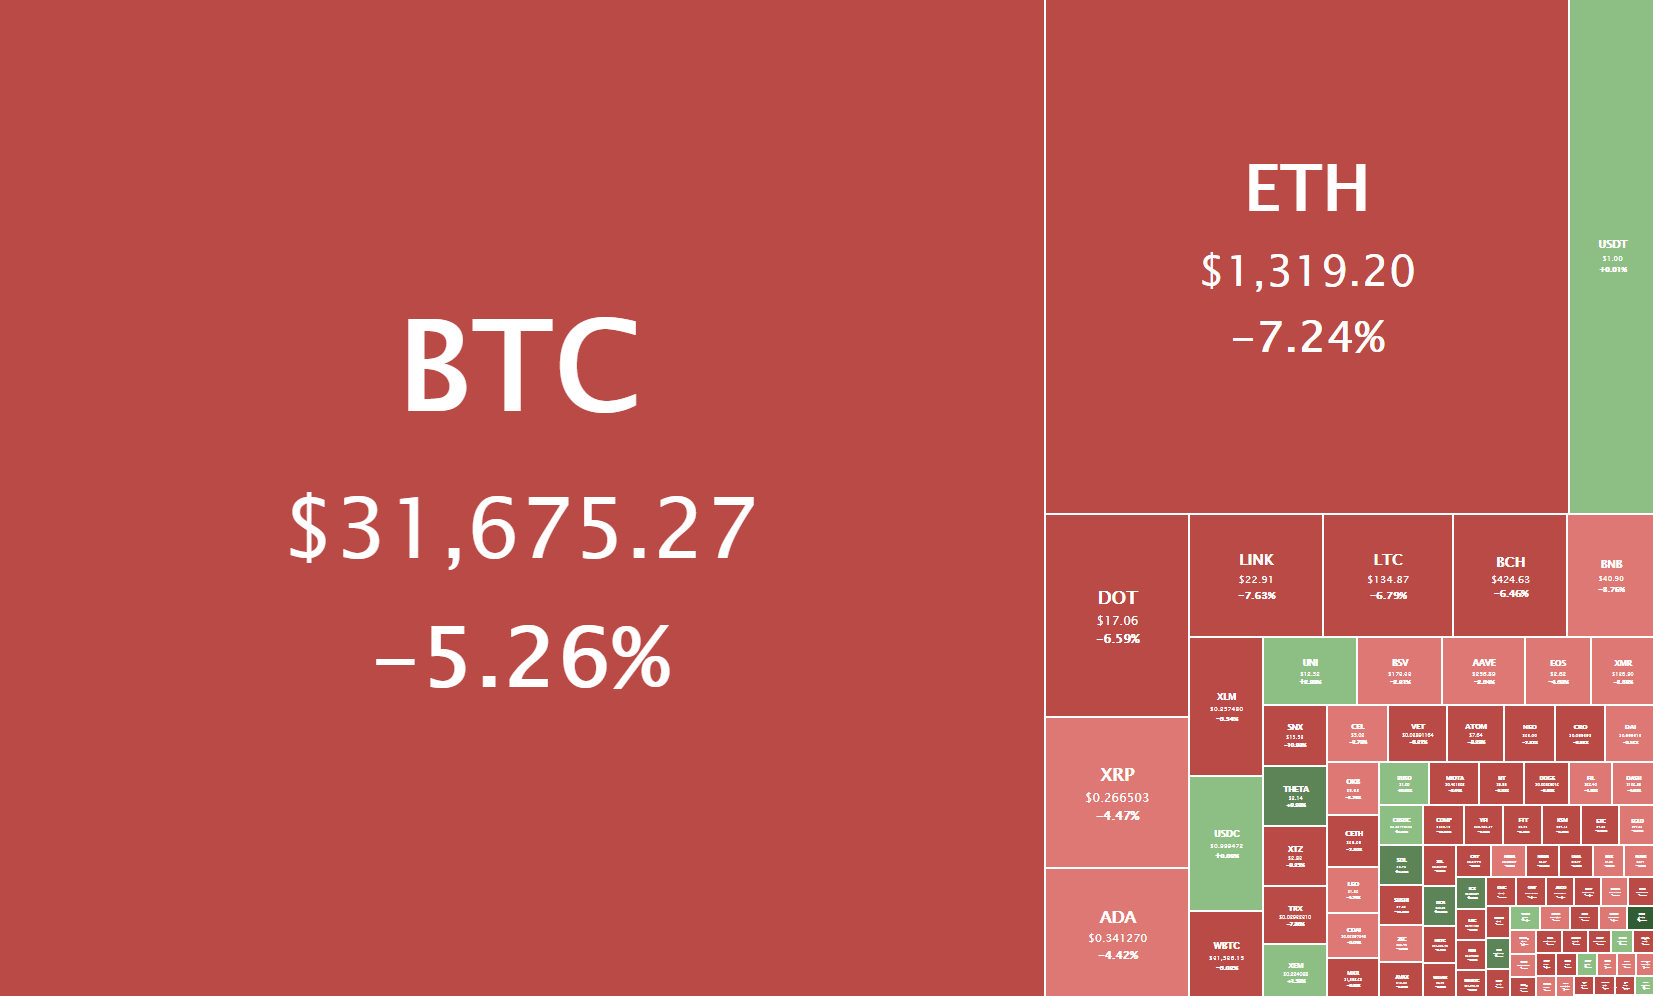
The crypto sector ended up almost completely in the red as most cryptocurrencies pulled back to lower levels. Bitcoin is currently trading for $31,575, representing a decrease of 5.26% compared to yesterday’s value. Meanwhile, Ethereum’s price has decreased by 7.24% on the day, while LTC lost 6.79% of its value.

Daily Crypto Sector Heat Map

EveryCoin gained 501.69% in the past 24 hours, making it the most prominent daily crypto gainer by far. It is followed by BBYS’s 280.04% and X Infinity’s 255.24% gain. On the other hand, ARTH lost 61.58%, making it the most prominent daily loser. It is followed by Typhoon Cash’s loss of 44.07% and Aventus’s loss of 40.31%.

Top 10 24-hour Performers (Click to enlarge)

Bottom 10 24-hour Performers (Click to enlarge)

Bitcoin’s market dominance increased slightly from when we last reported, with its value currently being 62.9%. This represents a 0.2% increase from our previous report.

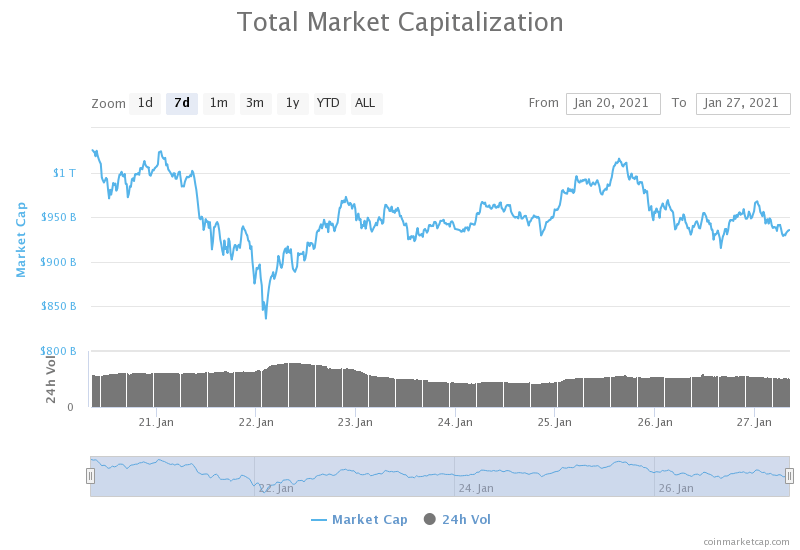
Weekly Crypto Market Cap Chart

The cryptocurrency sector’s market capitalization has decreased greatly since we last reported, with its current value being $936.54 billion. This represents a $54.92billion decrease when compared to our previous report.

_______________________________________________________________________

What happened in the past 24 hours?

_______________________________________________________________________

_______________________________________________________________________

Technical analysis

_______________________________________________________________________

Bitcoin

Bitcoin’s gains in the past two days were taken away when bears took over the market after BTC failed to break the $34,627 mark. The cryptocurrency declined to the $32,350 level but quickly lost hold of it as well. BTC is currently hovering right above the $31,000 mark.

Bitcoin’s 1-hour RSI is getting dangerously close to the oversold territory, while its volume is descending, indicating a possible price stagnation or a direction reversal.

BTC/USD 1-hour chart

Bitcoin’s daily overview is completely neutral, while its weekly and monthly overviews are completely bullish. On the other hand, the 4-hour time-frame is completely bearish.

BTC/USD 1-day Technicals

Technical factors (1-hour Chart):

  • Price is below its 50-period EMA and its 21-period EMA
  • Price is close to its bottom Bollinger band
  • RSI is near the oversold area (31.21)
  • Volume is average

Key levels to the upside:          Key levels to the downside:

1: $32,350                             1: $30,072

2: $34,627                             2: $30,000

3: $37,445                             3: $27,960

Ethereum

The second-largest cryptocurrency by market cap spent the day retracing after posting a new all-time high at $1,477.30. ETH tested many levels but ultimately fell below the previous all-time high, and then the $1,420 and $1,350 levels as well. It is currently consolidating just above $1,300.

Ethereum seemingly created a zone of support just above the $1,300 level, which is holding up for 10 hours now. If this support holds long enough for BTC to change its price direction (or at least enter a sideways trading period), we may see ETH bulls reentering the market once again.

ETH/USD 1-hour Chart

Ethereum’s technicals on all time-frames are slightly tilted towards the buy-side, with its oscillators taking a more neutral stance.

ETH/USD 1-day Technicals

Technical Factors (1-hour Chart):

  • Price is below both its 50-period and its 21-period EMA
  • Price near its bottom Bollinger band
  • RSI is very close to being oversold (39.73)
  • Volume is average

Key levels to the upside:          Key levels to the downside:

1: $1,350                               1: $1,211

2: $1,420                               2: $1,183.85

3: $1,440                               3: $1047.6

Litecoin

Litecoin has lost all of the gains it made yesterday, and then some. The eighth-largest cryptocurrency by market cap failed to pass the zone just under $150, which triggered a pullback and a dip below the $142.1 support (now resistance) level. On top of that, LTC also fell below the trading range it was in for the previous four days (excluding yesterday’s push).

LTC/USD 1-hour Chart

Litecoin’s short-term and long-term overviews have opposing stances: while its 4-hour and overviews show a slight tilt towards the sell-side, its weekly and monthly overviews are slightly bullish.

LTC/USD 1-day Technicals

Technical factors (1-hour Chart):

  • Its price is below its 50-period EMA and its 21-period EMA
  • Price slightly above its bottom Bollinger band
  • RSI is close to being in the oversold territory (33.05)
  • Volume is average

Key levels to the upside:          Key levels to the downside:

1: $142.1                               1: $128.42

2: $161.5                               2: $120

3: $181.3                               3: $114.75
Categories
Crypto Market Analysis

Daily Crypto Review, Jan 25 – Ethereum Reaches a new All-Time High: What’s Next?

The crypto sector ended up mostly in the green as altcoins pushed up (while Bitcoin remained mostly stable). Several cryptocurrencies reached new all-time highs, including Ethereum and Aave. Bitcoin is currently trading for $33,335, representing an increase of 1/59% compared to yesterday’s value. Meanwhile, Ethereum’s price has increased by 7.93% on the day, while LTC gained 2.12% of its value.

Daily Crypto Sector Heat Map

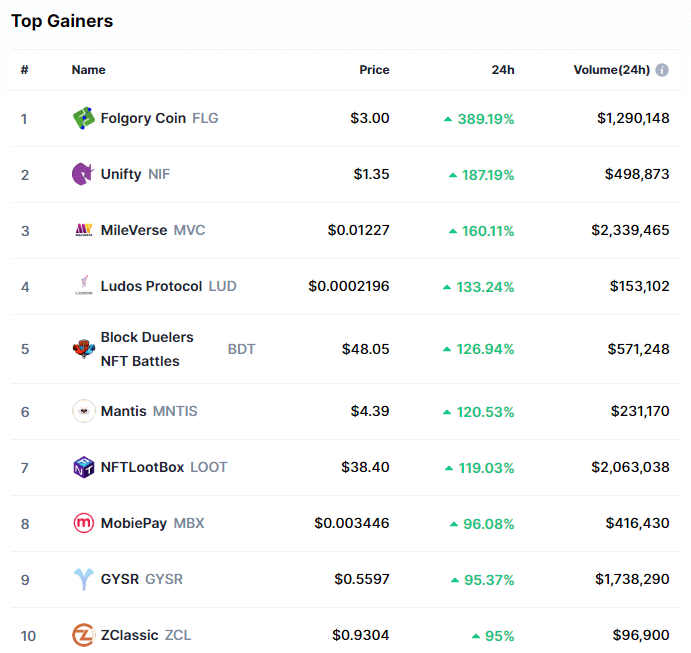
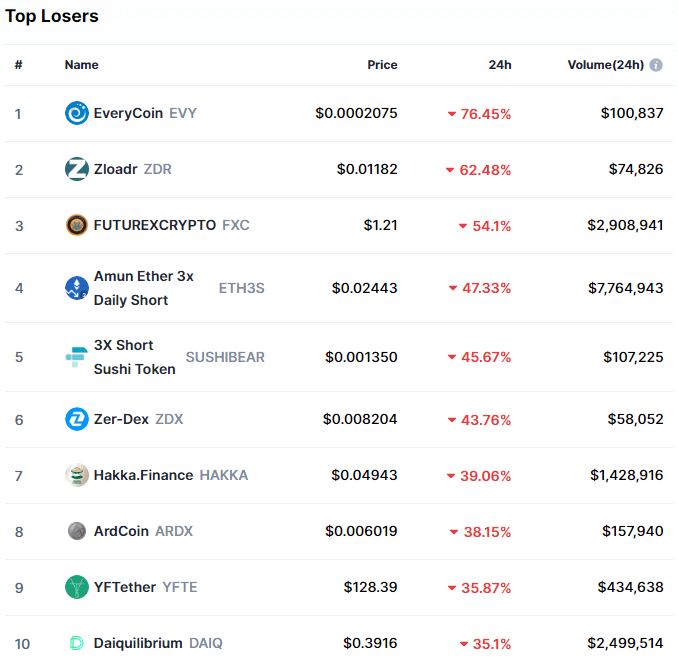
Foglory Coin gained 389.19% in the past 24 hours, making it the most prominent daily crypto gainer by far. It is followed by Unifty’s 187.19% and MileVerse’s 160.11% gain. On the other hand, EveryCoin lost 76.45%, making it the most prominent daily loser. It is followed by Zloadr’s loss of 62.48% and FUTUREXCRYPTO’s loss of 54.1%.

Top 10 24-hour Performers (Click to enlarge)

Bottom 10 24-hour Performers (Click to enlarge)

Bitcoin’s market dominance dropped further from when we last reported, with its value currently being 62.7%. This represents a 2.1% decrease from our previous report.

Weekly Crypto Market Cap Chart

The cryptocurrency sector’s market capitalization has increased greatly since we last reported, with its current value being $991.66 14.56 billion. This represents a $77.10 billion increase when compared to our previous report.

_______________________________________________________________________

What happened in the past 24 hours?

_______________________________________________________________________

_______________________________________________________________________

Technical analysis

_______________________________________________________________________

Bitcoin

Bitcoin has spent the weekend with its price slowly descending towards the $30,000 mark until a new surge of buyers changed the price direction. BTC has bounced from the $30,900 level and pushed up past the $33,250 level. Its price is currently consolidating in the $33,400 zone.

Bitcoin’s upside is guarded not only by the $34,627 level but the recent high of $33,865. Traders will have to be careful when taking long positions on BTC and will have to devote most of the time checking the order flow to properly gauge the resistance levels.

BTC/USD 1-hour chart

Bitcoin’s 4-hour and weekly overviews are bullish and show some signs of neutrality or bearishness, while its monthly overview is completely bullish. On the other hand, its daily time-frame is pretty neutral.

BTC/USD 1-day Technicals

Technical factors (1-hour Chart):

  • Price is slightly above its 50-period EMA and its 21-period EMA
  • Price is close to its top Bollinger band
  • RSI is near the overbought area (64.47)
  • Volume is slightly below average

Key levels to the upside:          Key levels to the downside:

1: $34,627                             1: $32,350

2: $37,445                             2: $30,072

3: $38,000                             3: $27,960

Ethereum

The second-largest cryptocurrency by market cap “decoupled” from Bitcoin and pushed up, surging to its all-time highs and briefly creating a new one at $1,477.3. Ether is currently fighting to stay above $140 and enter the price discovery mode yet again.

Ethereum has quite a lot of support levels right beneath its current price, most notably the $1,440, $1,420, and $1,350 levels. Its upside levels past the all-time high will, however, have to be determined by drawing Fib retracement levels.

ETH/USD 1-hour Chart

Ethereum’s technicals on the 4-hour, daily, and weekly time-frames are bullish and show some signs of neutrality or bearishness, while its monthly overview is completely bullish.

ETH/USD 1-day Technicals

Technical Factors (1-hour Chart):

  • Price is above both its 50-period and its 21-period EMA
  • Price near its top Bollinger band
  • RSI is very close to being overbought (68.27)
  • Volume is above average

Key levels to the upside:          Key levels to the downside:

1: $1,440                               1: $1,420

2: $1,477.3                            2: $1,350

3: $1,500                               3: $1,211

Litecoin

Litecoin’s weekend went without much price fluctuation, with LTC moving between $133 and $143.5. However, LTC bulls managed to push past the $142.1 level and bring its price to $145, where it is now consolidating. Litecoin’s volume also surged during the price increase.

Litecoin traders will have to pay attention to several factors, including LTC technicals, Bitcoin price movement as well as Ethereum price movement.

LTC/USD 1-hour Chart

Litecoin’s overviews on all time-frames are bullish, with its 4-hour, daily, and weekly time-frames having some signs of neutrality, while its monthly overview is completely bullish.

LTC/USD 1-day Technicals

Technical factors (1-hour Chart):

  • Its price is slightly above its 50-period EMA and its 21-period EMA
  • Price slightly above its middle Bollinger band
  • RSI is neutral (63.36)
  • Volume is slightly above average

Key levels to the upside:          Key levels to the downside:

1: $161.5                               1: $142.1

2: $181.3                               2: $128.42

3: $186.3                               3: $120

Categories
Crypto Market Analysis

Daily Crypto Review, Jan 22 – Bitcoin Briefly Drops Below $30K; Market Sees Blood on the Streets

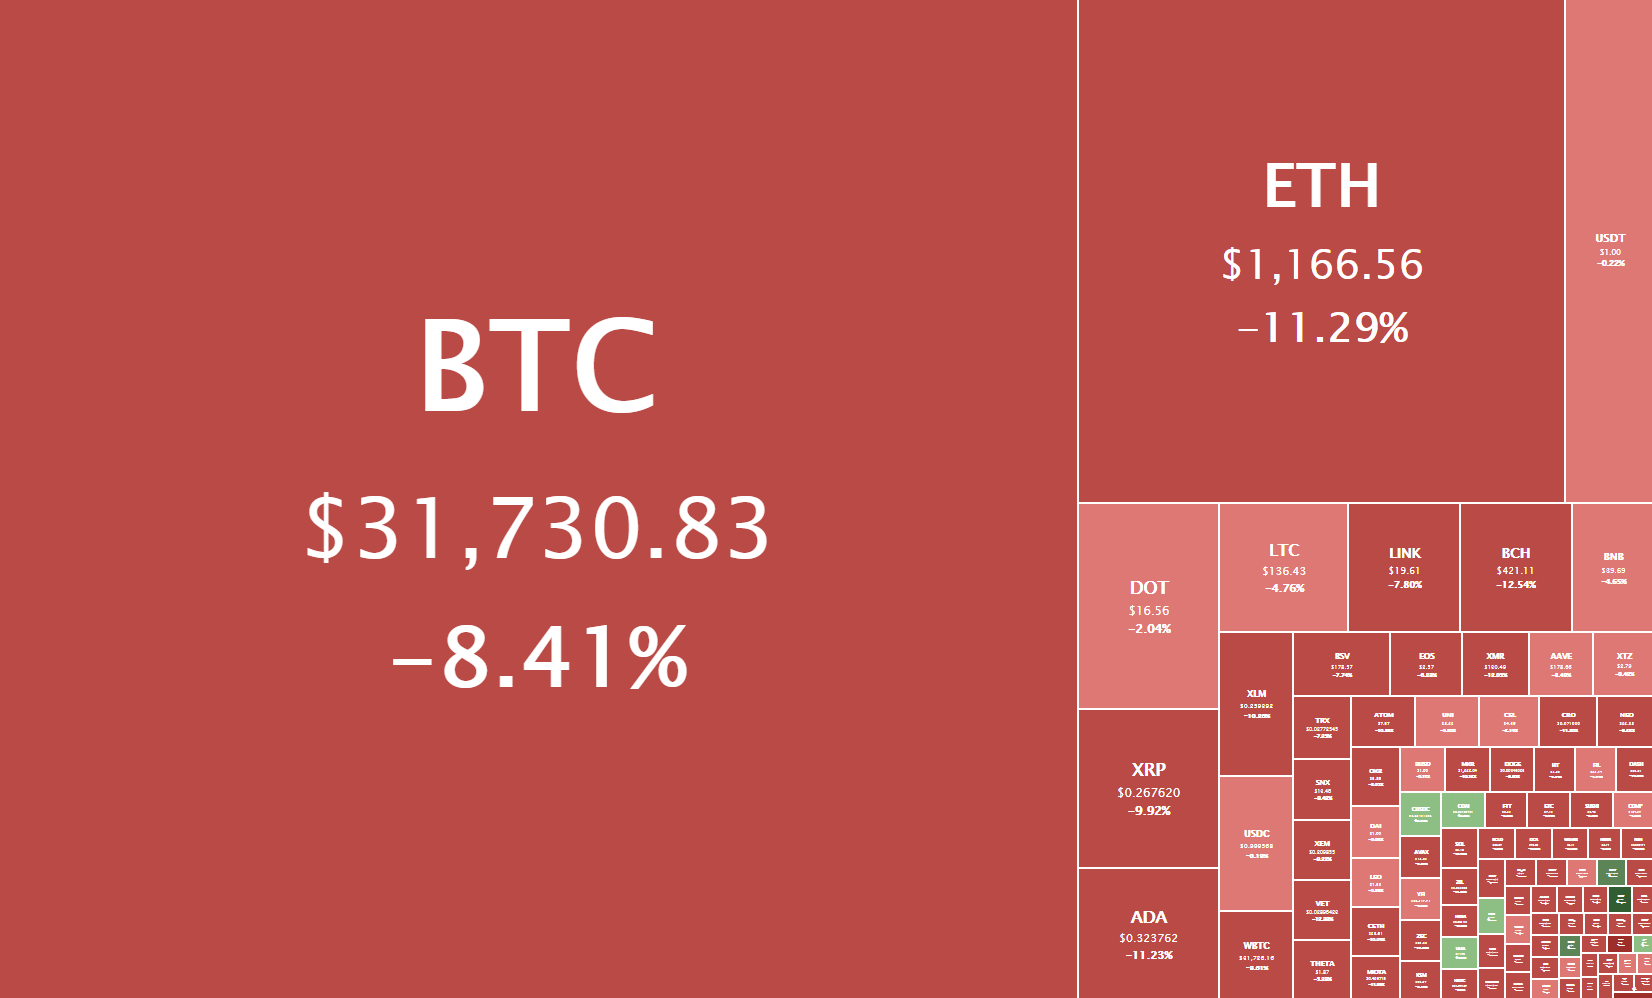
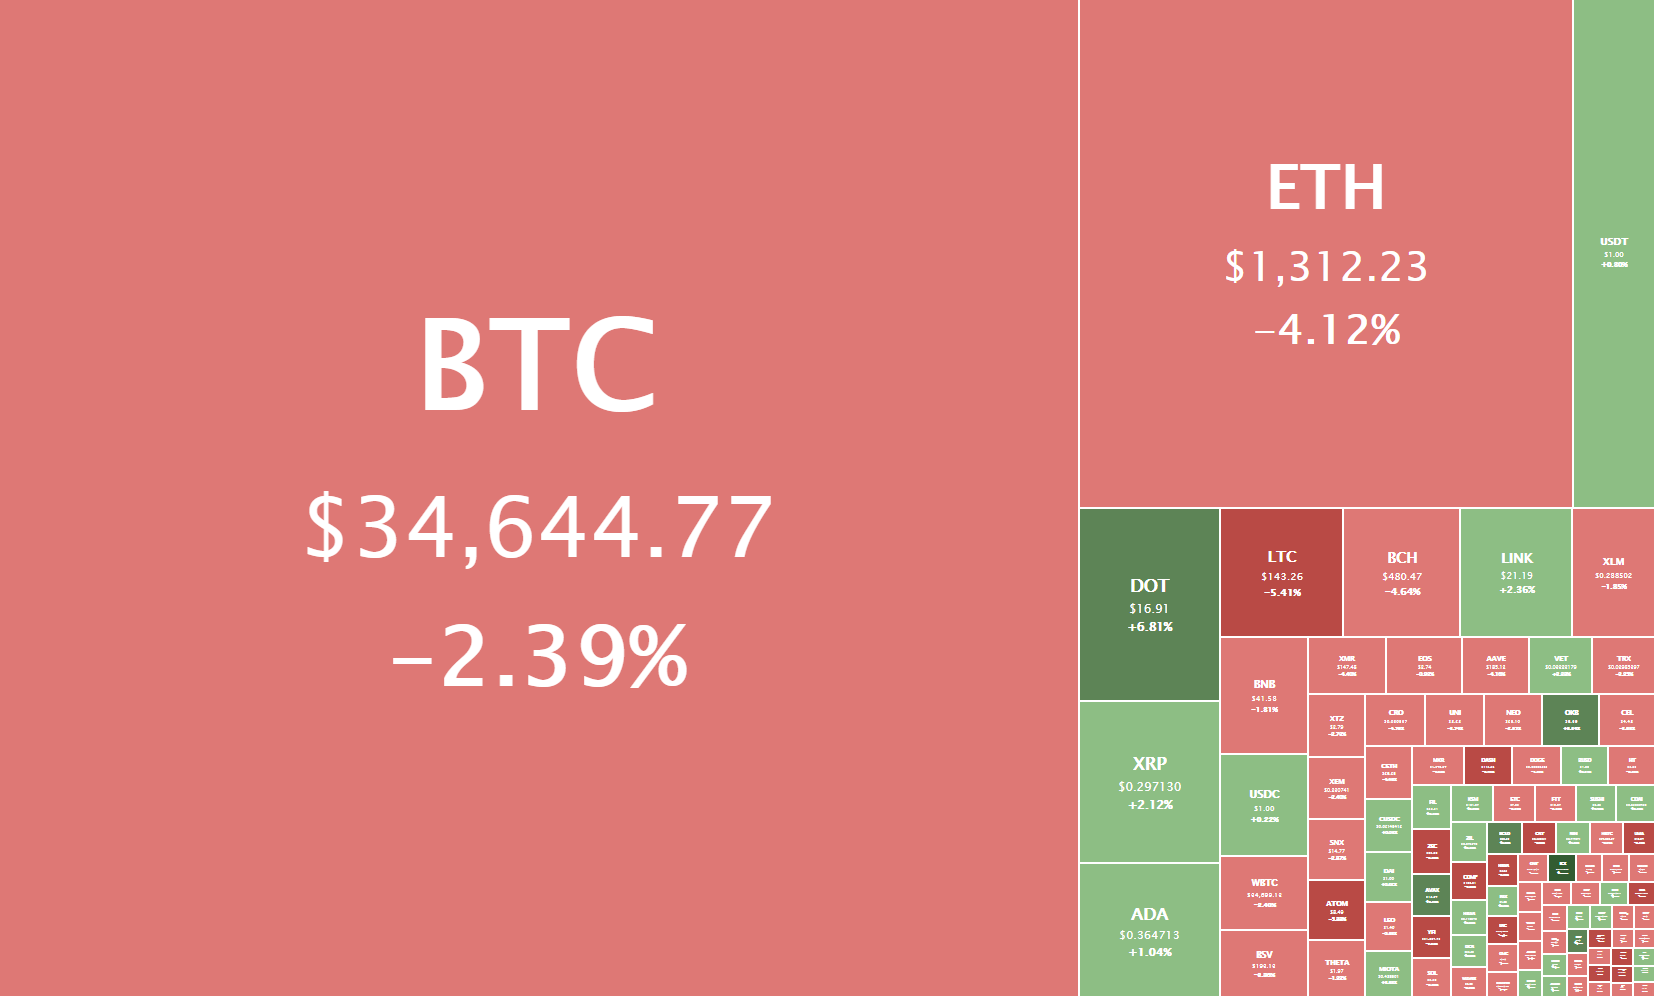
The crypto sector ended up almost completely in the red as Bitcoin’s drop below $30,000 (at one point) led the market down. Bitcoin is currently trading for $31,730, representing a decrease of 8.41% compared to yesterday’s value. Meanwhile, Ethereum’s price has decreased by 11.29% on the day, while LTC lost 4.76% of its value.

Daily Crypto Sector Heat Map

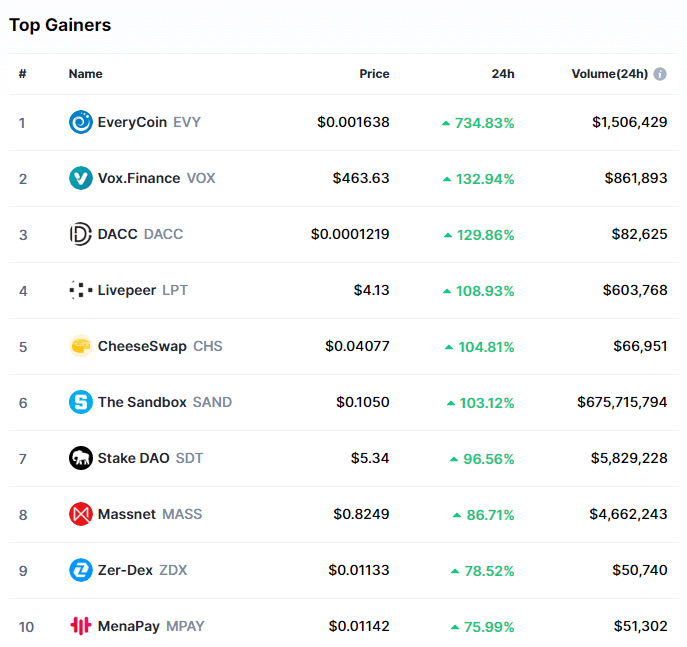
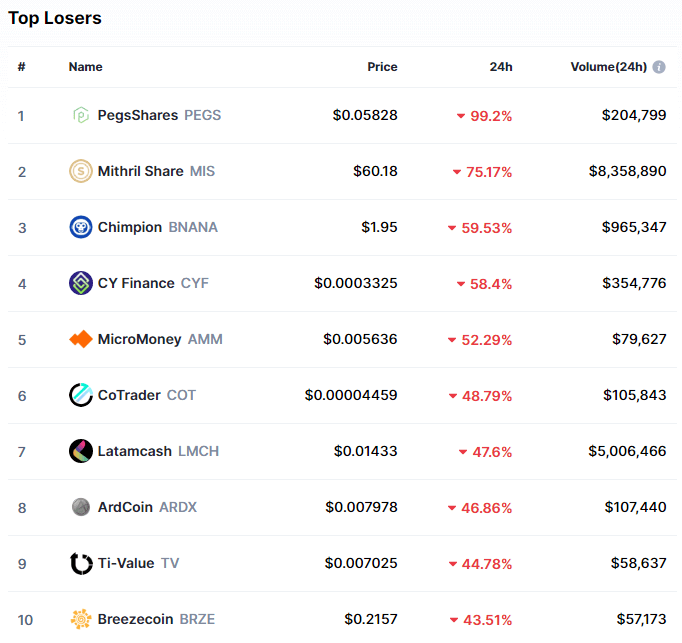
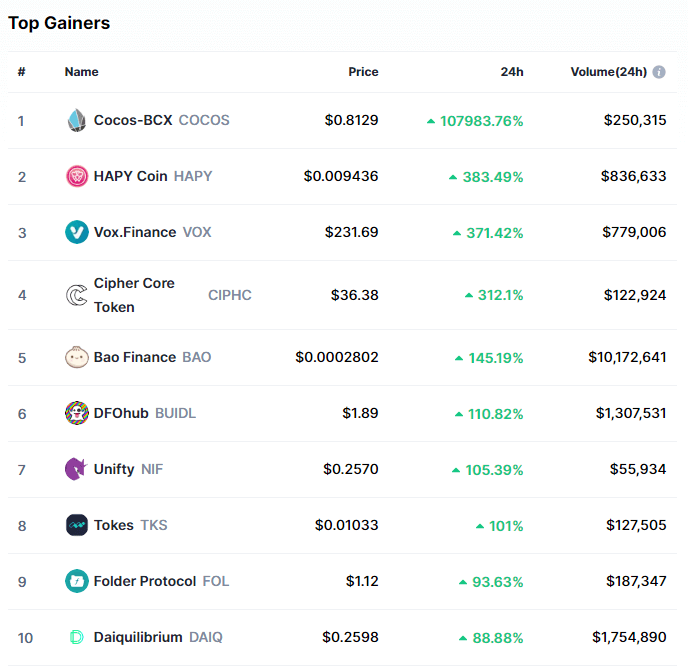
EveryCoin gained 734.83% in the past 24 hours, making it the most prominent daily crypto gainer by far. It is followed by Vox.Finance’s 132.94% and DACC’s 129.86% gain. On the other hand, PegsShares lost 99.20%, making it the most prominent daily loser. It is followed by Mithril Share’s loss of 75.17% and Chimpion’s loss of 59.53%.

Top 10 24-hour Performers (Click to enlarge)

Bottom 10 24-hour Performers (Click to enlarge)

Bitcoin’s market dominance stayed at the same spot as when we last reported, with its value currently being 64.8%.

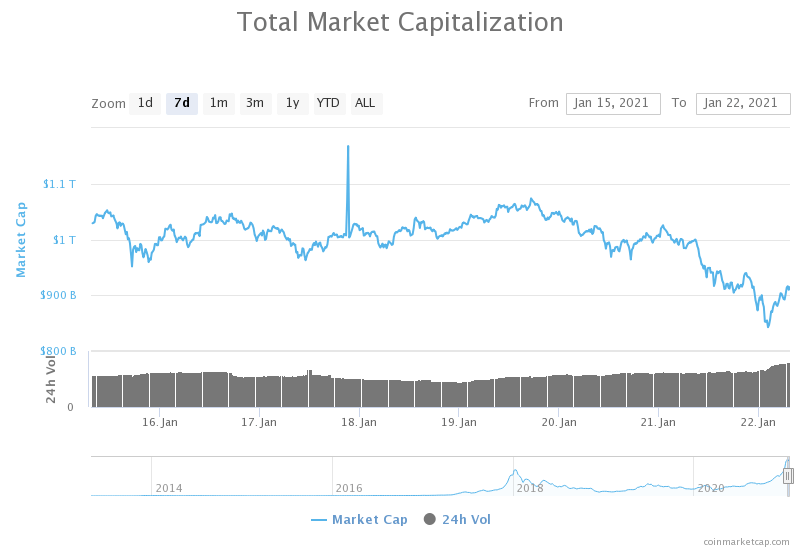
Weekly Crypto Market Cap Chart

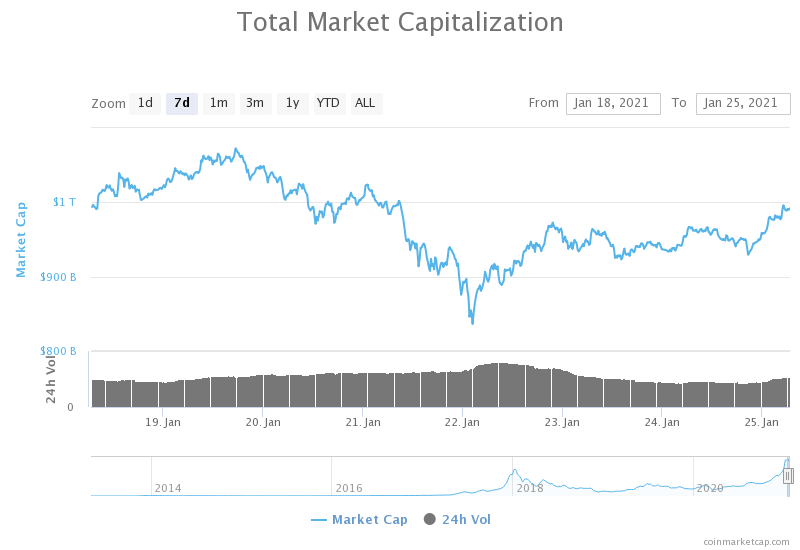
The cryptocurrency sector’s market capitalization has decreased greatly since we last reported, with its current value being $914.56 billion. This represents a $10.97 billion decrease when compared to our previous report.

_______________________________________________________________________

What happened in the past 24 hours?

_______________________________________________________________________

_______________________________________________________________________

Technical analysis

_______________________________________________________________________

Bitcoin

Bitcoin has had a horrible day as bears took over the market. Its price dropped to as low as $28,800, but found support in its 50-day EMA. The downturn, however, means that the largest-cryptocurrency by market cap fell out of its triangle formation, most likely spelling a start of a short-term downtrend or sideways trading phase.

Bitcoin is very unpredictable at the moment, but traders could find an opportunity in looking for drastic volume increases and “catch the wave” of buyers or sellers (while taking into account all the support and resistance levels).

BTC/USD 1-hour chart

Bitcoin’s weekly and monthly time-frames are bullish but show some signs of neutrality or bearishness. On the other hand, its 4-hour and daily time-frames are completely bearish.

BTC/USD 1-day Technicals

Technical factors (1-hour Chart):

  • Price is slightly below its 50-period EMA and at its 21-period EMA
  • Price is at its middle Bollinger band
  • RSI is neutral after returning from being oversold (48.04)
  • Volume is above average

Key levels to the upside:          Key levels to the downside:

1: $32,350                             1: $30,072

2: $34,627                             2: $30,000

3: $37,445                             3: $27,960

Ethereum

The second-largest cryptocurrency by market cap followed Bitcoin’s direction, but with slightly less intensity. Ether’s price dropped below the $1,211 and $1,183.85 levels and found support in the $1,047.6 level. However, the bounce that came after the bulls came into the market was insufficient to break the $1,183.85 level, and Ethereum’s price is now trading just below it.

The $1,183.85 level could be considered a pivot point, and ETH’s short-term price direction will greatly depend on whether bulls manage to break this resistance.

ETH/USD 1-hour Chart

Ethereum’s technicals are still mostly tilted towards the buy-side, with its longer time-frames (weekly and monthly) being completely bullish, while its daily time frame’s oscillators are pointing to the sell-side. On the other hand, its 4-hour time-frame is completely bearish.

ETH/USD 1-day Technicals

Technical Factors (1-hour Chart):

  • Price is below its 50-period and at its 21-period EMA
  • Price is at its middle Bollinger band
  • RSI is neutral (45.02)
  • Volume is above average

Key levels to the upside:          Key levels to the downside:

1: $1,183.85                          1: $1047.5

2: $1,211                              2: $960.5

3: $1,350                             3: $932.5

Litecoin

Litecoin’s movement in the past 24 hours much resembled Ethereum, with its price dropping below the $142.1 level and finding support slightly below the $128.4 level. While its push up did not reach the now-resistance level of $142.1, Litcoin did find support in the 21-hour EMA.

Litecoin’s volume increase in recent hours is negligible compared to the increase that Bitcoin and Ethereum saw. This may indicate less intensity in the moves to come, regardless of the price direction.

LTC/USD 1-hour Chart

Litecoin’s weekly and monthly time-frames are completely bullish and but show no signs of neutrality or bearishness. On the other hand, its 4-hour and daily time-frames are completely bearish.

LTC/USD 1-day Technicals

Technical factors (1-hour Chart):

  • Its price is slightly below its 50-period EMA and slightly above its 21-period EMA
  • Price slightly above its middle Bollinger band
  • RSI is neutral (51.31)
  • Volume is slightly above average

Key levels to the upside:          Key levels to the downside:

1: $142.1                               1: $128.42

2: $161.5                               2: $120

3: $181.3                               3: $114.75
Categories
Crypto Market Analysis

Daily Crypto Review, Jan 21 – BTC in a Triangle Formation – What do the Analysts Say?

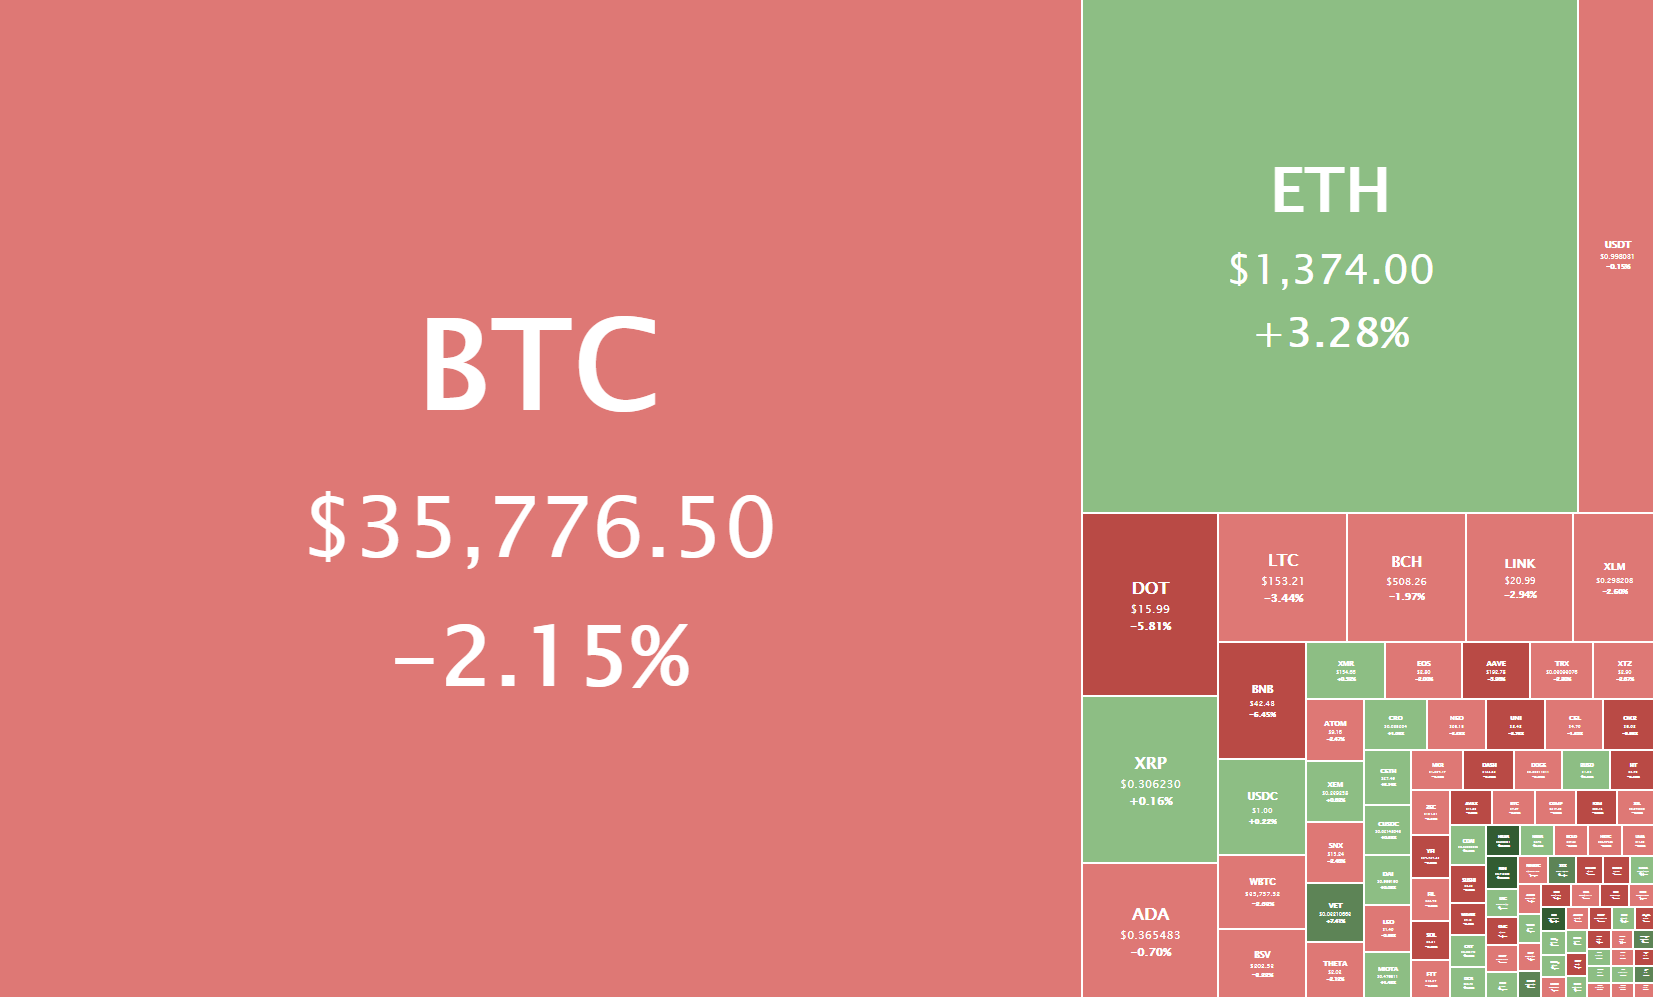
The crypto sector was split between slight gainers and slight losers, but overall lost some value as the market cap dropped below $1 trillion. Bitcoin is currently trading for $34,644, representing a decrease of 2.39% compared to yesterday’s value. Meanwhile, Ethereum’s price has decreased by 4.12% on the day, while LTC lost 5.41% of its value.

Daily Crypto Sector Heat Map

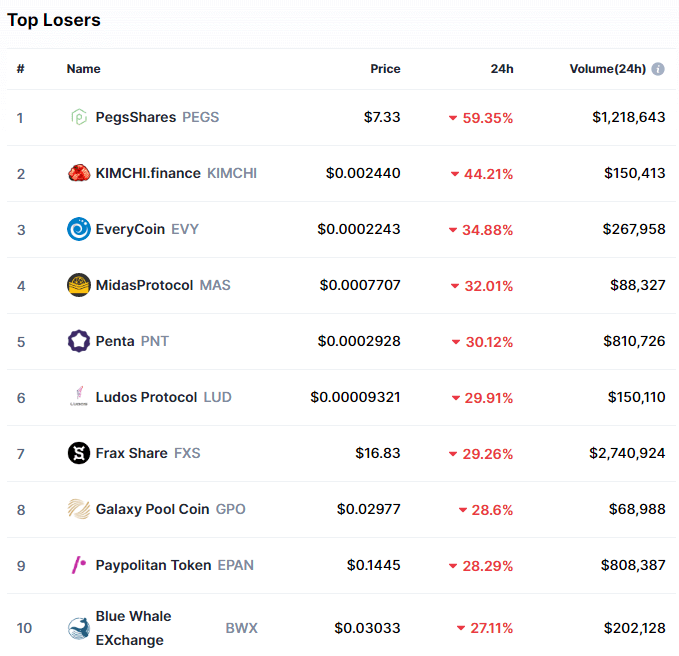
Cocos-BCX gained 107983.76% in the past 24 hours, making it the most prominent daily crypto gainer by far. It is followed by HAPY Coin’s 383.49% and Vox.Finance’s 371.42% gain. On the other hand, PegsShares lost 59.35%, making it the most prominent daily loser. It is followed by KIMCHI.finance’s loss of 44.21% and EveryCoin’s loss of 34.88%.

Top 10 24-hour Performers (Click to enlarge)

Bottom 10 24-hour Performers (Click to enlarge)

Bitcoin’s market dominance has moved down slightly since our last report as altcoins started to outperform, with its value currently being 64.8%. This value represents a 0.1% difference to the downside when compared to the previously reported value.

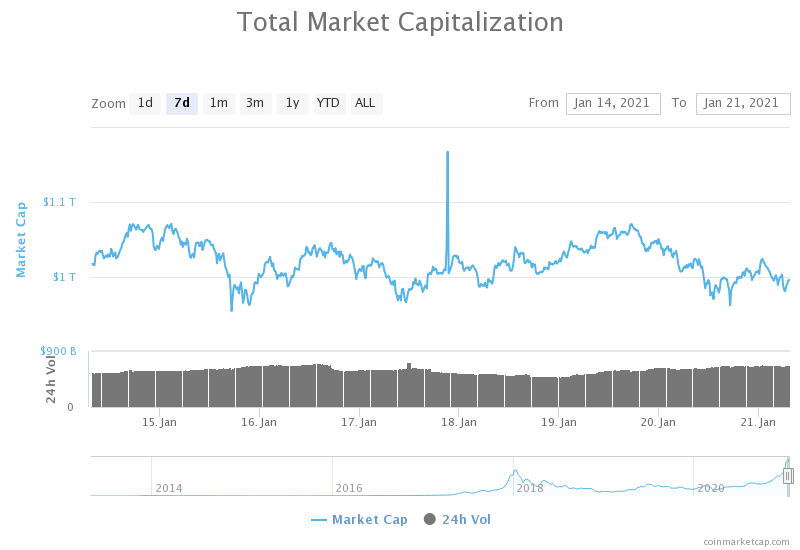
Weekly Crypto Market Cap Chart

The cryptocurrency sector’s market capitalization has decreased slightly since we last reported, with its current value being $955.53 billion. This represents a $69 billion decrease when compared to our previous report.

_______________________________________________________________________

What happened in the past 24 hours?

_______________________________________________________________________

_______________________________________________________________________

Technical analysis

_______________________________________________________________________

Bitcoin

Bitcoin’s daily time-frame shows that the cryptocurrency is still contained within the triangle formation, which will be a major determinant in BTC’s future price movement. If we zoom in to the hourly time-frame, we can see that BTC moved down, broke the $34,627, and pushed towards the downside, but got instantly stopped by the triangle formation’s bottom line.

While Bitcoin’s short-term overview seems slightly bearish, many analysts call for a push towards $60,000 before any major pullback. However, judging by the current trading session, BTC has a higher chance of breaking the triangle formation to the downside at the moment.

BTC/USD 1-hour chart

Bitcoin’s weekly and monthly time-frames are completely bullish and show no signs of bearishness. On the other hand, its daily time-frame oscillators point to “sell” while the rest of the overview is still bullish, and its 4-hour time-frame is completely bearish.

BTC/USD 1-day Technicals

Technical factors (1-hour Chart):

  • Price is slightly below both its 50-period EMA and its 21-period EMA
  • Price is slightly below its middle Bollinger band
  • RSI is neutral (44.21)
  • Volume is average (low)

Key levels to the upside:          Key levels to the downside:

1: $37,445                             1: $34,627

2: $40,000                             2: $32,350

3: $42,000                             3: $27,960

Ethereum

The second-largest cryptocurrency by market cap went into retracement mode after creating a new all-time high of $1,440 two days ago. Ether’s price moved in a straight descending pattern at first but then bounced back up and tried to retest the $1,350 level. As time passed, it was more and more evident that ETH failed to break $1,350 to the upside and that its price is now contained between $1,350 to the upside and $1,211 to the downside.

Ether’s current upside is heavily guarded, not only by the $1,350 level but also by the 21-hour and 50-hour EMAs.

ETH/USD 1-hour Chart

Ethereum’s technicals on all time-frames are bullish, but only its daily time-frame shows no signs of neutrality or bearishness. The rest of the time-frames (4-hour, weekly, and monthly) have their oscillators pointing to a neutral or bearish stance.

ETH/USD 1-day Technicals

Technical Factors (1-hour Chart):

  • Price is slightly below its 50-period and its 21-period EMA
  • Price is slightly below its middle Bollinger band
  • RSI is neutral (44.30)
  • Volume is average

Key levels to the upside:          Key levels to the downside:

1: $1,350                               1: $1,211

2: $1,420                               2: $1,183.85

3: $1,440                              3: $1047.5

Litecoin

Litecoin spent the day trading on very low volume compared to the previous days, with its price contesting the $142.1 level twice. At the moment, LTC traders can face two scenarios, one being LTC falling below $142.1 level and pushing towards $128.4, and the second one being that LTC acts on the double bottom it created and pushes up to regain some of the lost value.

LTC/USD 1-hour Chart

Litecoin’s technicals are pretty split, with its 4-hour and daily indicators showing almost complete bearish sentiment and its weekly and monthly overviews showing complete bullishness.

LTC/USD 1-day Technicals

Technical factors (1-hour Chart):

  • Its price is slightly below both its 50-period EMA and its 21-period EMA
  • Price between its middle and bottom Bollinger band
  • RSI is neutral (41.78)
  • Volume is below average

Key levels to the upside:          Key levels to the downside:

1: $161.5                               1: $142.1

2: $181.3                               2: $128.42

3: $186.3                               3: $114.75

Categories
Crypto Market Analysis

Daily Crypto Review, Jan 20 – ETH Reaches a New All-Time High; Crypto Sector in the Red

The crypto sector ended up mostly in the red as altcoins started retracing after their moves to the upside. Bitcoin is currently trading for $35,776, representing a decrease of 2.1% compared to yesterday’s value. Meanwhile, Ethereum’s price has increased by 3.28% on the day, while LTC lost 3.44% of its value.

Daily Crypto Sector Heat Map

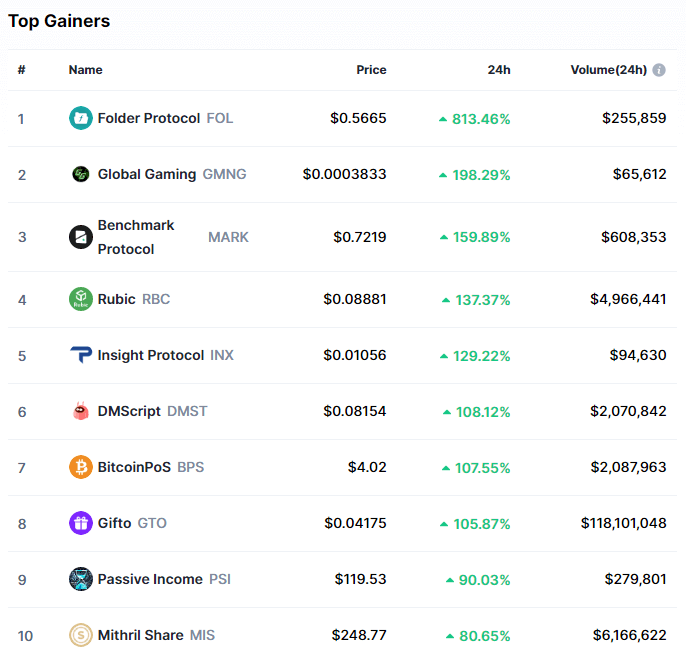
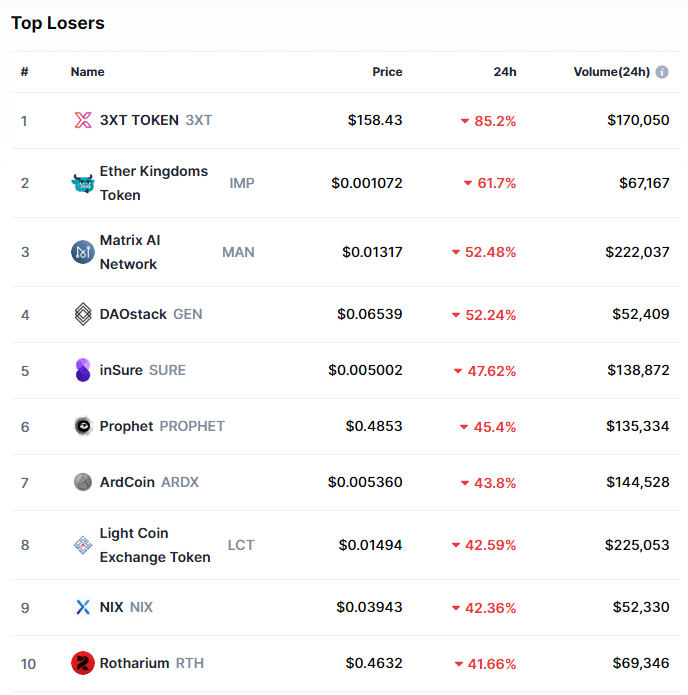
Folder Protocol gained 813.46% in the past 24 hours, making it the most prominent daily crypto gainer by far. It is followed by Global Gaming’s 198.29% and Benchmark Protocol’s 159.89% gain. On the other hand, 3XT TOKEN lost 85.20%, making it the most prominent daily loser. It is followed by Ether Kingdoms Token’s loss of 61.70% and Matrix AI Network’s loss of 52.48%.

Top 10 24-hour Performers (Click to enlarge)

Bottom 10 24-hour Performers (Click to enlarge)

Bitcoin’s market dominance has moved down since our last report as altcoins started to outperform, with its value currently being 64.9%. This value represents a 0.7% difference to the downside when compared to the previously reported value.

Weekly Crypto Market Cap Chart

The cryptocurrency sector’s market capitalization has decreased slightly since we last reported, with its current value being $1.024 trillion. This represents a $10 billion decrease when compared to our previous report.

_______________________________________________________________________

What happened in the past 24 hours?

_______________________________________________________________________

_______________________________________________________________________

Technical analysis

_______________________________________________________________________

Bitcoin

Bitcoin’s daily time-frame shows us that the largest cryptocurrency by market cap is still contained within the triangle formation (purple). Any break of the current sideways movement may contest the triangle as well. On the other hand, BTC on the 1-hour time-frame is bouncing between the $34,627 support and the $37,445 resistance level for the past five days.

Bitcoin’s price will soon have to break the sideways trading pattern and contest the triangle formation. If BTC bulls or bears manage to break the triangle formation, we could see a large move in the same direction.

BTC/USD 1-hour chart

Bitcoin’s short-term (4-hour and daily) technicals are slightly tilted towards the sell-side but still show a hint of neutrality or bullishness. Its weekly and monthly technicals are exactly the opposite, as they are slightly bullish but show some bearishness alongside it.

BTC/USD 1-day Technicals

Technical factors (1-hour Chart):

  • Price is slightly below both its 50-period EMA and its 21-period EMA
  • Price is slightly below its middle Bollinger band
  • RSI is neutral (44.32)
  • Volume is average (low)

Key levels to the upside:          Key levels to the downside:

1: $37,445                             1: $34,627

2: $40,000                             2: $32,350

3: $42,000                             3: $27,960

Ethereum

The second-largest cryptocurrency by market cap took advantage of the “altcoin season” as money moved from Bitcoin and onto other altcoins. Ever since Ether’s price bounced from the $1,211 level on Jan 18, we could see bulls coming to the market in larger numbers. This made the $1,350 level fall, and ETH finally set a new all-time high of $1,440. While the new ATH is just $20 away from its previous one, this is considered a testament to Ethereum’s upside potential.

Ether couldn’t position itself above the $1,420 (previous ATH) and fell below as it started retracing. Its price is now testing the $1,350 level but will most likely stay above it.


ETH/USD 1-hour Chart

Ethereum’s technicals on all time-frames are tilted towards the buy-side, but all show a hint of bearishness in the oscillator department.

ETH/USD 1-day Technicals

Technical Factors (1-hour Chart):

  • Price is above its 50-period and at its 21-period EMA
  • Price is slightly below its middle Bollinger band
  • RSI is neutral (50.69)
  • Volume is above average

Key levels to the upside:          Key levels to the downside:

1: $1,420                               1: $1,350

2: $1,440                               2: $1,211

3: $1,450                               3: $1,183.85

Litecoin

Litecoin spent the day retracing from the recent $166.2 high after bulls reached exhaustion. LTC was trying to push towards the $180 levels and contest the 2021 highs but failed to do so as bulls spent too much strength in the $160 area, where the cryptocurrency faced heavy resistance.

Litecoin is now having a downward trajectory and has failed to break the 50-hour moving average in an attempt to break it. LTC traders may look for a trade after the cryptocurrency finishes testing the $142.1 level.

LTC/USD 1-hour Chart

Litecoin’s technicals on the 4-hour and monthly time-frames are completely bullish and show no neutrality or bearishness. On the other hand, its daily and weekly overviews show some form of bearishness.

LTC/USD 1-day Technicals

Technical factors (1-hour Chart):

  • Its price is below both its 50-period EMA and its 21-period EMA
  • Price sightly below its middle Bollinger band
  • RSI is neutral (44.85)
  • Volume is average

Key levels to the upside:          Key levels to the downside:

1: $161.5                               1: $142.1

2: $181.3                               2: $128.42

3: $186.3                               3: $114.75

Categories
Crypto Market Analysis

Daily Crypto Review, Jan 19 – Ether Breaks $1,300; Litecoin Skyrockets

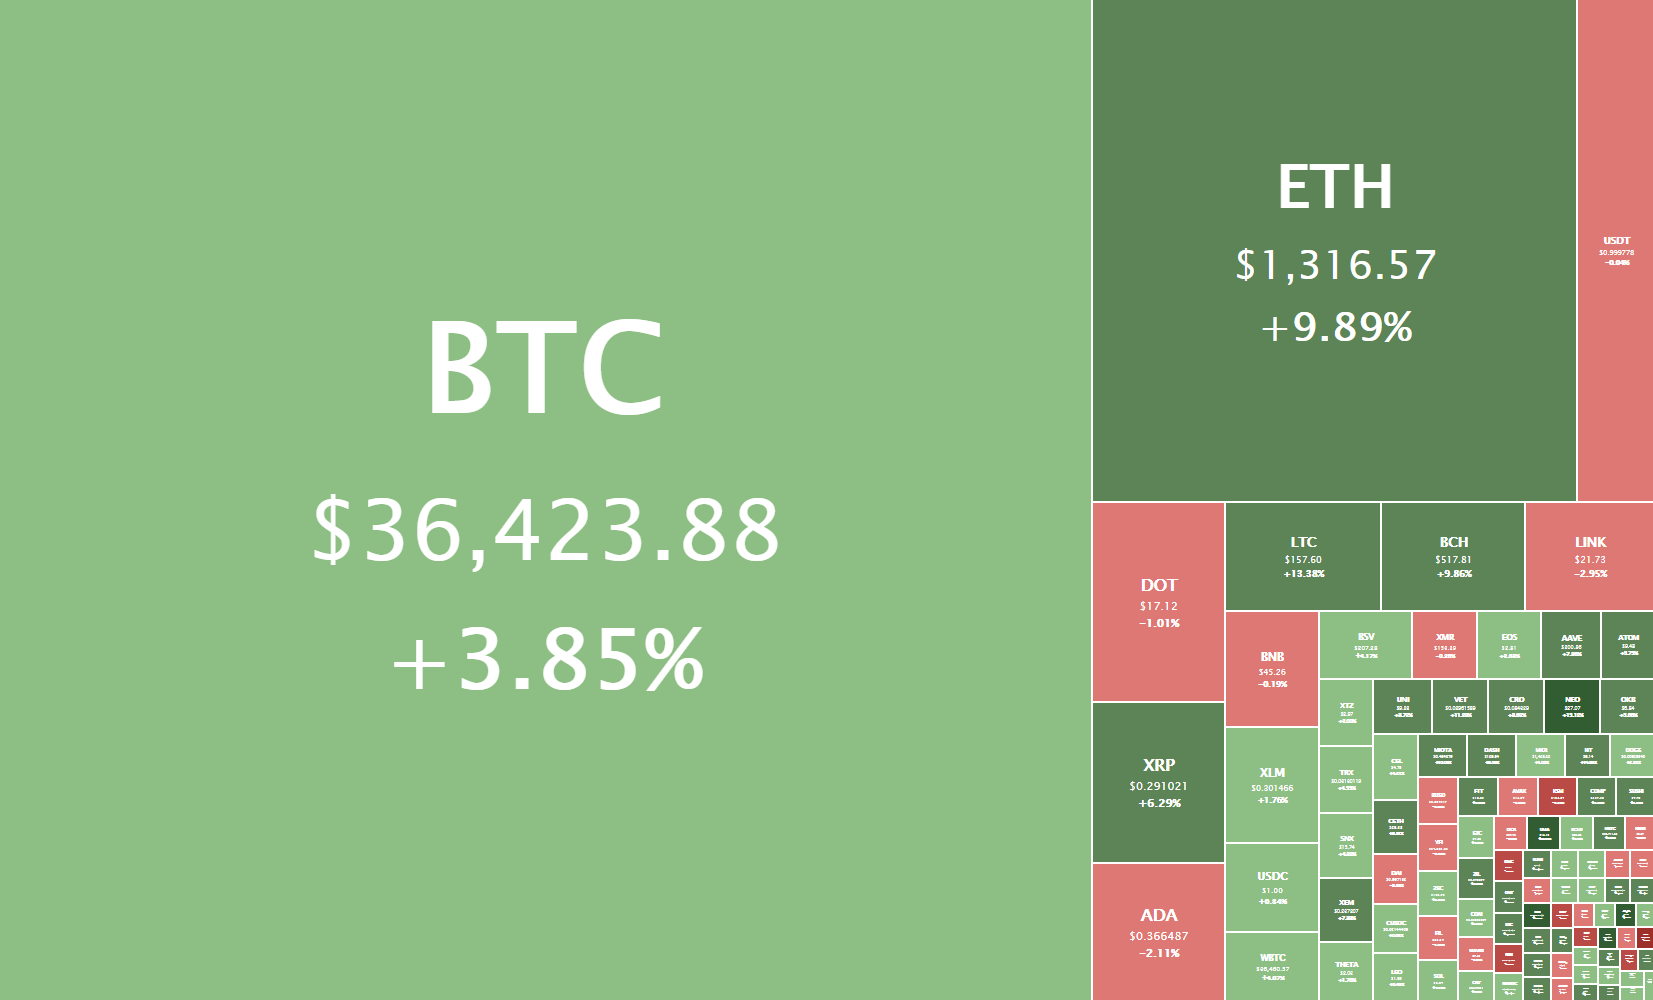
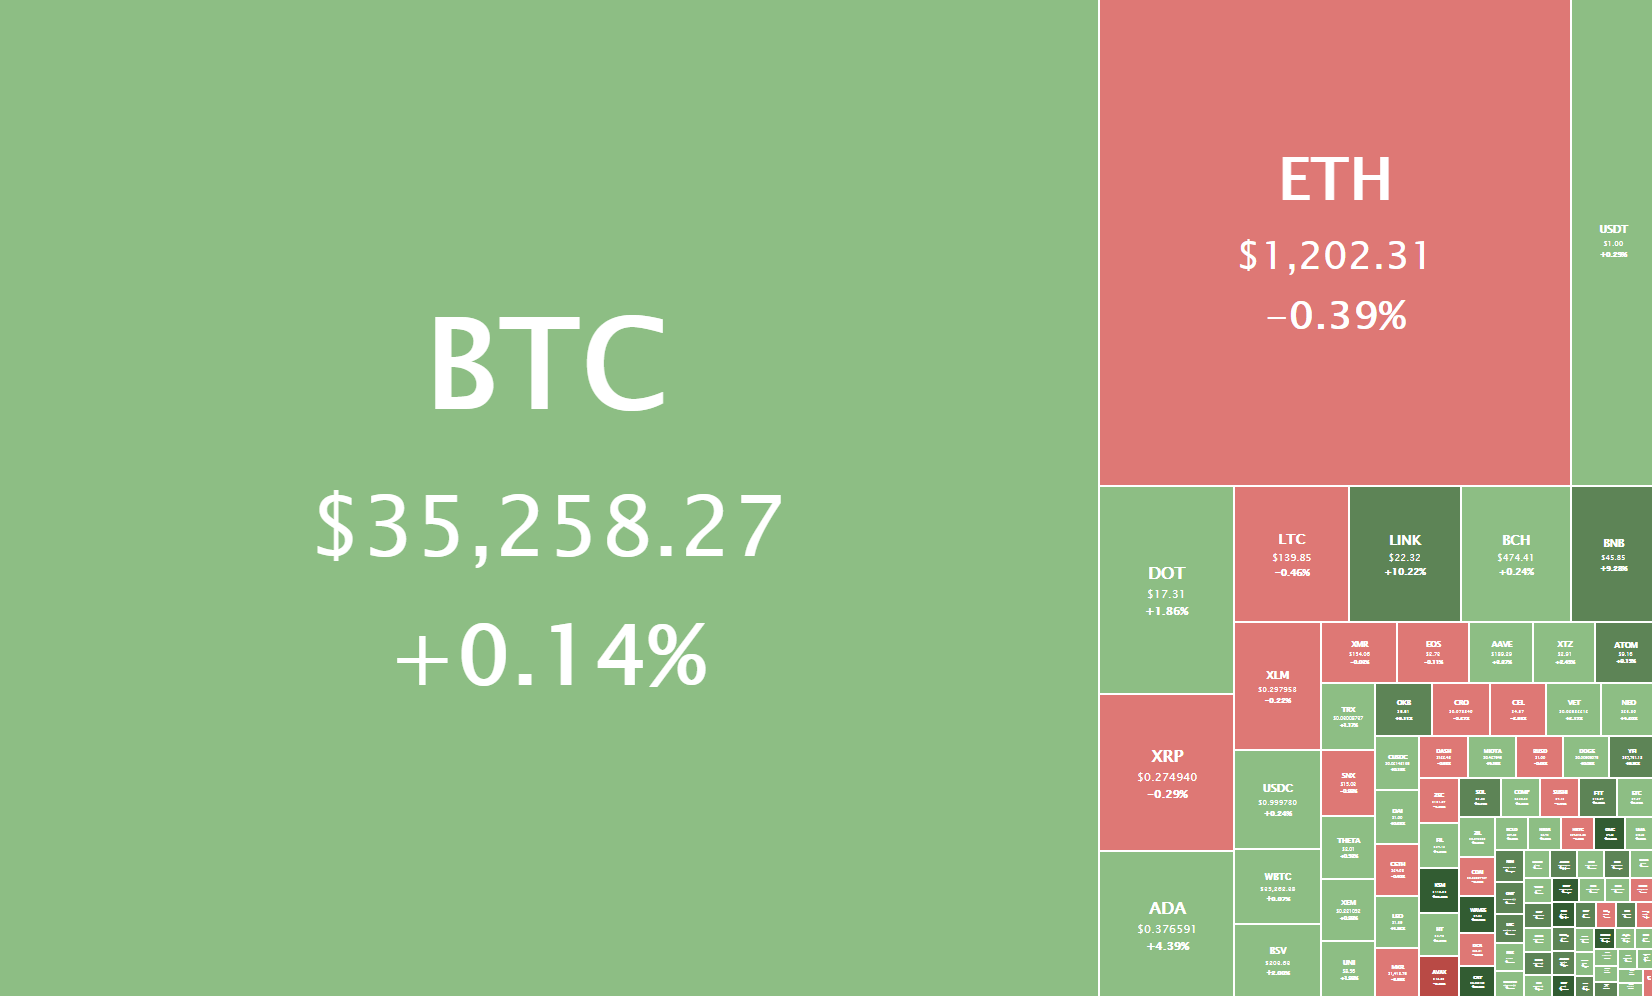
The crypto sector was mostly green, with altcoins attempting to push up and reduce Bitcoin’s market dominance. Bitcoin is currently trading for $36,423, representing an increase of 3.85% compared to yesterday’s value. Meanwhile, Ethereum’s price has increased by 9.89% on the day, while LTC gained 13.38% of its value.

Daily Crypto Sector Heat Map

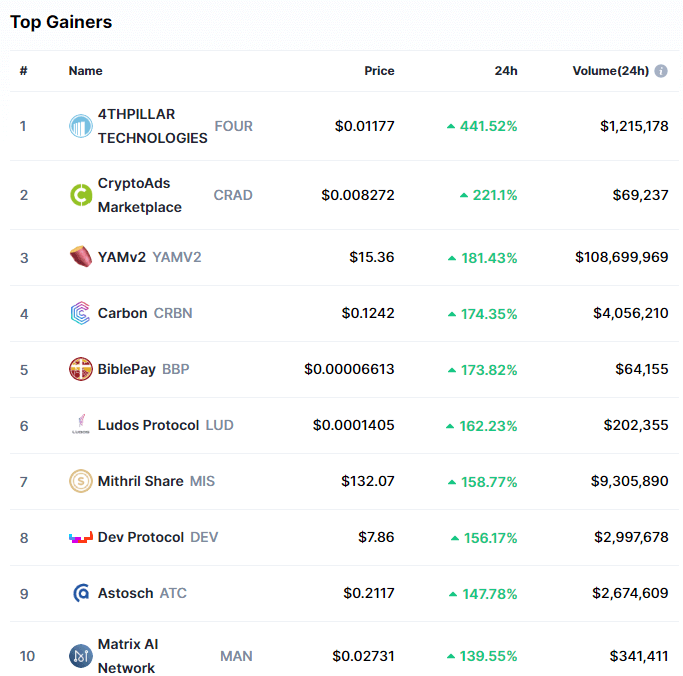
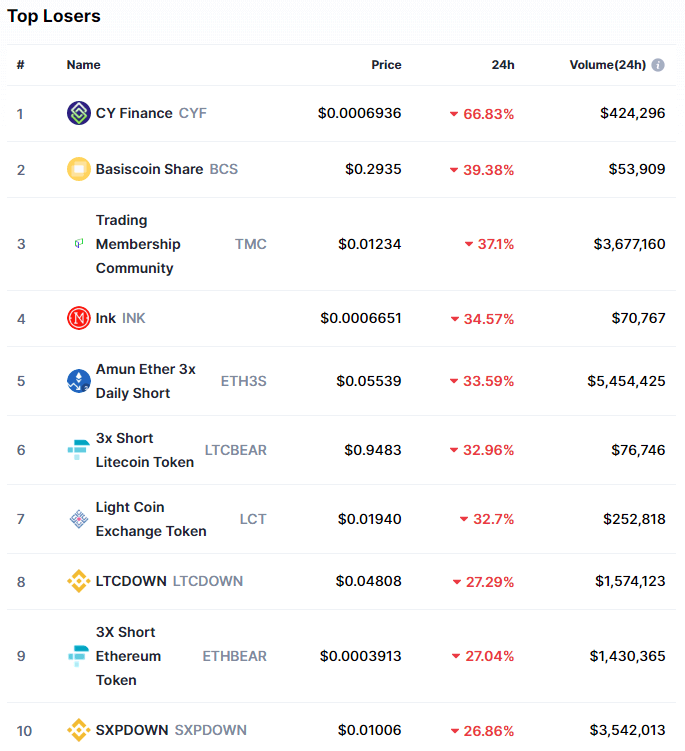
4THPILLAR TECHNOLOGIES gained 441.52% in the past 24 hours, making it the most prominent daily crypto gainer by far. It is followed by CryptoAds Marketplace’s 221.1% and YAMv2’s 181.43% gain. On the other hand, CY Finance lost 66.83%, making it the most prominent daily loser. It is followed by Basiscoin Share’s loss of 39.38% and Trading Membership Community’s loss of 37.1%.

Top 10 24-hour Performers (Click to enlarge)

Bottom 10 24-hour Performers (Click to enlarge)

Bitcoin’s market dominance has moved down since our last report, with its value currently being 65.6%. This value represents a 0.5% difference to the downside when compared to the previously reported value.

Weekly Crypto Market Cap Chart

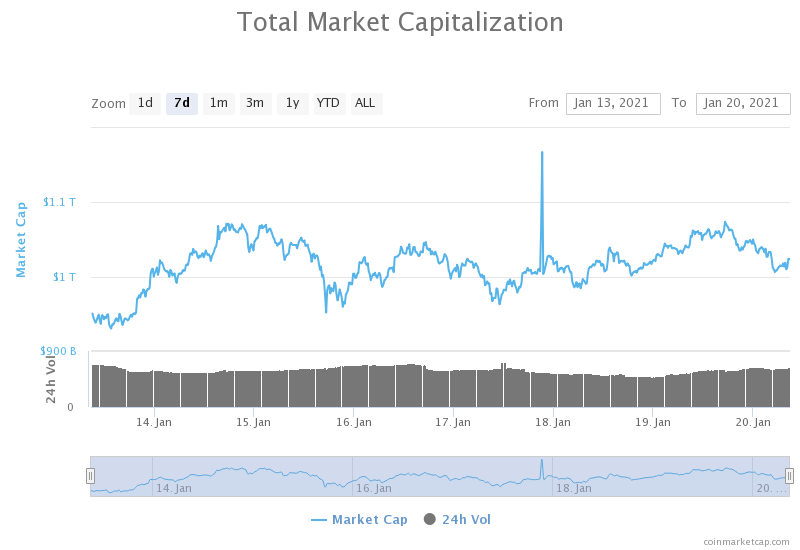
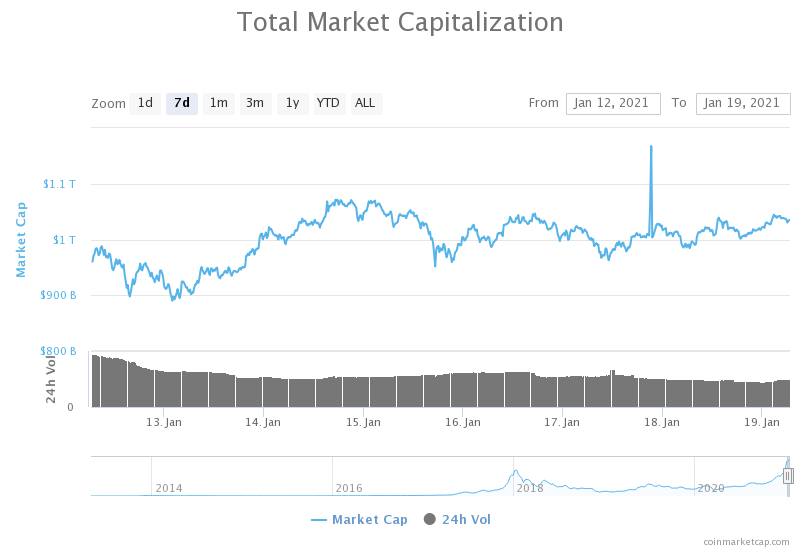
The cryptocurrency sector’s market capitalization has returned above the $1 trillion mark since we last reported, with its current value being $1.034 trillion. This represents a $41.3 billion increase when compared to our previous report.

_______________________________________________________________________

What happened in the past 24 hours?

_______________________________________________________________________

_______________________________________________________________________

Technical analysis

_______________________________________________________________________

Bitcoin

Bitcoin spent the day mostly trading sideways, bound by the $34,627 to the downside and $37,445 to the upside. The price hopped between these levels and created a higher high higher low pattern, which later on broke after BTC couldn’t pass its immediate resistance level.

Bitcoin’s price has created a triangle pattern on the daily chart, and breaking this triangle to the upside or downside will determine the short-term price direction.

BTC/USD 1-hour chart

Bitcoin’s technicals on all time-frames show a slight bullish tilt, with its oscillators pointing towards the sell-side.

BTC/USD 1-day Technicals

Technical factors (1-hour Chart):

  • Price is at both its 50-period EMA and its 21-period EMA
  • Price is at its middle Bollinger band
  • RSI is neutral (49.56)
  • Volume is average (low)

Key levels to the upside:          Key levels to the downside:

1: $37,445                             1: $34,627

2: $40,000                             2: $32,350

3: $42,000                             3: $27,960

Ethereum

Unlike Bitcoin, Ethereum has spent the day first slowly preparing for a move and then explosively pushing to the upside. The second-largest cryptocurrency by market cap has, after confirming its position above the $1,211 level, shot up towards the $1,350 level, which it was not able to break. With the volume descending after that move, ETH will most likely not be able to break $1,350 unless a new wave of bulls comes into the market.

ETH/USD 1-hour Chart

Ethereum’s 4-hour, daily, and monthly technicals are completely bullish and show no signs of neutrality or bearishness. On the other hand, its weekly overview shows some neutrality.

ETH/USD 1-day Technicals

Technical Factors (1-hour Chart):

  • Price is above both its 50-period and its 21-period EMA
  • Price is at its top Bollinger band
  • RSI has just left the overbought area (67.24)
  • Volume has spiked up in the recent hours

Key levels to the upside:          Key levels to the downside:

1: $1,350                               1: $1,211

2: $1,420                               2: $1,183.85

3: $1,450                               3: $1,060.5

Litecoin

Litecoin was one of the largest daily gainers after its price suddenly shot up from $141 all the way up to $160 in just one hourly candle. While it seemed at first like the retracement will eat away the gains LTC made, the cryptocurrency made another push towards the upside and stopped just below the $161.55 resistance level.

Litcoin’s descending volume and price movement, as well as the number of sell orders near the $161.55 level, will most likely be enough to keep LTC below the resistance level for now.

LTC/USD 1-hour Chart

Litecoin’s technicals on the 4-hour, daily, and weekly time-frame are completely bullish, while its monthly technicals are slightly more neutral.

LTC/USD 1-day Technicals

Technical factors (1-hour Chart):

  • Its price is above both its 50-period EMA and its 21-period EMA
  • Price close to its top Bollinger band
  • RSI is neutral (66.70)
  • Volume is above average

Key levels to the upside:          Key levels to the downside:

1: $161.5                               1: $142.1

2: $181.3                               2: $128.42

3: $186.3                               3: $114.75
Categories
Crypto Market Analysis

Daily Crypto Review, Jan 18 – Bitcoin Drops During the Weekend, ETH Remains Strong

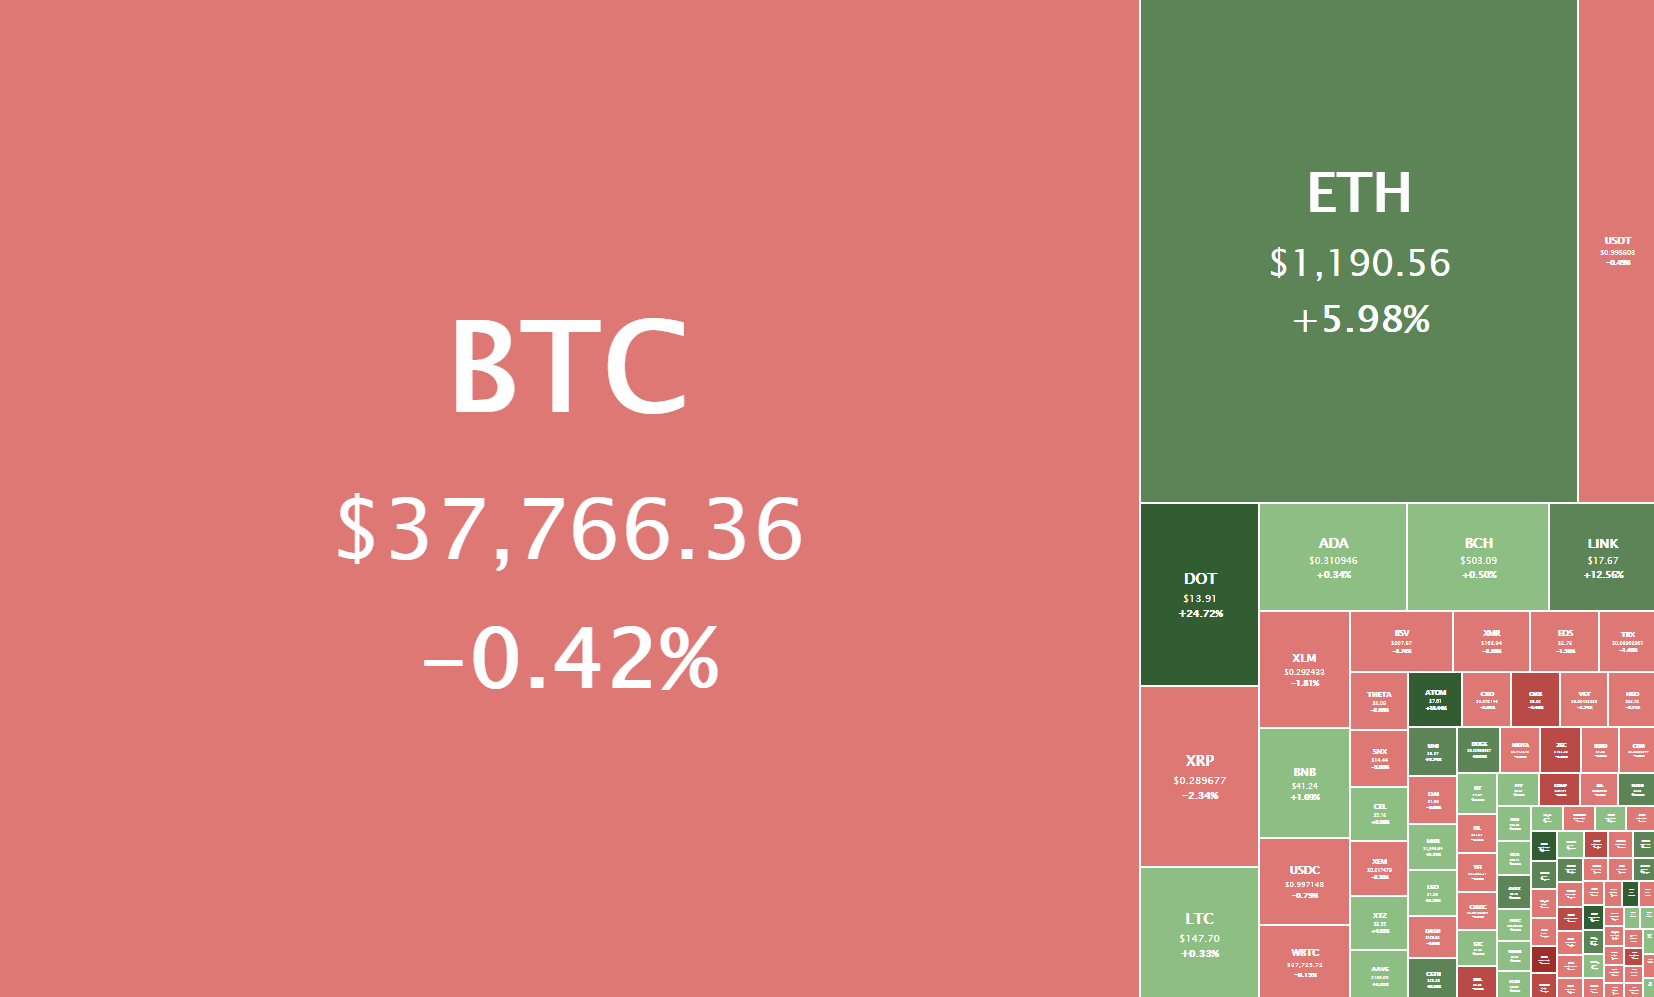
The crypto sector spent the weekend in a mostly descending fashion, with BTC continuing its short-term downtrend. Bitcoin is currently trading for $35,258, representing an increase of 0.14% compared to yesterday’s value. Meanwhile, Ethereum’s price has decreased by 0.39% on the day, while LTC lost 0.46% of its value.

Daily Crypto Sector Heat Map

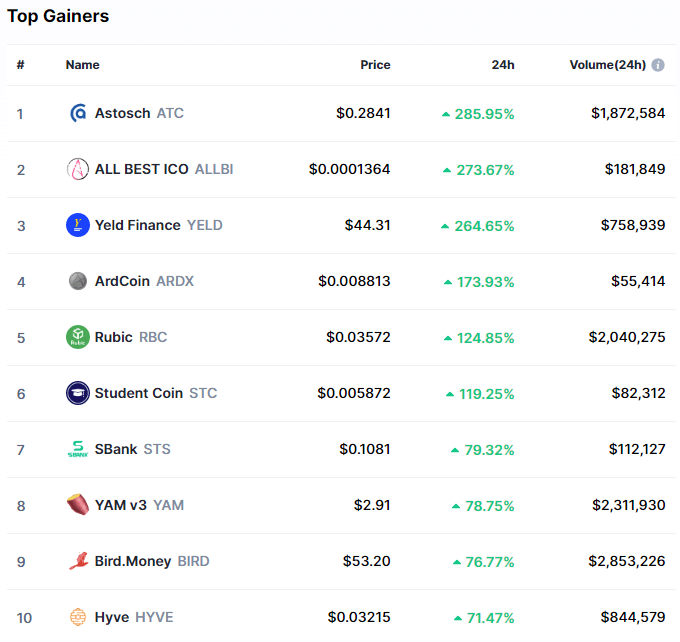
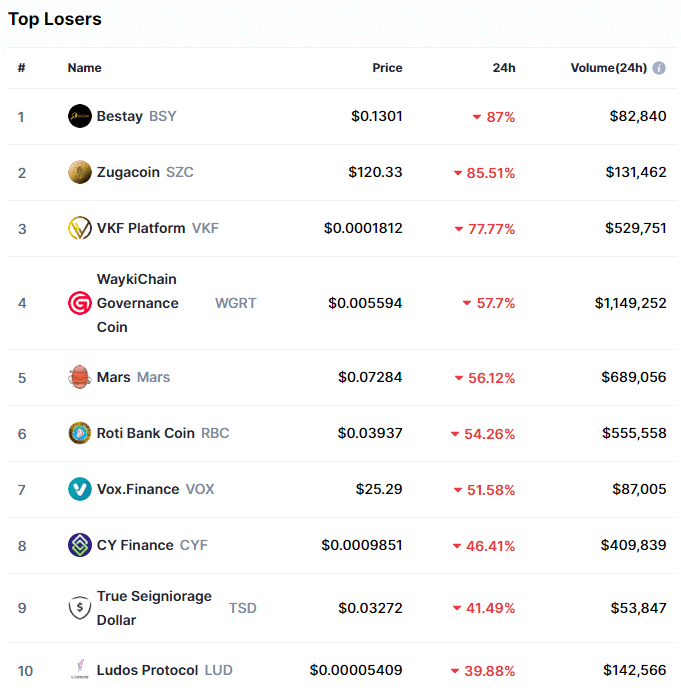
Astosch gained 285.95% in the past 24 hours, making it the most prominent daily crypto gainer by far. It is followed by ALL BEST ICO’s 273.67% and Yeld Finance’s 264.65% gain. On the other hand, Bestay lost 87%, making it the most prominent daily loser. It is followed by Zugacoin’s loss of 85.51% and VKF Platform’s loss of 77.77%.

Top 10 24-hour Performers (Click to enlarge)

Bottom 10 24-hour Performers (Click to enlarge)

Bitcoin’s market dominance has moved down since our last report, with its value currently being 66.1%. This value represents a 2.3% difference to the downside when compared to the previously reported value.

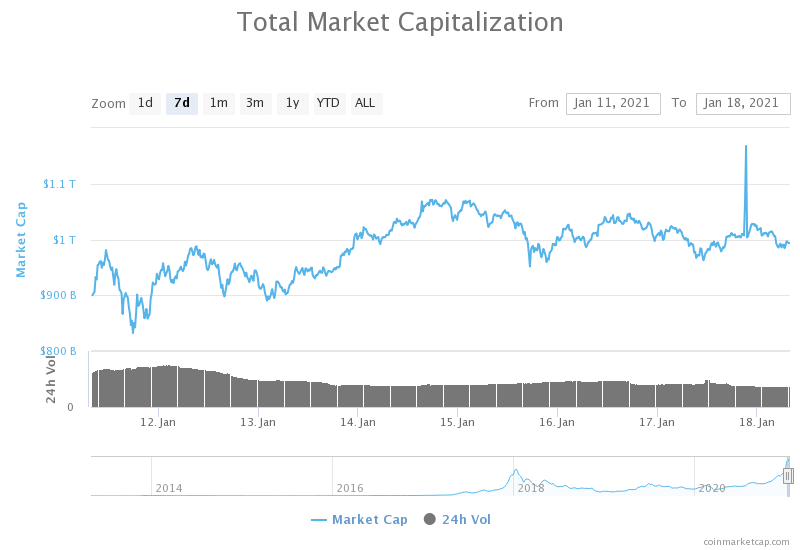
Weekly Crypto Market Cap Chart

The cryptocurrency sector’s market capitalization has dropped below the $1 trillion mark since we last reported, with its current value being $993.33 billion. This represents a $43.67 billion decrease when compared to our previous report.

_______________________________________________________________________

What happened in the past 24 hours?

_______________________________________________________________________

_______________________________________________________________________

Technical analysis

_______________________________________________________________________

Bitcoin

Bitcoin spent the weekend following the downtrend it started on Jan 14, with its price slowly declining from a high of $39,600 to a low of $33,833. During the downtrend, the price has contested and broken the $36,640 level to the downside and looks like it will contest the $33,200 level in the near future. BTC is currently trading at a little above $35,000, representing a weekly loss of 6.09% and a monthly gain of 29.87%.

Bitcoin’s price has responded well to the 21-day moving average and found very strong support there. Staying above this level will be crucial if BTC wants to turn to the upside.

BTC/USD 1-hour chart

Bitcoin’s technicals on the daily, weekly, and monthly time-frame are completely bullish and show no neutral or bearish signs. On the other hand, its 4-hour overview is completely bearish.

BTC/USD 1-day Technicals

Technical factors (1-hour Chart):

  • Price is slightly below its 50-period EMA and its 21-period EMA
  • Price is slightly below its middle Bollinger band
  • RSI is neutral (43.00)
  • Volume is descending

Key levels to the upside:          Key levels to the downside:

1: $36,640                             1: $33,200

2: $40,000                             2: $30,640

3: $42,000                             3: $27,960

Ethereum

Unlike Bitcoin, Ethereum’s weekend was not spent in a downfall. The second-largest cryptocurrency by market cap headed towards the $1,300 level but failed to break it, which prompted a weekend of sideways trading. While ETH did break the $1,211 level to the downside, the $1,183.85 level held up. Ether is currently trading in a very narrow range, bound by the aforementioned levels.

ETH’s short-term movement will greatly depend on two factors: Bitcoin’s volatility and Ether itself, breaking its immediate support or resistance levels.

ETH/USD 1-hour Chart

Ethereum’s technicals all time-frames are tilted towards the buy-side, with the 4-hour, daily, and weekly overviews fully pointing towards the buy-side. Its monthly overview, however, has oscillators pointing towards neutrality.

ETH/USD 1-day Technicals

Technical Factors (1-hour Chart):

  • Price is slightly below its 50-period and its 21-period EMA
  • Price is between its middle and bottom Bollinger band
  • RSI is neutral (43.72)
  • Volume is slightly below average

Key levels to the upside:          Key levels to the downside:

1: $1,211                               1: $1,183.85

2: $1,255                               2: $1,060.5

3: $1,350                               3: $1,047.5

Litecoin

Litecoin mirrored Bitcoin’s movements over the weekend, stepping into a downtrend that started on Jan 14, after Litecoin couldn’t push its price to $160. The price is currently fighting for the $142.1 level, which it has recently broken to the downside.

While Litecoin’s movements seem to mirror Bitcoin’s, its volume remains stable despite Bitcoin’s volume dropping. At the moment, LTC might be a better choice for people that want to be less affected by Bitcoin’s volatility.

LTC/USD 1-hour Chart

Litecoin’s technicals on the daily, weekly, and monthly time-frame are completely bullish and show no neutral or bearish signs (though they are slightly less bullish than Bitcoin’s overviews). On the other hand, its 4-hour overview is completely bearish.

LTC/USD 1-day Technicals

Technical factors (1-hour Chart):

  • Its price is slightly below its 50-period EMA and its 21-period EMA
  • Price close to its bottom Bollinger band
  • RSI is neutral (42.47)
  • Volume is average

Key levels to the upside:          Key levels to the downside:

1: $142.1                               1: $128.42

2: $161.5                               2: $114.75

3: $181.3                               3: $97.8

Categories
Crypto Market Analysis

Daily Crypto Review, Jan 15 – Bitcoin Retraces After Hitting $40k; Ethereum Contests $1.2k

The crypto sector was mostly stable in the past 24 hours, as most cryptocurrencies were trying to find their top or retraced slightly. Bitcoin is currently trading for $37,766, representing a decrease of 0.42% compared to yesterday’s value. Meanwhile, Ethereum’s price has increased by 5.98% on the day, while LTC gained 0.33% of its value.

Daily Crypto Sector Heat Map

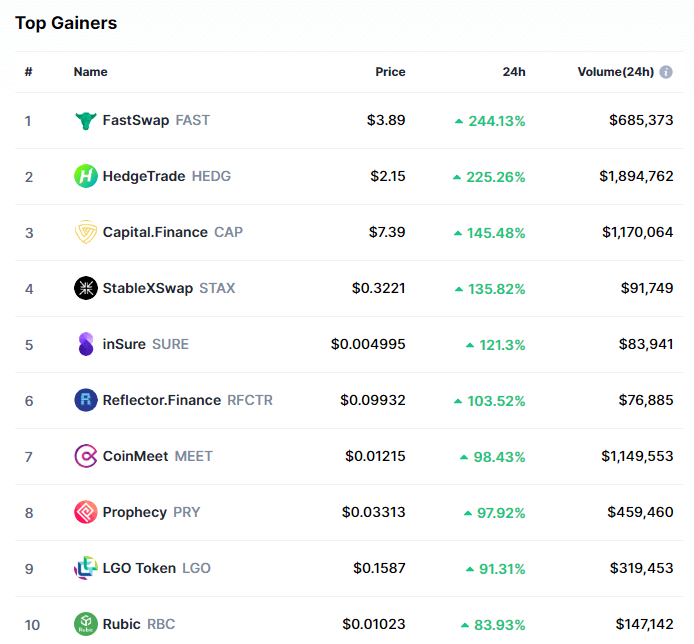
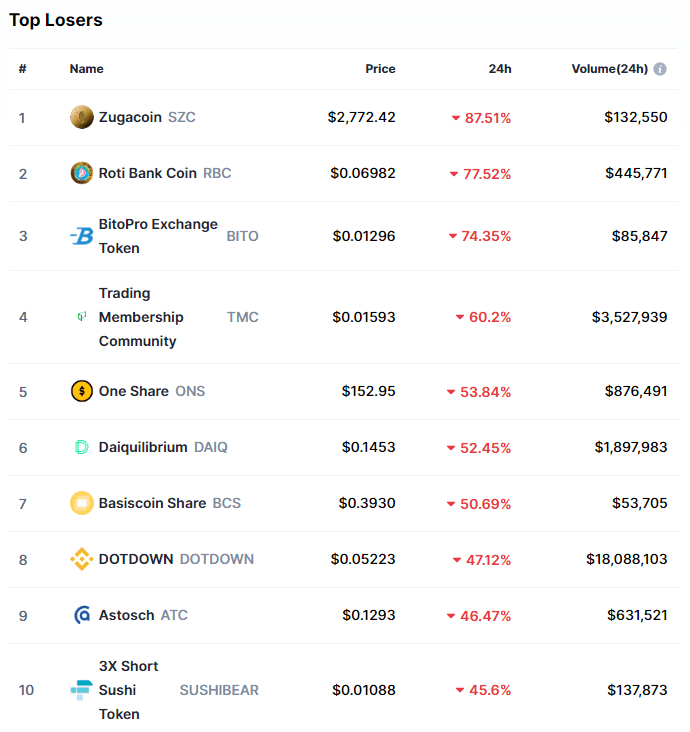
FastSwap gained 244.13% in the past 24 hours, making it the most prominent daily crypto gainer by far. It is followed by HedgeTrade’s 225.26% and Capital.Finance’s 145.48% gain. On the other hand, Zugacoin lost 87.51%, making it the most prominent daily loser. It is followed by Roti Bank Coin’s loss of 77.52% and BitiPro Exchange Token’s loss of 74.35%.

Top 10 24-hour Performers (Click to enlarge)

Bottom 10 24-hour Performers (Click to enlarge)

Bitcoin’s market dominance has moved down slightly since our last report, with its value currently being 68.4%. This value represents a 0.6% difference to the downside when compared to the previously reported value.

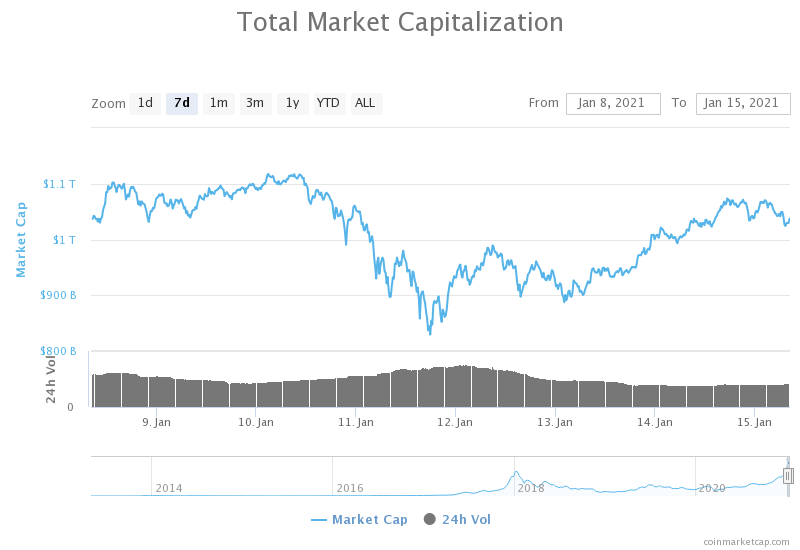
Weekly Crypto Market Cap Chart

The cryptocurrency sector’s market capitalization has made negligible gains since we last reported, with its current value being $1.037 trillion. This represents a $5 billion increase when compared to our previous report.

_______________________________________________________________________

What happened in the past 24 hours?

_______________________________________________________________________

_______________________________________________________________________

Technical analysis

_______________________________________________________________________

Bitcoin

Bitcoin has ended its uptrend by hitting a high of $40,112 yesterday, prompting a slight pullback. The pullback was, just like the price increase, happening on low volume and had the same intensity as well. The only differentiating factor was its direction. The move to the downside ended with BTC’s price hitting the 50-hour moving average and pushing up.

Bitcoin has a couple of strong resistance lines to the upside, one being the immediate 21-hour EMA, and then the $40,000 and ultimately $42,000 levels. On the other hand, its support is guarded by the 50-hour EMA and the $36,640 level.

BTC/USD 1-hour chart

Bitcoin’s technicals on the daily and monthly time-frame are overall bullish but have oscillators pointing to the sell-side. On the other hand, its 4-hour and weekly overviews are completely bullish.

BTC/USD 1-day Technicals

Technical factors (1-hour Chart):

  • Price is between its 50-period EMA and its 21-period EMA
  • Price is slightly below its middle Bollinger band
  • RSI is neutral (50.19)
  • Volume is average

Key levels to the upside:          Key levels to the downside:

1: $40,000                             1: $36,640

2: $42,000                             2: $33,200

3: $43,600                             3: $30,640

Ethereum

Ethereum’s push to the upside has, just like with Bitcoin, seemingly ended. However, its pullback hasn’t started at all, as its price kept fluctuating between the recently $1,183.85 support level and the recent high. Trading in such a narrow range is not sustainable, and ETH will break either to the upside or downside very soon.

ETH traders can finally catch a nice trade as the cryptocurrency has (at least a bit) moved in a different manner than Bitcoin. Ether’s upside is guarded by the heavy resistance zone slightly below $1,300 as well as the $1,350 level. Its downside has smaller support levels, some of them being $1,211, $1,183.85, as well as the 21-hour and 50-hour EMAs.

ETH/USD 1-hour Chart

Ethereum’s technicals on the 4-hour and daily time-frames are overall bullish but have oscillators pointing to the sell-side. On the other hand, its weekly and monthly overviews are completely bullish.

ETH/USD 1-day Technicals

Technical Factors (1-hour Chart):

  • Price is above its 50-period and at its 21-period EMA
  • Price is near its top Bollinger band
  • RSI is neutral (61.37)
  • Volume is slightly below average

Key levels to the upside:          Key levels to the downside:

1: $1,255                               1: $1,211

2: $1,350                               2: $1,183.85

3: $1,419                               3: $1,060.5

Litecoin

Litecoin continued trading within its range, bound by $142.1 to the downside and $161.5 to the upside. Its price is now also between the 21-hour and the 50-hour EMAs, which have proven to be strong support and resistance levels, especially when paired with low trading volume.

Litecoin is currently mirroring the direction of Bitcoin’s moves, but with much less intensity. This makes it a very unattractive trading pair at the moment.

LTC/USD 1-hour Chart

Litecoin’s technicals on all time-frames are completely bullish and without any signs of neutrality.

LTC/USD 1-day Technicals

Technical factors (1-hour Chart):

  • Its price is slightly above its 50-period EMA and at its 21-period EMA
  • Price at its middle Bollinger band
  • RSI is neutral (53.10)
  • Volume is descending

Key levels to the upside:          Key levels to the downside:

1: $161.5                               1: $142.1

2: $181.3                               2: $128.42

3: $186.3                               3: $114.75

Categories
Crypto Market Analysis

Daily Crypto Review, Jan 14 – Bitcoin Records Double-Digit Gains as it Passes $38K; Crypto Market in the Green

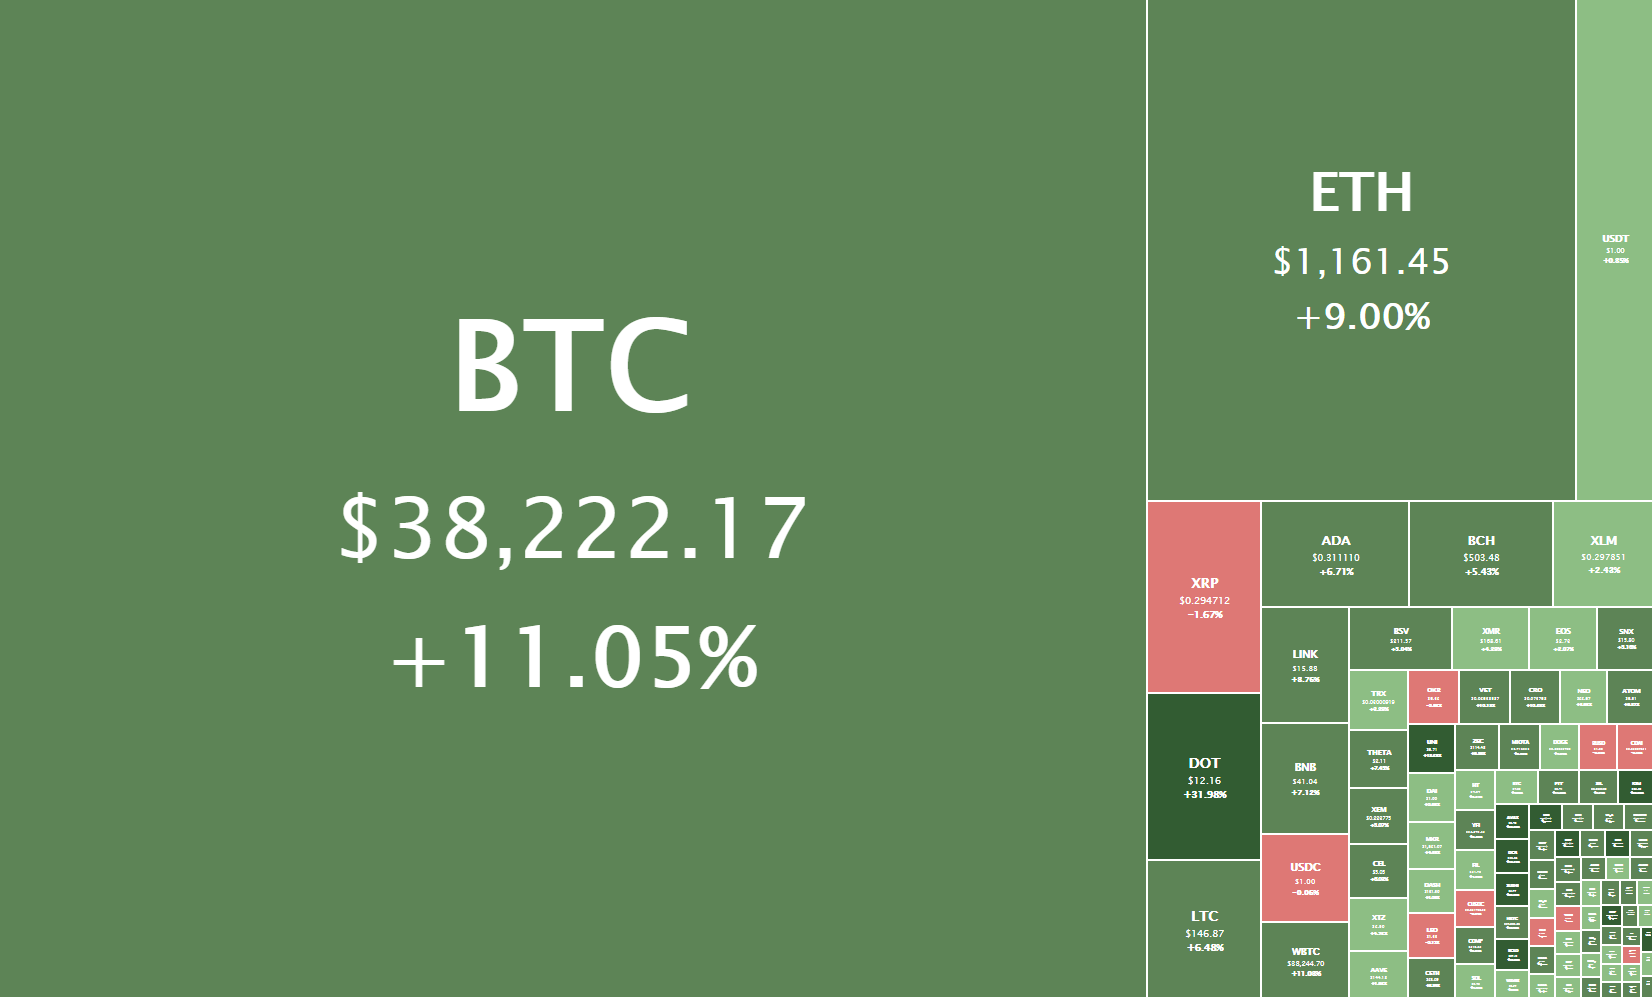
The crypto sector ended up almost completely in the green as Bitcoin recorded double-digit gains and pulled the rest of the market up. Bitcoin is currently trading for $38,222, representing an increase of 11.05% compared to yesterday’s value. Meanwhile, Ethereum’s price has increased by 9.00% on the day, while LTC gained 6.48% of its value.

Daily Crypto Sector Heat Map

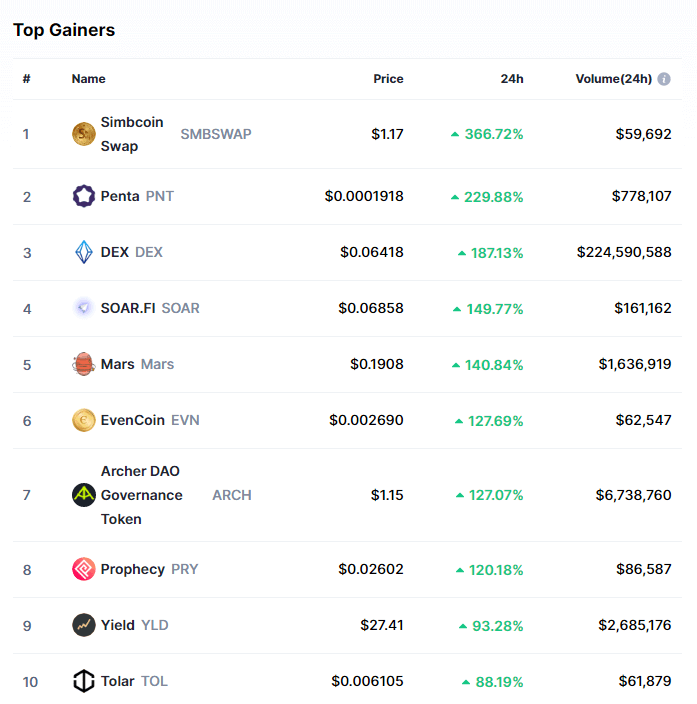
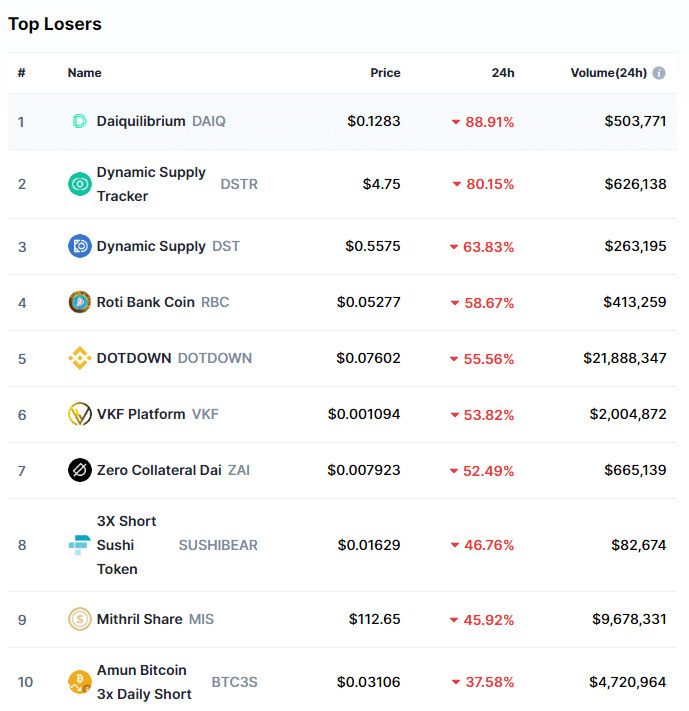
Simbcoin gained 366.72% in the past 24 hours, making it the most prominent daily crypto gainer by far. It is followed by Penta’s 229.88% and DEX’s 187.13% gain. On the other hand, Daiquilibrium lost 88.91%, making it the most prominent daily loser. It is followed by Dynamic Supply Tracker’s loss of 80.15% and Dynamic Supply’s loss of 63.83%.

Top 10 24-hour Performers (Click to enlarge)

Bottom 10 24-hour Performers (Click to enlarge)

Bitcoin’s market dominance has moved up slightly since our last report, with its value currently being 69%. This value represents a 0.4% difference to the upside when compared to the previously reported value.

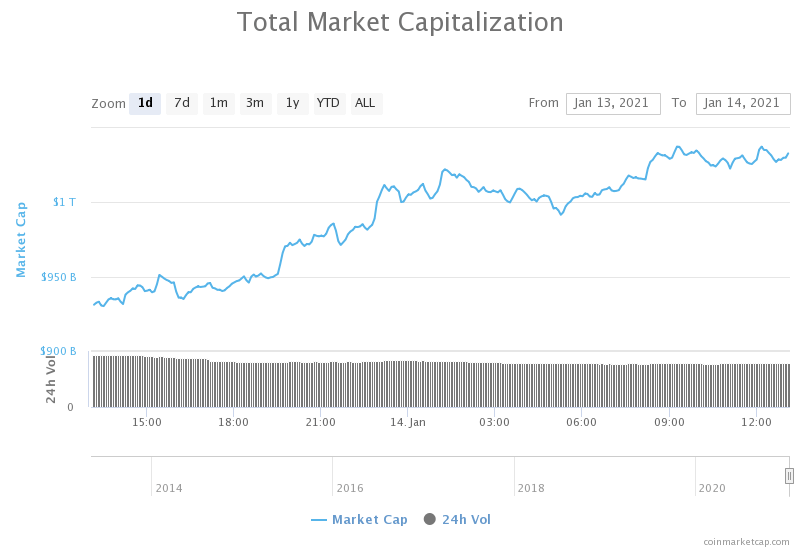
Daily Crypto Market Cap Chart

The cryptocurrency sector’s market capitalization has made significant gains since we last reported, with its current value being $1.032 trillion. This represents an $88.3 billion increase when compared to our previous report.

_______________________________________________________________________

What happened in the past 24 hours?

_______________________________________________________________________

_______________________________________________________________________

Technical analysis

_______________________________________________________________________

Bitcoin

Bitcoin had started changing its price direction on Jan 13, when it started to slowly push towards the upside. The largest cryptocurrency by market cap managed to pass the $36,640 level and reach as high as $38,789 before pulling back slightly. This steady price increase was followed by average (or even slightly descending) volume.

The pullback BTC went into after hitting the recent high was quickly stopped by the 21-hour and 50-hour EMAs, changing the overall stance from an expected downturn to uncertainty.

BTC/USD 1-hour chart

Bitcoin’s technicals on the 4-hour, daily and monthly time-frame are overall bullish, with oscillators pointing to the sell-side. On the other hand, its weekly overview is completely bullish.

BTC/USD 1-day Technicals

Technical factors (1-hour Chart):

  • Price is above both its 50-period EMA and its 21-period EMA
  • Price is between its middle and top Bollinger band
  • RSI is neutral (62.38)
  • Volume is average

Key levels to the upside:          Key levels to the downside:

1: $40,000                             1: $36,640

2: $42,000                             2: $33,200

3: $43,600                             3: $30,640

Ethereum

Ethereum’s period of heavy correlation with Bitcoin has continued as its price slowly gained momentum towards the upside. Ether managed to push its price to the $1,183.85 level but couldn’t quite break it. This caused a minor pullback, which ended very quickly.

Ethereum’s 21-hour and 50-hour EMAs play a significant role in determining its price direction and should be considered by the traders at all times. On top of that, any ETH trader should pay attention to BTC’s movements, as those ultimately determine the price direction of most cryptocurrencies.

ETH/USD 1-hour Chart

Ethereum’s technicals on the daily and weekly time-frame are currently completely bullish, while its 4-hour and monthly overviews show some signs of neutrality.

ETH/USD 1-day Technicals

Technical Factors (1-hour Chart):

  • Price is above both its 50-period and its 21-period EMA
  • Price is near its top Bollinger band
  • RSI is neutral (64.19)
  • Volume is slightly below average

Key levels to the upside:          Key levels to the downside:

1: $1,183.85                          1: $1,060.5

2: $1,211                               2: $1,047.5

3: $1,226.5                            3: $992

Litecoin

While Litecoin did follow Bitcoin’s price direction, it did so with much less conviction and intensity. Its price managed to pass the $142.1 level to the upside and establish its price above it but failed to move into the upper half of the trading range bound by $142.1 to the downside and $161.5 to the upside.

Litecoin currently has a very nicely-built support zone, while its upside is quite open. If Bitcoin’s price remains the same, traders can expect LTC to try to push towards or even contest the $161.5 level.

LTC/USD 1-hour Chart

Litecoin’s technicals on the shorter time-frames (4-hour, daily, and weekly) show overall tilt to the buy-side with hints of neutrality. Its monthly time-frame, however, is completely bullish.

LTC/USD 1-day Technicals

Technical factors (1-hour Chart):

  • Its price is slightly above its 50-period EMA and its 21-period EMA
  • Price slightly above its middle Bollinger band
  • RSI is neutral (57.08)
  • Volume is descending

Key levels to the upside:          Key levels to the downside:

1: $161.5                               1: $142.1

2: $181.3                               2: $128.42

3: $186.3                               3: $114.75

Categories
Crypto Market Analysis

Daily Crypto Review, Jan 13 – Polkadot Outperforms the Market as it Heads Towards $10; Crypto Sector in the Red

The crypto sector ended up mostly trading in the red as cryptocurrencies such as Ether, Litcoin, and Bitcoin Cash dropped over 5% on the day. Polkadot was one of the few cryptocurrencies that managed to score double-digit gains and outperform the market by a large margin. However, this is purely due to fundamental reasons (immense support coming from the Binance exchange) rather than technicals.

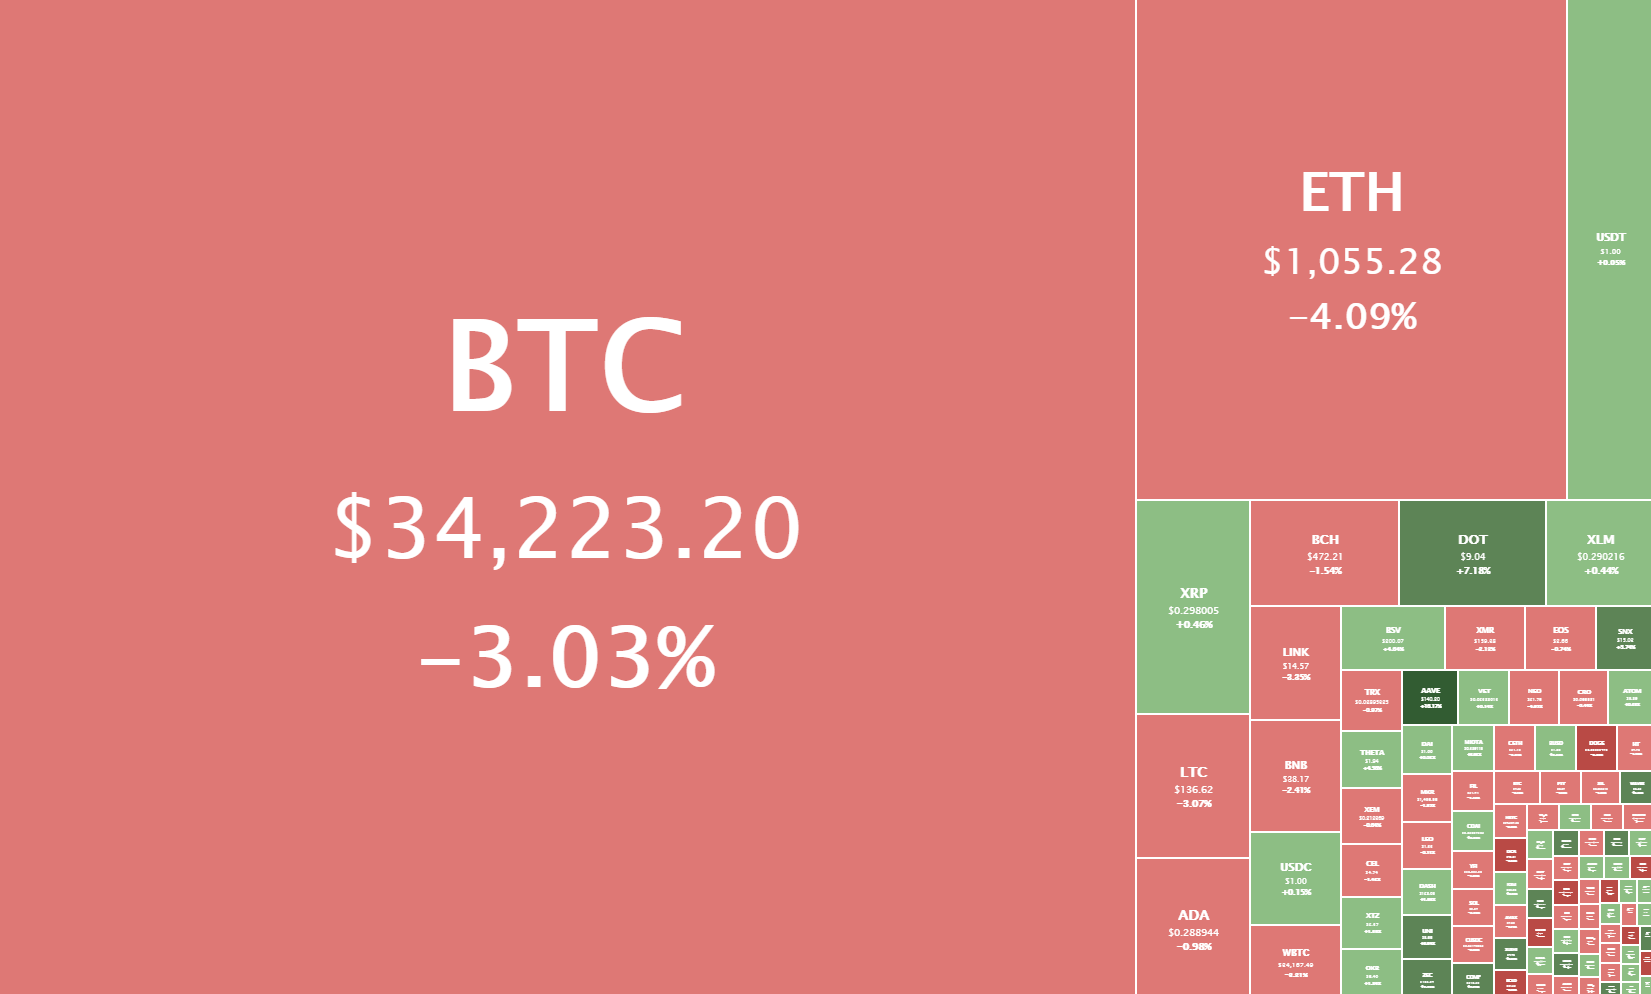
Bitcoin is currently trading for $34,223, representing a decrease of 3.03% compared to yesterday’s value. Meanwhile, Ethereum’s price has decreased by 4.09% on the day, while LTC lost 3.07% of its value.

Daily Crypto Sector Heat Map

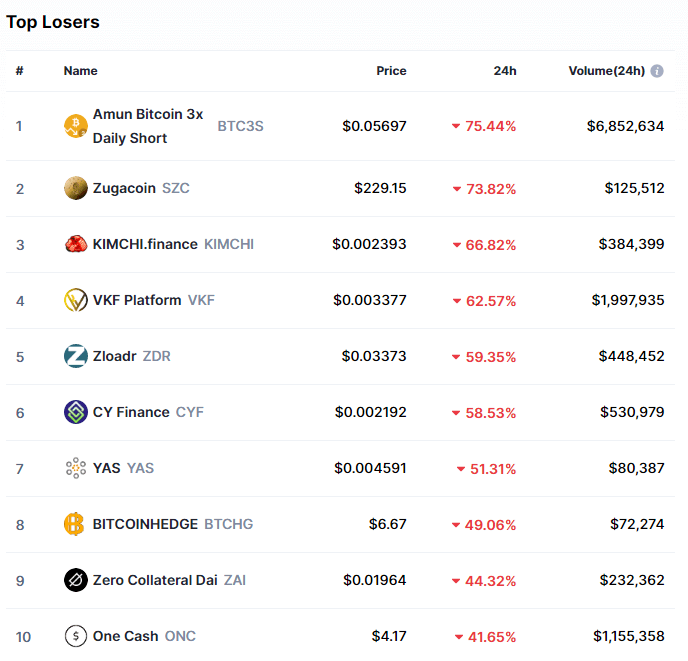
Metacoin gained 103.61% in the past 24 hours, making it the most prominent daily crypto gainer by far. It is followed by OVR’s 98.72% and Latamcash’s 92.88% gain. On the other hand, Amun Bitcoin 3x Daily Short lost 75.44%, making it the most prominent daily loser. It is followed by Zugacoin’s loss of 73.82% and KIMCHI.finance’s loss of 66.82%.

Top 10 24-hour Performers (Click to enlarge)

Bottom 10 24-hour Performers (Click to enlarge)

Bitcoin’s market dominance has moved down very slightly since our last report, with its value currently being 68.6%. This value represents a 0.1% difference to the downside than the value it had when we last reported.

Daily Crypto Market Cap Chart

The cryptocurrency sector’s capitalization has decreased since we last reported, with its current value being $948.23 trillion. This represents a $17.92 billion decrease when compared to our previous report.

_______________________________________________________________________

What happened in the past 24 hours?

_______________________________________________________________________

_______________________________________________________________________

Technical analysis

_______________________________________________________________________

Bitcoin

Bitcoin spent the day hovering between the $33,320 support level and the $36,640 resistance level, with its price mostly being in the bottom part of the range. The price even breached the support level and went past it on several occasions, but it always returned back up. While it currently seems stable and on decreasing volume, Bitcoin might experience a stronger pullback and an attempt to retest $30,000 once again.

BTC/USD 1-hour chart

Bitcoin’s technicals on the daily and monthly time-frame bullish, but contain some neutrality alongside the bullishness. However, its weekly overview is completely bullish, while its 4-hour chart is completely bearish.

BTC/USD 1-day Technicals

Technical factors (1-hour Chart):

  • Price is between its 50-period EMA and its 21-period EMA
  • Price is near its middle Bollinger band
  • RSI is neutral (50.24)
  • Volume is descending

Key levels to the upside:          Key levels to the downside:

1: $36,640                             1: $33,200

2: $40,000                             2: $30,640

3: $42,000                             3: $27,960

Ethereum

Ethereum has traded almost exactly like Bitcoin in the past 24 hours, both in terms of price direction and intensity. The second-largest cryptocurrency by market cap is currently in an extremely narrow and unsustainable range, bound by the Fib retracement level of $1,060 to the upside and a 2017 Fib retracement sitting at $1,047.

Ethereum’s 21-hour and 50-hour moving averages play a significant role in determining price direction and should be considered by the traders at all times.

ETH/USD 1-hour Chart

Ethereum’s technicals on the daily and monthly time-frame bullish, but contain some neutrality alongside the bullishness. However, its weekly overview is completely bullish, while its 4-hour chart is completely bearish.

ETH/USD 1-day Technicals

Technical Factors (1-hour Chart):

  • Price is between its 50-period and its 21-period EMA
  • Price is at its middle Bollinger band
  • RSI is neutral (48.60)
  • Volume is descending

Key levels to the upside:          Key levels to the downside:

1: $1,129                               1: $1,060.5

2: $1,211                               2: $1,047.5

3: $1,226.5                             3: $992

Litecoin

Litecoin has been pretty stable in the past 24 hours, with its price trading within a range bound by $128.4 to the downside and $142.1 to the upside. These support/resistance levels, alongside the 21-hour and 50-hour EMAs, will determine Litecoin’s future price intensity, while Bitcoin’s next move will most likely determine its price direction.

LTC/USD 1-hour Chart

Litecoin’s technicals on the daily and monthly time-frame are completely bullish. However, its weekly overview shows slightly less bullishness, while its 4-hour chart is almost completely bearish.

LTC/USD 1-day Technicals

Technical factors (1-hour Chart):

  • Its price is between its 50-period EMA and its 21-period EMA
  • Price slightly below its middle Bollinger band
  • RSI is neutral (51.37)
  • Volume is descending

Key levels to the upside:          Key levels to the downside:

1: $142.1                               1: $128.42

2: $161.5                               2: $114.75

3: $181.3                               3: $98

Categories
Crypto Market Analysis

Daily Crypto Review, Jan 12 – XLM Back in the top10 Cryptos by Market Cap; Crypto Sector in the Green

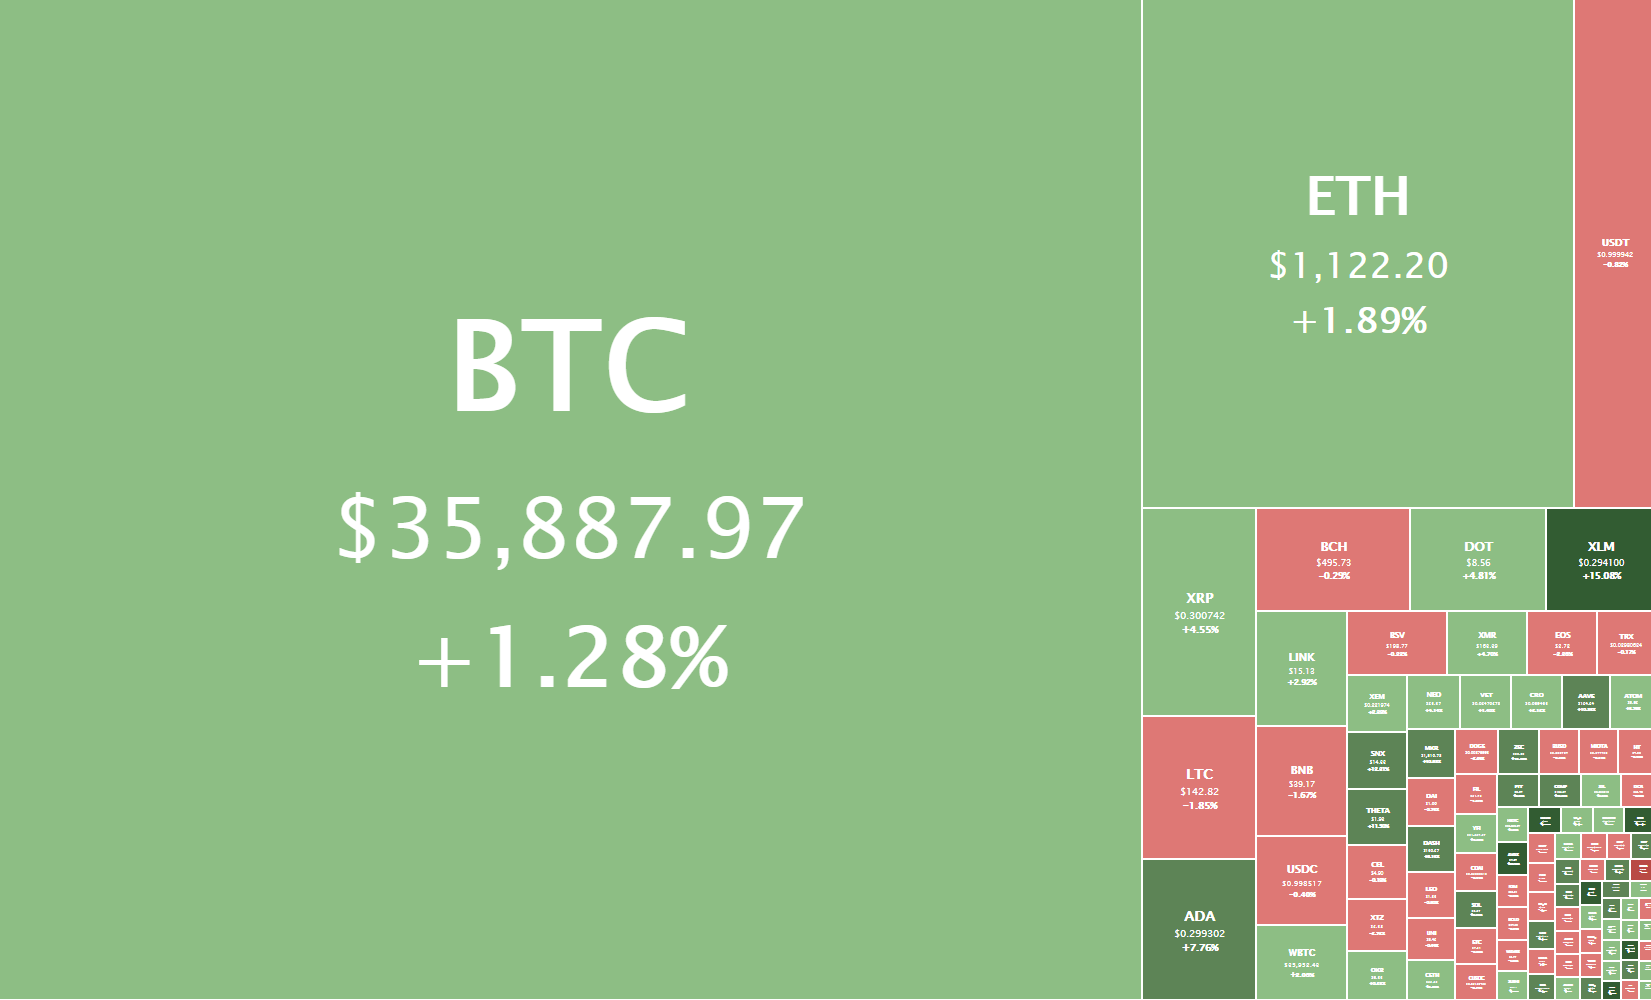
The crypto sector has experienced a rally that brought the market to its feed after yesterday’s dip. One of the best daily performers was Stellar Lumens (XLM), which shot up in the past week on great fundamentals (and once again today), gaining over 30% just a couple of hours, reentering the top10 cryptocurrencies by market cap.

Bitcoin is currently trading for $35,887, representing an increase of 1.28% compared to yesterday’s value. Meanwhile, Ethereum’s price has increased by 1.89% on the day, while LTC lost 1.85% of its value.

Daily Crypto Sector Heat Map

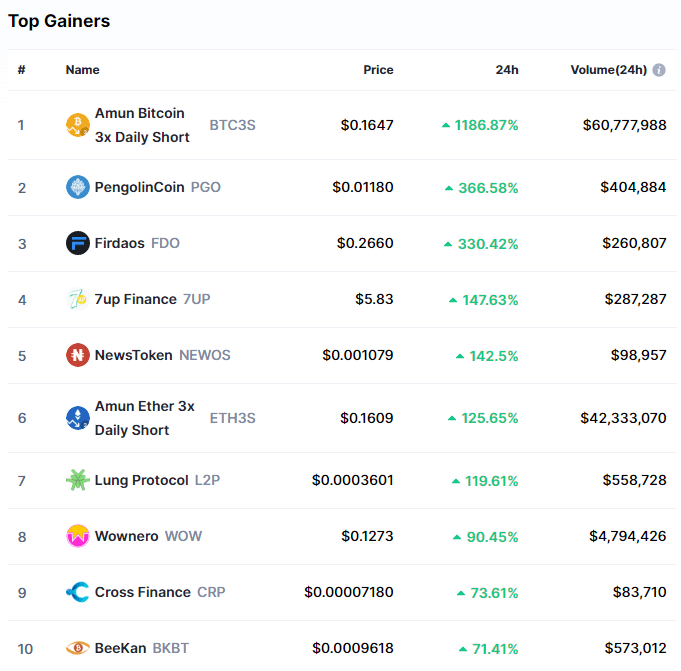
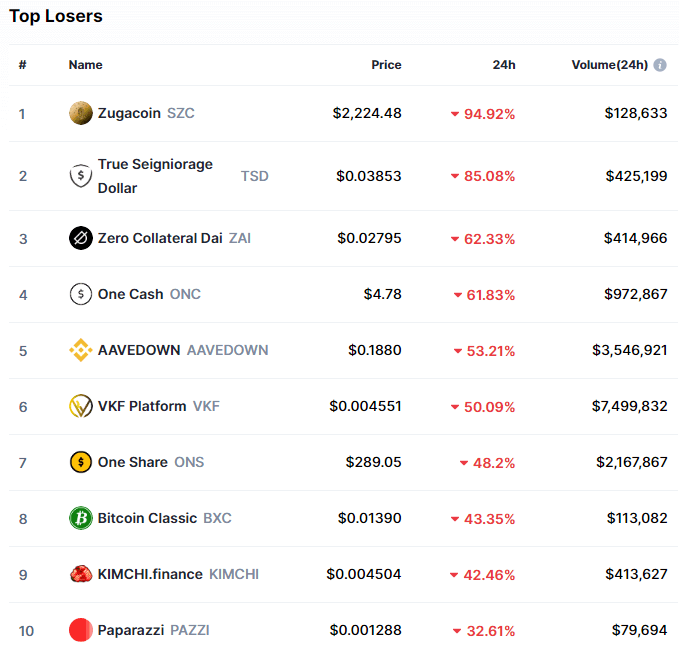
Amun Bitcoin 3x Daily Short gained 1186.87% in the past 24 hours, making it the most prominent daily crypto gainer by far. It is followed by PengolinCoin’s 366.58% and Firdaos’s 330.42% gain. On the other hand, Zugacoin lost 94.92%, making it the most prominent daily loser. It is followed by the True Segniorage Dollar’s loss of 85.08% and Zero Collateral Dai’s loss of 62.33%.

Top 10 24-hour Performers (Click to enlarge)

Bottom 10 24-hour Performers (Click to enlarge)

Bitcoin’s market dominance has moved up very slightly since our last report, with its value currently being 68.7%. This value represents a 0.1% difference to the upside than the value it had when we last reported.

Daily Crypto Market Cap Chart

The cryptocurrency sector’s capitalization has increased since we last reported, with its current value being $964.21 trillion. This represents a $58.14 billion increase when compared to our previous report.

_______________________________________________________________________

What happened in the past 24 hours?

_______________________________________________________________________

_______________________________________________________________________

Technical analysis

_______________________________________________________________________

Bitcoin

Bitcoin managed to stop its descending move and push up slightly after pulling back to the $30,000 mark. The largest cryptocurrency by market cap has (on decreasing volume) seen a price increase to just below the $36,640 level. Many speculate that, while the drop was considered very healthy overall, the institutions bought even more BTC, which brought its price up without affecting the volume as much.

However, BTC/USD doesn’t seem like it currently has the strength to pass the $36,640 level, which may cause another downturn.

BTC/USD 1-hour chart

Bitcoin’s technicals on the daily and weekly time-frame are completely bullish. However, its monthly overview shows slightly less bullishness, while its 4-hour chart is completely bearish.

BTC/USD 1-day Technicals

Technical factors (1-hour Chart):

  • Price is between its 50-period EMA and its 21-period EMA
  • Price is near its middle Bollinger band
  • RSI is neutral (54.63)
  • Volume is descending to average

Key levels to the upside:          Key levels to the downside:

1: $36,640                             1: $33,200

2: $40,000                             2: $30,640

3: $42,000                             3: $27,960

Ethereum

Ethereum has once again matched Bitcoin in direction after hitting the $907 support level, and changed its price direction by pushing to the upside. The second-largest cryptocurrency by market cap is back at its peak from yesterday and seems like it cannot pass $1,129 with conviction at the moment.

Ethereum’s 21-hour and 50-hour moving averages play a major role and should be taken into account when looking for support or resistance levels.

ETH/USD 1-hour Chart

Ethereum’s technicals on the daily and weekly time-frame are completely bullish. However, its monthly overview shows slightly less bullishness, while its 4-hour chart is completely bearish.

ETH/USD 1-day Technicals

Technical Factors (1-hour Chart):

  • Price is between its 50-period and its 21-period EMA
  • Price is between its middle and top Bollinger band
  • RSI is neutral (53.69)
  • Volume is descending to average

Key levels to the upside:          Key levels to the downside:

1: $1,129                               1: $1,060.5

2: $1,211                               2: $1,047.5

3: $1,226.5                             3: $992

Litecoin

Even though Litecoin did follow Bitcoin’s price direction, it did so with less intensity, causing it to ultimately be in the red for the day. Its price is now at a major crossroads, as it is fighting for the $142.1 level. This pivot point will decide whether the price will immediately push towards the upside or downside.

Litecoin has created a strong resistance level near the $150 mark, and traders should pay great attention to it when trading.


LTC/USD 1-hour Chart

Litecoin’s technicals on the daily and monthly time-frame are completely bullish. However, its weekly overview shows slightly less bullishness, while its 4-hour chart is completely bearish.

LTC/USD 1-day Technicals

Technical factors (1-hour Chart):

  • Its price is between its 50-period EMA and its 21-period EMA
  • Price between its middle and bottom Bollinger band
  • RSI is neutral (50.33)
  • Volume is descending to average levels

Key levels to the upside:          Key levels to the downside:

1: $161.5                               1: $142.1

2: $181.3                               2: $128.42

3: $186.3                               3: $114.75

Categories
Crypto Market Analysis

Daily Crypto Review, Jan 11 – Crypto Sector Plummets as BTC Drops to $32k

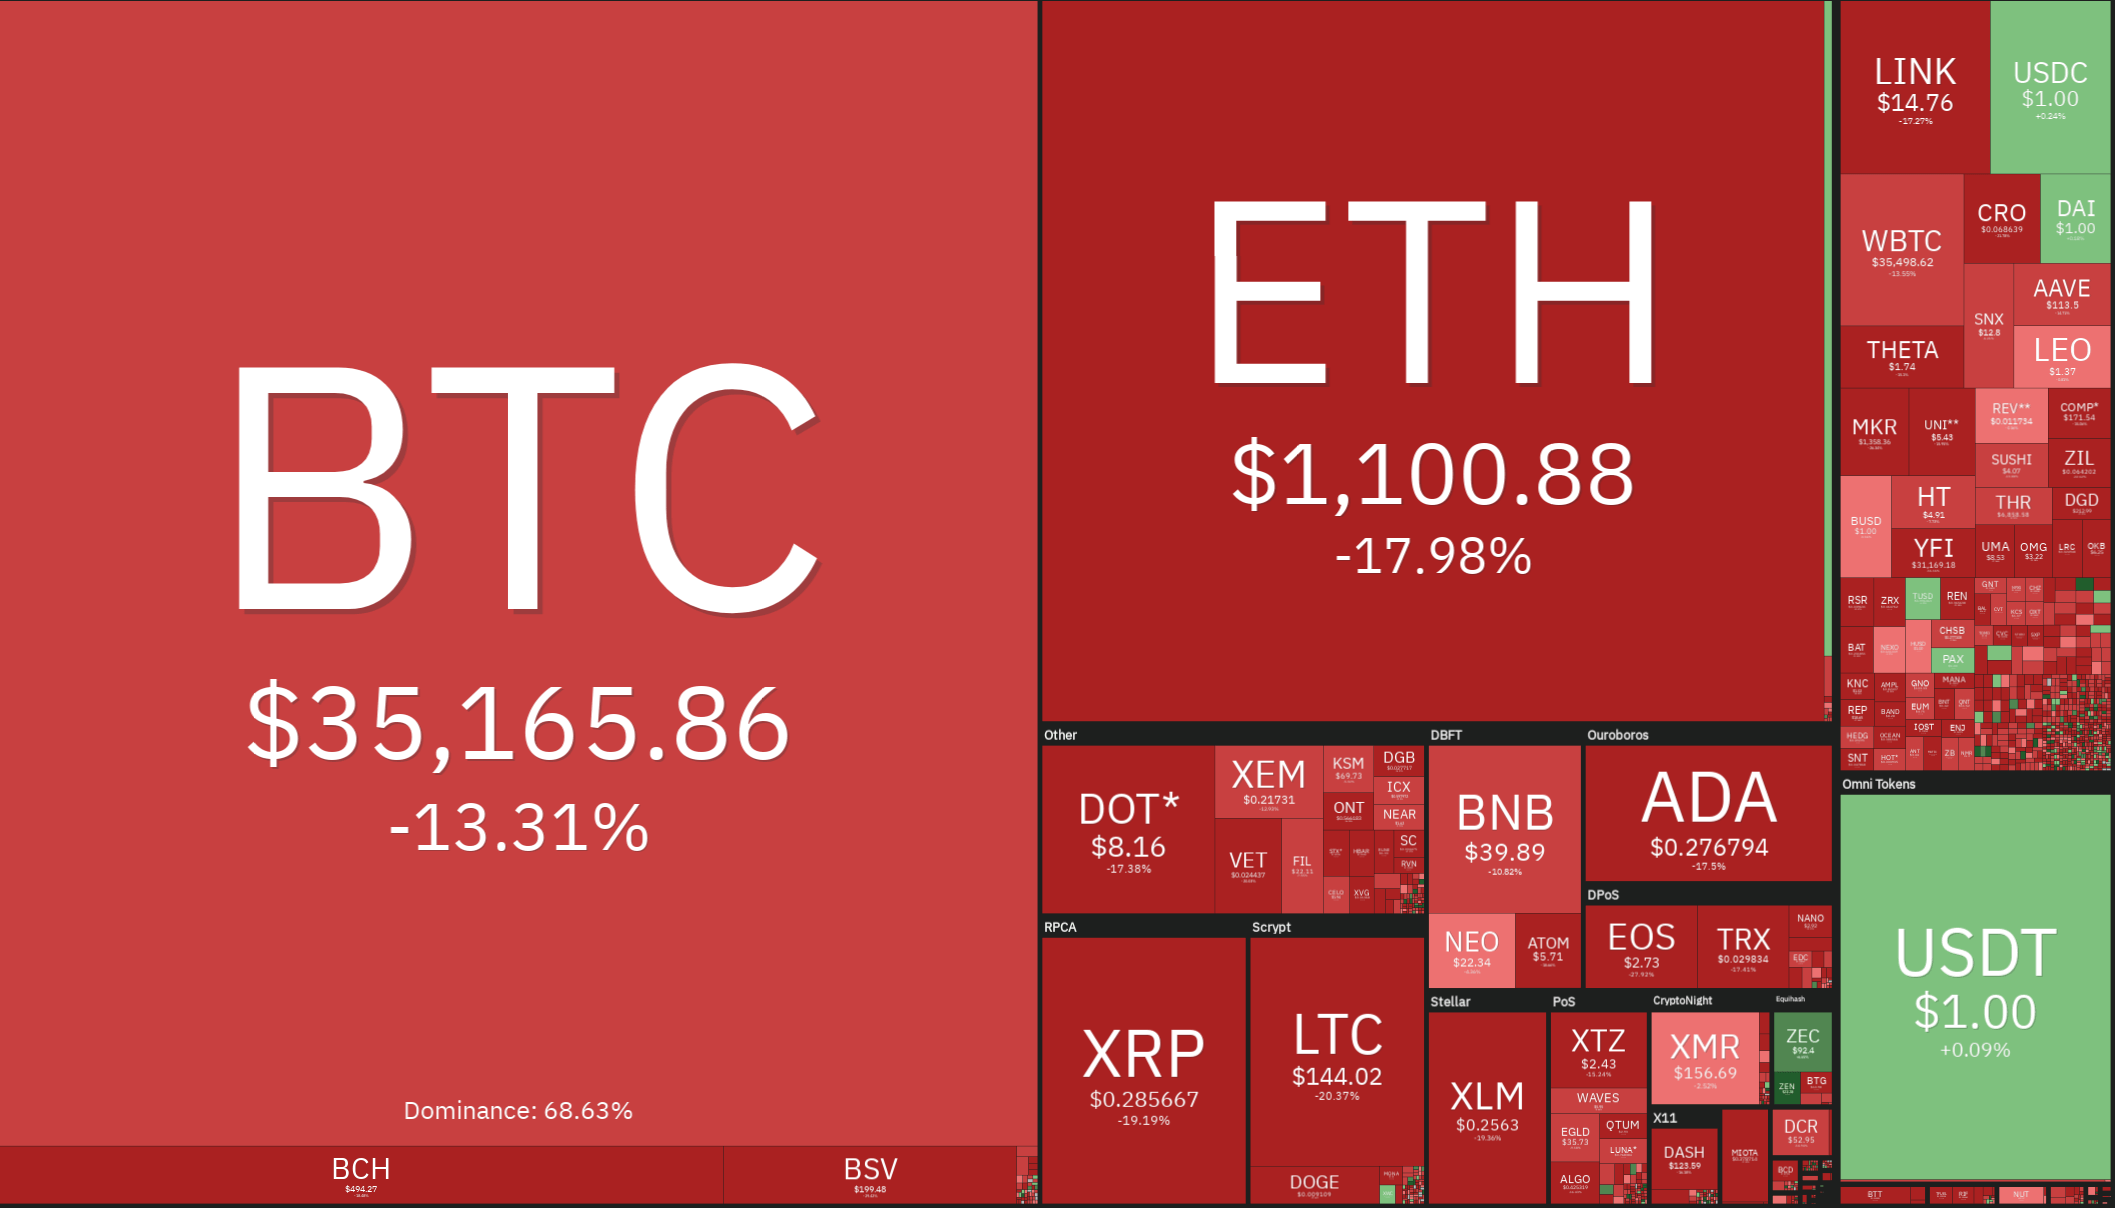
The crypto sector experienced dipped over $100 billion in market cap as Bitcoin, and the rest of the market plummeted. Bitcoin is currently trading for $35,165, representing a decrease of 13.31% compared to yesterday’s value. Meanwhile, Ethereum’s price has dropped up to 20.64% on the day, while LTC lost 23.04% of its value.

Daily Crypto Sector Heat Map

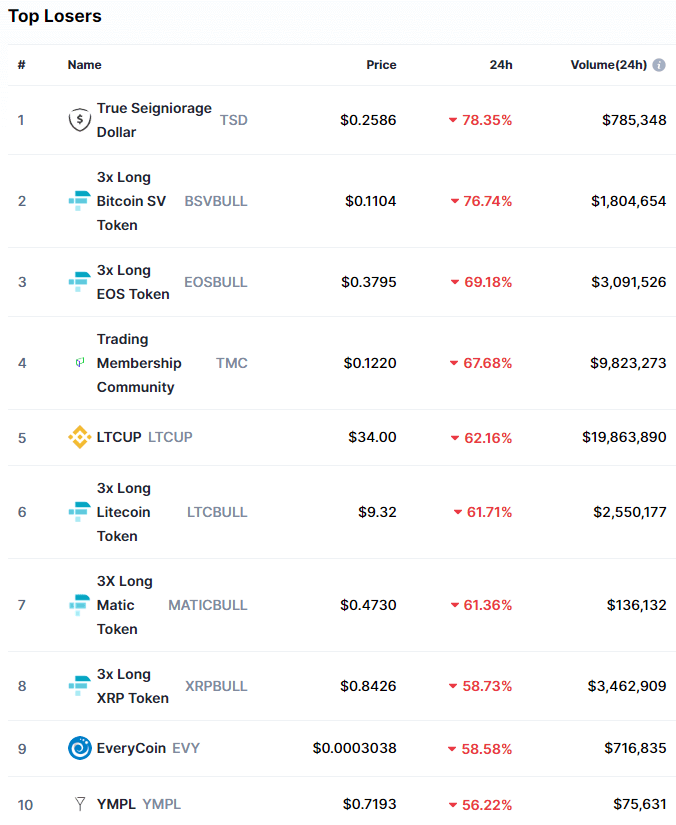
Foglory Coin gained 589.61% in the past 24 hours, making it the most prominent daily crypto gainer by far. It is followed by NewsToken’s 175.33% and BELIEVER’s 166.3% gain. On the other hand, True Seigniorage Dollar lost 78.35%, making it the most prominent daily loser. It is followed by the 3x Long Bitcoin SV Token’s loss of 76.74% and 3x long EOS Token’s loss of 69.18%.

Top 10 24-hour Performers (Click to enlarge)

Bottom 10 24-hour Performers (Click to enlarge)

Bitcoin’s market dominance has moved down over a percent since our last report, with its value currently being 68.6%. This value represents a 1.2% difference to the upside than the value it had when we last reported.

Daily Crypto Market Cap Chart

The cryptocurrency sector capitalization has decreased slightly since we last reported, with its current value being $906.07 1,03 trillion. This represents a $2 billion decrease when compared to our previous report.

_______________________________________________________________________

What happened in the past 24 hours?

_______________________________________________________________________

_______________________________________________________________________

Technical analysis

_______________________________________________________________________

Bitcoin

Bitcoin has had an interesting weekend, with its price plummeting in recent hours. Its price dipped to the lows of $32,330 just a few hours ago as major buy positions got liquidated. The largest cryptocurrency by market cap slowly fell below the 21 and 50 moving averages, confirmed its position below then, and then headed straight to the downside with almost no pushback.

However, bulls picked up the pace and are currently fighting for the $35,000 level. Investors used this as a buying/accumulation opportunity, while most traders got liquidated (both short and long positions due to the sudden volatility).

BTC/USD 1-hour chart

Bitcoin’s technicals on the daily, weekly, and monthly time-frame show a tilt towards the buy-side with no or slight signs of neutrality, while its 4-hour overview shows a slight tilt towards the sell-side.

BTC/USD 1-day Technicals

Technical factors (1-hour Chart):

  • Price is below both its 50-period EMA and its 21-period EMA
  • Price is near its bottom Bollinger band
  • RSI is near the oversold territory (37.28)
  • Volume is above average

Key levels to the upside:          Key levels to the downside:

1: $36,640                             1: $33,200

2: $40,000                             2: $30,640

3: $42,000                             3: $27,960

Ethereum

Ethereum matched Bitcoin in direction, but did so with increased intensity. The second-largest cryptocurrency by market cap dipped over 20% on the day as its price fell to just above $1,000. This level seems to have held quite nicely, creating space for Ether to recover.

Ethereum is now trading above the $1,060.5 support level and shows no signs of falling again. However, Bitcoin’s movement will greatly affect the future price direction of ETH.


ETH/USD 1-hour Chart

Ethereum’s technicals on the daily, weekly, and monthly time-frame show a tilt towards the buy-side with no or slight signs of neutrality, while its 4-hour overview shows a slight tilt towards the sell-side.

ETH/USD 1-day Technicals

Technical Factors (1-hour Chart):

  • Price is below both its 50-period and its 21-period EMA
  • Price is near its bottom Bollinger band
  • RSI is near the oversold (31.12)
  • Volume is significantly above-average

Key levels to the upside:          Key levels to the downside:

1: $1,129                               1: $1,060.5

2: $1,211                               2: $1,047.5

3: $1,226.5                             3: $992

Litecoin

Litecoin was one of the major gainers today as well, with its price dropping from $172 all the way down to $124. While bulls did pick up the pace and returned its price to the ~$140 zone, Litecoin is still fighting to maintain its position and tackle the $142.1 level.

Litecoin seemingly got hit the hardest out of the three cryptocurrencies, with its price position still being fairly uncertain. This could prove to be a trading opportunity as the cryptocurrency might make a move independent of Bitcoin’s move in the short future (if Bitcoin itself doesn’t move first).


LTC/USD 1-hour Chart

Litecoin’s technicals on the daily, weekly, and monthly time-frame show a tilt towards the buy-side with slight signs of neutrality, while its 4-hour overview shows a strong tilt towards the sell-side.

LTC/USD 1-day Technicals

Technical factors (1-hour Chart):

  • Its price is currently below both its 50-period EMA and its 21-period EMA
  • Price near its bottom Bollinger band
  • RSI is in the oversold territory (29.68)
  • Volume is on above-average levels

Key levels to the upside:          Key levels to the downside:

1: $161.5                               1: $142.1

2: $181.3                               2: $128.42

3: $186.3                               3: $114.75

Categories
Crypto Market Analysis

Daily Crypto Review, Jan 8 – Bitcoin Continues Its Rise as it Breaks the $40k Mark Briefly

The crypto sector pushed even higher as Bitcoin passed the $40,000 mark and created a new all-time high. Bitcoin is currently trading for $39,094, representing an increase of 5.35% compared to yesterday’s value. Meanwhile, Ethereum’s price has decreased by 1% on the day, while XRP gained 23.53% of its value.

Daily Crypto Sector Heat Map

COVER Protocol gained 2124.46% in the past 24 hours, making it the most prominent daily crypto gainer by far. It is followed by KIMCHI.finance’s 1159.97% and TAI’s 265.52% gain. On the other hand, Stand Share lost 74.11%, making it the most prominent daily loser. It is followed by the Receive Access Ecosystem’s loss of 61.71% and CY Finance’s loss of 56.34%.

Top 10 24-hour Performers (Click to enlarge)

Bottom 10 24-hour Performers (Click to enlarge)

Bitcoin’s market dominance has moved up half a percent since our last report, with its value currently being 69.8%. This value represents a 0.5% difference to the upside than the value it had when we last reported.

Daily Crypto Market Cap Chart

The cryptocurrency sector capitalization has decreased slightly since we last reported, with its current value being $1,03 trillion. This represents a $2 billion decrease when compared to our previous report.

_______________________________________________________________________

What happened in the past 24 hours?

_______________________________________________________________________

_______________________________________________________________________

Technical analysis

_______________________________________________________________________

Bitcoin

Bitcoin has continued moving up, with its price surpassing the $38,000 and $39,000 mark without much problem. The largest cryptocurrency by market cap reached as high as $40,402.5 level before crashing down as bulls could not sustain the price. The price instantly dipped to $36,388 but quickly recovered to the $39,000 area, where it is consolidating at the moment.

Bitcoin has positioned itself for another push towards the upside as it quickly found support in the 50-hour moving average, proving that it doesn’t even need to dip to the horizontal support levels to stabilize itself.


BTC/USD 4-hour chart

Bitcoin’s technicals on the 4-hour, daily, and weekly chart show a tilt towards the buy-side with no signs of neutrality or bearishness. On the other hand, its monthly overview shows slight bearishness in the oscillator sector opposing the overall bullishness.

BTC/USD 1-day Technicals

Technical factors (4-hour Chart):

  • Price is above both its 50-period EMA and its 21-period EMA
  • Price is between its middle and top Bollinger band
  • RSI is in the overbought territory (70.36)
  • Volume is above average

Key levels to the upside:          Key levels to the downside:

1: $40,402                             1: $38,140

2: $43,000                             2: $36,740

3: $46,500                             3: $35,610

Ethereum

Ethereum followed Bitcoin to the upside, pushing its price above its previous resistance levels and up to as high as $1292. Just like Bitcoin, Ethereum instantly dipped to $1,140 but quickly recovered. However, this is where the high correlation with Bitcoin ends, as Ethereum didn’t recover its recent highs but rather lost quite a bit of its value.

While it has recovered since the price dip, Ethereum is now right below the $1,211 resistance level. The cryptocurrency has a high possibility of passing it even if Bitcoin remains stagnant. Still, any moves that would contest the next resistance level would have to be backed by the largest cryptocurrency by market cap.


ETH/USD 1-hour Chart

Ethereum’s technicals on the daily time-frame show an overall bullish tilt with no hints of neutrality. On the other hand, the monthly, weekly, and 4-hour time-frames show some signs of neutrality or even bearishness.

ETH/USD 1-day Technicals

Technical Factors (4-hour Chart):

  • Price is above its 50-period and at its 21-period EMA
  • Price is near its middle Bollinger band
  • RSI has left the overbought area (63.27)
  • Volume is significantly above-average

Key levels to the upside:          Key levels to the downside:

1: $1,292                               1: $1,211

2: $1,420                               2: $1,180

3: $1,500                               3: $1,092

Litecoin

Litecoin followed the market as well, pushing its price further up and breaking its previous resistance level of $174.5. However, while LTC did manage to break this level and post a new high of $181.25 for a moment, the price was unsustainable, resulting in a classic price drop, followed by a failed attempt of recovering (the moment when LTC hit the $174.5 level after dropping below it) acting as a confirmation of a price drop, and then a full-on retracement towards the downside.

Litecoin has bounced off of the $152.25 level beautifully and is now attempting to pass the 50-hour and 21-hour moving averages and continue its move up.


LTC/USD 1-hour Chart

Litecoin’s technicals on the 4-hour, daily, and weekly time-frame are bullish but show some neutrality or even bearishness. On the other hand, its monthly overview is completely bullish.

LTC/USD 1-day Technicals

Technical factors (4-hour Chart):

  • Its price is currently above its 50-period EMA and at its 21-period EMA
  • Price at its middle Bollinger band
  • RSI is neutral (54.95)
  • Volume is on above-average levels

Key levels to the upside:          Key levels to the downside:

1: $174.5                               1: $163.7

2: $181.3                               2: $155.25

3: $195.5                               3: $149.3


Categories
Crypto Market Analysis

Daily Crypto Review, Jan 7 – Crypto Sector Market Cap Over $1 Trillion as BTC Approaches the $40k Mark

Most of the cryptocurrency sector ended up in the green as Bitcoin passed $38,000. Another thing to mention is that the overall industry market cap has reached past $1 trillion for the first time in the history of cryptocurrencies. Bitcoin is currently trading for $38,400, representing an increase of 10.78% compared to yesterday’s value. Meanwhile, Ethereum’s price has increased by 7.78% on the day, while XRP skyrocketed, gaining 46.55% of its value.

Daily Crypto Sector Heat Map

X Infinity gained 896.37% in the past 24 hours, making it the most prominent daily crypto gainer by far. It is followed by 7up Finance’s 298.93% and EveryCoin’s 278.57% gain. On the other hand, COVER Protocol lost 99.48%, making it the most prominent daily loser. It is followed by UniMex’s loss of 97.1% and Team Heretics Fan Token’s loss of 91.66%.

Top 10 24-hour Performers (Click to enlarge)

Bottom 10 24-hour Performers (Click to enlarge)

Bitcoin’s market dominance has moved down slightly since our last report, with its value currently being 68.6%. This value represents a 0.7% difference to the downside than the value it had when we last reported.

Daily Crypto Market Cap Chart

The cryptocurrency sector capitalization skyrocketed and passed the one trillion mark since we last reported, with its current value being $1,005 trillion. This represents a $33.51 billion increase when compared to our previous report.

_______________________________________________________________________

What happened in the past 24 hours?

_______________________________________________________________________

_______________________________________________________________________

Technical analysis

_______________________________________________________________________

Bitcoin

Bitcoin continued the upward trajectory and pushed past the previous all-time high with confidence, reaching a new high of $38,510 at one point. While the price did retrace after hitting the 37,800 at one point, but the 50-hour moving average created strong support, and BTC pushed back up to contest the all-time high level once again.

As we have mentioned many times, shorting of any kind and trading against the overall trend is most likely not optimal, and traders might find a good opportunity to long BTC each time it breaks the all-time high, as this is when it gets a large influx of buyers.

BTC/USD 1-hour chart

Bitcoin’s short-term technicals (4-hour and daily) are completely bullish, while its long-term overview is a bit more tilted towards neutrality.

BTC/USD 1-day Technicals

Technical factors (4-hour Chart):

  • Price is above both its 50-period EMA and its 21-period EMA
  • Price is near its top Bollinger band
  • RSI is in the overbought territory (72.04)
  • Volume is above average

Key levels to the upside          Key levels to the downside

1: $37,800                                 1: $35,880

2: $40,000                                 2: $34,800

3: $43,220                                 3: $33,100

Ethereum

Ethereum’s chart looks pretty similar to Bitcoin’s, as they both moved to the upside in the same manner. The second-largest cryptocurrency by market cap pushed past many support levels and reached $1,225 before descending slightly. Alongside Bitcoin’s move to new all-time highs, this move contributed the most to the overall crypto sector market cap passing the $1 trillion mark.

Ethereum is currently trading within a narrow range, bound by $1,169 to the downside and $1,211 to the upside. If ETH decides to move up, the next most likely resistance level will be the $1,341.5 level. If, however, it breaks this range to the downside, it has many support levels.

ETH/USD 1-hour Chart

Ethereum’s technicals on the daily, weekly, and monthly time-frames are fully tilted towards the buy-side, while its 4-hour technicals are slightly more neutral.

ETH/USD 1-day Technicals

Technical Factors (4-hour Chart):

  • Price is above both its 50-period and its 21-period EMA
  • Price is at its top Bollinger band
  • RSI is in the overbought area (73.41)
  • Volume is significantly above-average

Key levels to the upside          Key levels to the downside

1: $1,211                                    1: $1,169

2: $1,341.5                                 2: $1,080

3: $1,425                                    3: $1,050

Litecoin

Litecoin increased in price as well, but while its chart looks similar to Bitcoin’s and Ethereum’s, it’s important to notice that it did not break the high it made on Jan 4. In fact, Litecoin almost got to the $174.5 level but quickly pulled back to $165.

Litecoin found strong support in its 50-hour moving average, which held it above $165 and kept it from possibly breaking $163.7 to the downside.

Litecoin’s next move will most likely be highly dependent on Bitcoin’s short-term movement.

LTC/USD 1-hour Chart

Litecoin’s technicals are fully bullish on every single time frame and vary from “buy” to “strong-buy” indicators.

LTC/USD 1-day Technicals

Technical factors (4-hour Chart):

  • Its price is currently above both its 50-period EMA and its 21-period EMA
  • Price between its middle and top Bollinger band
  • RSI is nearing the overbought area (63.82)
  • Volume is above-average but descending

Key levels to the upside          Key levels to the downside

1: $163.7                                      1: $155.25

2: $174.5                                      2: $149.3

3: $195.5                                      3: $143.5


Categories
Crypto Market Analysis

Daily Crypto Review, Jan 6 – Bitcoin Retraces after Creating a New All-Time High; Sector in the Green

Most of the cryptocurrency sector ended up in the green as Bitcoin pushed towards the upside and created a brand new all-time high. Bitcoin is currently trading for $34,801, representing an increase of 12.63% compared to yesterday’s value. Meanwhile, Ethereum’s price has increased by 9.47% on the day, while LTC gained 6.53% of its value.

Daily Crypto Sector Heat Map

Foglory Coin gained 3809.54% in the past 24 hours, making it the most prominent daily crypto gainer by far. It is followed by COVER Protocol’s 2102.06% and Birdchain’s 683.22% gain. On the other hand, MINDOL lost 74.94%, making it the most prominent daily loser. It is followed by Scanetchain loss of 71.12% and XLMDOWN’s loss of 55.53%.

Top 10 24-hour Performers (Click to enlarge)

Bottom 10 24-hour Performers (Click to enlarge)

Bitcoin’s market dominance has moved up slightly since our last report, with its value currently being 69.3%. This value represents a 1.1% difference to the upside than the value it had when we last reported.

Daily Crypto Market Cap Chart

The cryptocurrency sector capitalization has increased over 100 billion since we last reported, with its current value being $967.49 billion. This represents a $122.12 billion decrease when compared to our previous report.

_______________________________________________________________________

What happened in the past 24 hours?

_______________________________________________________________________

_______________________________________________________________________

Technical analysis

_______________________________________________________________________

Bitcoin

Bitcoin has had another amazing bull run, with its price pushing from just below $30,000 all the way up to $35,879, setting a brand new all-time high. However, this is where the price hit a wall, and Bitcoin started retracing. The largest cryptocurrency by market cap is now trading right below the previous all-time high of $34,800 and is seemingly going further down.

With the volume being as high as it is, the most does not seem like it’s done yet. Traders should pay attention to how the price reacts to certain levels.

BTC/USD 4-hour chart

Bitcoin’s technicals show a strong tilt towards the buy-side with some neutral characteristics, with only the 4-hour time-frame showing full bullish tilt.

BTC/USD 1-day Technicals

Technical factors (4-hour Chart):

  • Price is slightly above both its 50-period EMA and its 21-period EMA
  • Price is near its top Bollinger band
  • RSI is near the overbought territory (65.11)
  • Volume is above average

Key levels to the upside          Key levels to the downside

1: $34,800                                 1: $30,807

2: $35,000                                 2: $28,337

3: $35,890                                 3: $26,340

Ethereum

Ethereum also moved to the upside, with its price slowly but surely going from $975 all the way up to $1,139 before retracing slightly. Its move, however, didn’t seem as forced as Bitcoin’s.
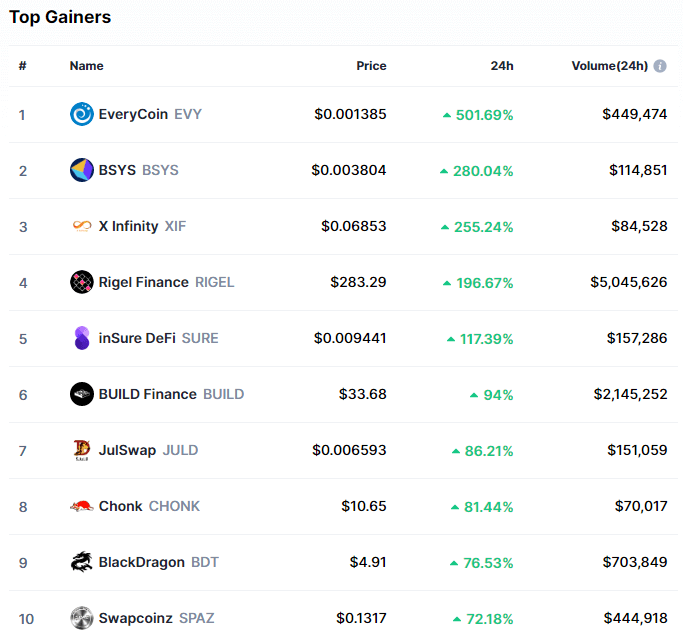
While the overall sentiment around Ethereum is bullish, the fact that it hit nearly the same high three times without passing it could indicate a possible short-term top and a retracement.

Traders should pay great attention to the area around above $1,125 and how ETH reacts to it.
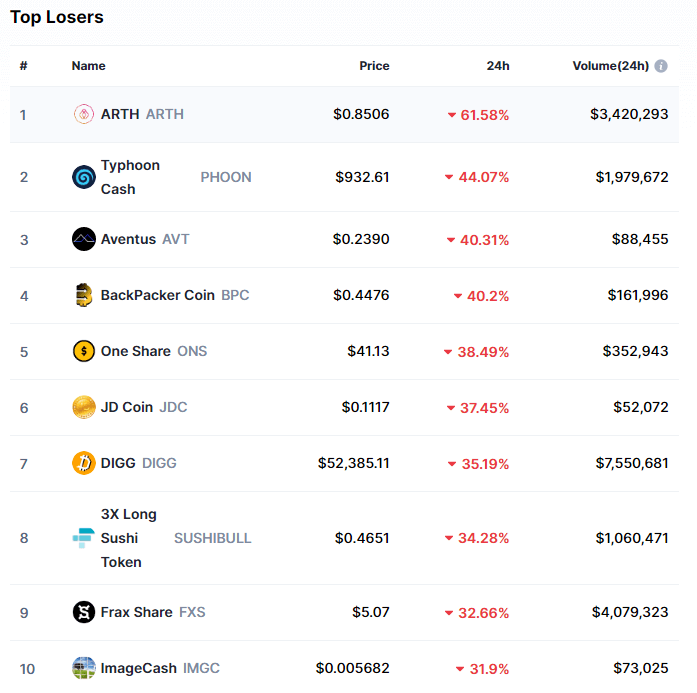
ETH/USD 1-hour Chart

Ethereum’s technicals on the daily and weekly time-frames show an overall bullish tilt with no hints of neutrality coming from oscillators. On the other hand, the monthly and 4-hour time-frames show some signs of neutrality or even bearishness.

ETH/USD 1-day Technicals

Technical Factors (4-hour Chart):

  • Price is above both its 50-period and its 21-period EMA
  • Price is between its middle and top Bollinger band
  • RSI is in the overbought area (72.01)
  • Volume is significantly above-average

Key levels to the upside          Key levels to the downside

1: $1,047                                     1: $1,009

2: $1,080                                     2: $960

3: $1,169                                      3: $932

Litecoin

Litecoin moved in a much more narrow range than Bitcoin and Ethereum. Its price slowly moved towards the upside (with one hiccup that brought its price from $163 to $155) and reached as high as $165. However, this move didn’t create new highs or approach the recent ones either.

At the moment, Litecoin looks like a cryptocurrency that mirrors Bitcoin’s moves, but with less volatility. While this brings a bit of perceived safety, the truth is that the profit potential is also greatly diminished.

LTC/USD 1-hour Chart

Litecoin’s technicals on the 4-hour and monthly time-frame are completely bullish, while its daily and weekly overviews show some oscillators having bearish values.

LTC/USD 1-day Technicals

Technical factors (4-hour Chart):

  • Its price is currently above both its 50-period EMA and its 21-period EMA
  • Price between its middle and top Bollinger band
  • RSI is nearing the overbought area (65.96)
  • Volume is above-average but descending

Key levels to the upside          Key levels to the downside

1: $163.7                                      1: $155.25

2: $174.5                                      2: $149.3

3: $195.5                                   3: $143.5

Categories
Crypto Market Analysis

Daily Crypto Review, Jan 5 – Ethereum Outpaces the Market; Most Cryptos in the Red

Daily Crypto Review, Jan 5 – Ethereum Outpaces the Market; Most Cryptos in the Red

The cryptocurrency sector experienced volatility amongst cryptos as Bitcoin continues its retracement and Ethereum outpaces the market. Bitcoin is currently trading for $31,479, representing a decrease of 4.15% compared to yesterday’s value. Meanwhile, Ethereum’s price has increased by a whopping 11.70% on the day, while XRP gained 1.27% of its value.

Daily Crypto Sector Heat Map

Birdchain gained 1498.92% in the past 24 hours, making it the most prominent daily crypto gainer by far. It is followed by Folgory Coin’s 837.8% and Rewardiqa’s 720.43% gain. On the other hand, Basiscoin Share lost 98.58%, making it the most prominent daily loser. It is followed by Basiscoin Cash’s loss of 90.24% and Mith Cash’s loss of 78.91%.

Top 10 24-hour Performers (Click to enlarge)

Bottom 10 24-hour Performers (Click to enlarge)

Bitcoin’s market dominance has moved down slightly since our last report, with its value currently being 68.2%. This value represents a 0.5% difference to the downside than the value it had when we last reported.

Daily Crypto Market Cap Chart

The cryptocurrency sector capitalization has decreased since we last reported, with its current value being $845.71 billion. This represents a $14.82 billion decrease when compared to our previous report.

_______________________________________________________________________

What happened in the past 24 hours?

_______________________________________________________________________

_______________________________________________________________________

Technical analysis

_______________________________________________________________________

Bitcoin

Bitcoin has possibly ended its retracement and entered sideways trading as its price created a double bottom at the $30,000 mark. However, there was one point where the largest cryptocurrency by market cap dropped as much as 20% and broke $28,000 to the downside, but recovered almost instantly.

BTC is currently right above the $30,807 Fib retracement level and is fighting to stay above it. If it posts a candle that shows it consolidated above this level, we could see another push towards the upside. However, if it breaks the Fib retracement, we could see BTC looking for support at the $30,000 or $29,300 levels.

BTC/USD 4-hour chart

Bitcoin’s technicals are showing a strong tilt towards the buy-side, with only the 4-hour time-frame showing bearish oscillator values.

BTC/USD 1-day Technicals

Technical factors (4-hour Chart):

  • Price is slightly above its 50-period EMA and at its 21-period EMA
  • Price is near its middle Bollinger band
  • RSI is neutral (48.20)
  • Volume is slightly above average

Key levels to the upside          Key levels to the downside

1: $34,800                                 1: $30,807

2: $35,000                                 2: $28,337

3: $36,000                                 3: $26,340

Ethereum

Ethereum is certainly one of the most interesting cryptocurrencies in the last couple of days, with its price going from stagnation to skyrocket mode in a matter of hours. While many thought that the initial push above $1,000 is over and that ETH is destined to retrace below it, the second-largest cryptocurrency by market cap managed to do it again – just one day later.

The cryptocurrency managed to bounce off of one of its numerous support levels and propel its price back above $1,000.

Ethereum is now fighting for the $1,000 level, with its price barely staying above it.

ETH/USD 1-hour Chart

Ethereum’s technicals on all time-frames show an overall bullish tilt with hints of neutrality coming from oscillators.

ETH/USD 1-day Technicals

Technical Factors (4-hour Chart):

  • Price is above both its 50-period and its 21-period EMA
  • Price is near its top Bollinger band
  • RSI has left the overbought area (68.56)
  • Volume is significantly above-average

Key levels to the upside          Key levels to the downside

1: $1,047                                     1: $1,009

2: $1,080                                     2: $960

3: $1,169                                      3: $932

Litecoin

Litecoin ended its 2-day bull run after reaching bull exhaustion at the $174.5 mark, after which it started to consolidate. However, the consolidation phase looks like less of a consolidation phase and more like a fight for the $152 Fib retracement level.

Litecoin is currently losing the battle for $152 –  but even in the case of bears pushing it to the downside, its price has many support anchor points, most notably the zone between $135 and $142.

LTC/USD 1-hour Chart

Litecoin’s technicals on the 4-hour and monthly time-frame are completely bullish, while its daily and weekly overviews show some oscillators having bearish values.

LTC/USD 1-day Technicals

Technical factors (4-hour Chart):

  • Its price is currently above both its 50-period EMA and its 21-period EMA
  • Price is at its middle Bollinger band
  • RSI is neutral (58.54)
  • Volume is above-average

Key levels to the upside          Key levels to the downside

1: $163.7                                      1: $155.25

2: $174.5                                      2: $149.3

3: $195.5                                   3: $143.5


Categories
Crypto Market Analysis

Daily Crypto Review, Jan 4 – Bitcoin Retraces Below $32k, Ether Breaks $1k!

The cryptocurrency sector is trying to find an equilibrium but was mostly volatile in recent days, with BTC retracing slightly and Ethereum skyrocketing towards its all-time highs. Bitcoin is currently trading for $31,796, representing a decrease of 8.08% compared to yesterday’s value. Meanwhile, Ethereum’s price has increased by a whopping 24.61% on the day, while XRP gained 7.37% of its value.

Daily Crypto Sector Heat Map

Scanetchain gained 446.19% in the past 24 hours, making it the most prominent daily crypto gainer by far. It is followed by Amun Ether 3x Daily Long’s 246.1% and Education Ecosystem’s 195.84% gain. On the other hand, Basiscoin Cash lost 96.51%, making it the most prominent daily loser. It is followed by Wownero’s loss of 91.09% and Bridge Finance’s loss of 90.45%.

Top 10 24-hour Performers (Click to enlarge)


Bottom 10 24-hour Performers (Click to enlarge)

Bitcoin’s market dominance has moved down almost two percent since our last report, with its value currently being 68.7%. This value represents a 1.9% difference to the downside than the value it had when we last reported.


Daily Crypto Market Cap Chart

The cryptocurrency sector capitalization has increased greatly since we last reported, with its current value being $860.45 billion. This represents a $97.68 billion increase when compared to our previous report.

_______________________________________________________________________

What happened in the past 24 hours?

_______________________________________________________________________

_______________________________________________________________________


Technical analysis

_______________________________________________________________________

Bitcoin

Bitcoin had continued its move up slowly until Jan 2, when its price skyrocketed and reached as high as $34,800. With this being set as the new all-time high, BTC started retracing and consolidating within a wide range, bound by the all-time high to the upside and $30,807 to the downside.

Any strong pushes were easily foreseen by the gradual increase in volume, which is what traders should pay attention to when trading the largest cryptocurrency by market cap.

BTC/USD 4-hour chart

Bitcoin’s technicals are showing a strong tilt towards the buy-side. However, some of its time-frames show slight neutrality alongside the overall bullishness.

BTC/USD 1-day Technicals

Technical factors (4-hour Chart):

  • Price is slightly above its 50-period EMA and above its 21-period EMA
  • Price is near its middle Bollinger band
  • RSI is neutral (55.04)
  • Volume is slightly above average

Key levels to the upside          Key levels to the downside

1: $34,800                                 1: $30,807

2: $35,000                                 2: $28,337

3: $36,000                                 3: $26,340

Ethereum

Ethereum’s spike could be considered a late response to Bitcoin’s spike, as its price followed in direction but not percentage-wise when BTC pushed towards $35k. However, the second-largest cryptocurrency by market cap skyrocketed in the past hours, reaching as high as $1,169.

This push towards the $1k mark is historic, as the only real upside is the all-time high of $1,420 from Jan 2, 2020.

Ethereum is currently fighting to stay above the $1,000 mark, and its short-term future will be determined by it managing to stay above or retracing below this level.

 ETH/USD 1-hour Chart

Ethereum’s technicals look very much like Bitcoin’s, with the overall tilt being towards the buy-side, with oscillators tilting towards bearishness.

ETH/USD 1-day Technicals

Technical Factors (4-hour Chart):

  • Price is above its 50-period and at its 21-period EMA
  • Price is near its middle Bollinger band
  • RSI is neutral (60.37)
  • Volume is descending from above-average levels

Key levels to the upside          Key levels to the downside

1: $1,047                                     1: $1,009

2: $1,080                                     2: $960

3: $1,169                                      3: $932

Litecoin

Litecoin had an amazing 2-day run as its price increased from $124 all the way up to $175. However, the $175 mark stopped the bulls from reaching any higher, and Litecoin started retracing. The retracement also came as a response to BTC’s retracement, as the two cryptocurrencies are highly correlated.

Litecoin is now struggling to stay above the $155.25 level. However, its short-term price direction will most likely be decided by Bitcoin’s movements, rather than staying above or below any support/resistance levels.

 LTC/USD 1-hour Chart

Litecoin’s technicals on all time-frames are tilted towards the buy-side and show almost no bearish or neutral signs.

LTC/USD 1-day Technicals

Technical factors (4-hour Chart):

  • Its price is currently above its 50-period EMA and at its 21-period EMA
  • Price is at its middle Bollinger band
  • RSI is in the oversold territory (50.57)
  • Volume is currently on below-average levels

Key levels to the upside          Key levels to the downside

1: $163.7                                      1: $155.25

2: $174.5                                      2: $149.3

3: $195.5                                   3: $143.5


Categories
Crypto Videos

Litecoin Gets its Own Visa Debit Card!

Litecoin Gets its Visa Debit Card


The first Litecoin-native Visa debit card is being launched by BlockCard.
The creator of Litecoin, Charlie Lee, said that this is their second attempt at creating a Litecoin-native card as the previous one failed: “We worked with LitePay on a debit card but ultimately failed when they went out of business.”
Lee also made a few distinctions between this Litecoin-native debit card and other cryptocurrency cards that only support Litecoin, but are not Litecoin-native:

“There are other crypto debit cards that are available today, and most of them support Litecoin. However, they only support funding with LTC. This card is natively Litecoin, so funds are kept in Litecoin until you swipe the card.”
Although Litecoiners already have the option to sign up for the card, the service itself will be available only in a few weeks. On a lighter note, Lee clarified his opinion on crypto maximalism, saying that there is no such thing as a “Litecoin maximalist”:

“I don’t think that that even exists. Most Litecoiners support and hold Bitcoin also.”
Users will be able to deposit any of the twelve most popular cryptocurrencies, including all the major stablecoins. According to Lee, somewhere around 300 users have signed up so far. In the meantime, Litecoin has continuously stayed among the top ten cryptocurrencies by market capitalization. It also has one of the biggest followings on social media.

Categories
Cryptocurrencies

Litecoin Core Wallet Review: Features, Pros, Cons, Safety, And Ease Of Use

Litecoin Core is the primary Full node desktop client of the Litecoin network. It was launched in 2011 by the Singapore-based Litecoin Foundation under the stewardship of Charlie Lee, Richards Franklin, and Xinxi Wang. It is one of the few and most effective full-stack blockchain clients available. It will only support the Litecoin cryptocoins, and you need to download the entire blockchain before you can start using it to store the coins and transact.

The Litecoin Foundation is regularly updating the Litecoin Core Wallet and introducing more operational and security features. But how safe and easy to use is the desktop wallet? What are its key features? In this Litecoin Core review, we explain how it works and detail everything else you need to know about this wallet.

We start by looking at its key features:

Key Features:

Full node nature: Most other crypto wallets will only require you to download a light desktop or mobile app. When using Litecoin Core client, however, you have to download the entire blockchain onto your computer. And while this makes it more secure than apps, it is time-consuming and eats up most of your computer space.

Compatible with different OS: The desktop client is highly versatile and compatible with virtually all popular operating systems, including Windows, Linux, and macOS.

Faster transaction processing: The desktop Litecoin client integrates the SegWit protocol used on the Litecoin Blockchain. This integration makes Litecoin transactions initiated on the platform relatively faster and less expensive.

Supports multiple wallets: The most recent update to the Litecoin desktop client introduces multiple wallets. You can now open and host multiple Litecoin wallets on the same desktop wallet.

Security features:

Open source: One of Litecoin Core’s key strengths is that it is built on an open-sourced technology. This implies that it has been vetted and audited by crypto industry experts with possible security loopholes identified and patched. The regular updates provided by the Litecoin Foundation have also become great avenues through which patches to the client are provided.

Highly encrypted: When installing and activating the Litecoin Core wallet, you will be presented with the encryption option. You have the option of encrypting the desktop wallet with a strong multi-character password or not. However, note that you can never recover your private keys should you lose or forget the passphrase.

Physical wallet backup: Litecoin core client makes it possible to back up the entire wallet on an external drive. You are especially encouraged to backup your wallet every time you engage in a transaction that changes your digital asset balances.

Privacy and anonymity guarantee: Litecoin Core integrates a number of features that promote privacy and anonymous transactions. It, for instance, is VPN compatible, ensuring that it helps you mask your IP address when using the desktop wallet. Moreover, you can access the wallet via the highly anonymous Tor Browser.

How to set up a Litecoin Core wallet?

Step 1: Head over to the Litecoin core website. Search for wallets and click on the version that matches your computer’s operating system

Step 2: Download and click on install. Note that downloading and synchronizing the desktop client will take time – be patient.

Step 3: After installation, choose to encrypt the wallet using a strong and multi-character password.

Step 4: Finish the installation process by clicking ‘OK’ on the popup window, after which the wallet shuts down automatically.

Step 4: Reopen the wallet and back it up to a USB device.

Step 5: The desktop client is now set and ready to use.

How to add/receive crypto to your wallet

Step 1: Log in to the Crypto wallet and click on the receive icon.

Step 2: Copy your wallet address and send it to the person sending you Litecoins.

Step 3: You can also have them scan the QR Code address.

Alternatively: Use the request pay option:

Step 1: Click on the ‘Receive’ icon and select ‘Request Payment.’

Step 2: Enter the amounts you wish to receive, the message you wish to send, and the label. Here, the label refers to the name of the individual from whom you wish to receive the coins.

Step 3: Click ‘Receive Payment’ and wait for your coins to reflect in your wallet.

How to send crypto from your desktop client

Step 1: Log in to the Litecoin Core desktop wallet and click on the ‘Send’ icon.

Step 2: On the ‘Pay To’ section, enter the recipient’s wallet address.

Step 3: Enter the number of coins you wish to send.

Step 4: Confirm that these details are correct and hit ‘Send.’

Litecoin Core wallet ease of use

The Litecoin Core desktop client has relatively minimalistic features that make it quite easy to use. Downloading and installing the wallet, though slow, is quite easy and straightforward. Additionally, the wallet features a clean and highly intuitive dashboard that makes it easy to use for both expert crypto traders and beginners. The highly responsive customer support is also ready to walk you through the installation process and guide you on how to interact with the platform.

Litecoin core wallet cost and fees

The Litecoin Core wallet is free to download and install. You will, however, be charged a fee every time you send Litecoin from your wallet. Recent upgrades to the Litecoin Desktop client have introduced a dynamic pricing structure. This gives you the choice of determining the price and speeds at which your Litecoin transactions are fulfilled. Ideally, higher transaction fees translate to faster transaction processing while lower fees often equate to lower transaction speeds.

Plus, unlike most wallets that will automatically deduct the transaction fee from your balance, Litecoin Core desktop client gives you a choice. You can choose to have the fees deducted from either the account balance or the amounts being sent.

Litecoin Core wallet customer support

Litecoin has a readily available customer support team. You can easily connect with Litecoin developers and support teams on their different social media platforms. They regularly post important news and updates on these platforms.

You can also interact with these developers and get assistance from your peers on the Litecoin Core platform.

The website, desktop client, and user platforms are also multilingual. They currently support over 13 international languages, including German, Chinese, English, Russian, Dutch, Polish, and Greek.

What are the pros and cons of the Litecoin core wallet?

Pros:

  • The desktop wallet is relatively safe and embraces multiple security features.
  • Litecoin Core is free and employs a dynamic pricing structure.
  • Help is readily available from the wallet developers via email and social media, as well as from the Litecoin platform users on the platform.
  • Litecoin Core desktop client is also simplistic and easy to use for both beginners and expert crypto traders.
  • You can encrypt the Litecoin client with a passphrase and back it up in an external drive or USB.

Cons:

  • The desktop wallet only supports one digital currency – Litecoin.
  • You need to download the entire Litecoin core blockchain into your desktop if you wish to use the wallet.
  • The wallet has limited operational features.
  • It does not embrace such effective security features as two-factor authentication.

Comparing Litecoin Core desktop client to other crypto wallets

Litecoin Core vs. eToro

Some of the similarities between Litecoin Core desktop client and eToro crypto wallet app are their user-friendliness and inexpensive transaction fees. They, however, are different when it comes to the number of supported cryptocurrencies and integrated security features.

eToro carries the day with regards to the number of supported cryptos. Litecoin can, on the other hand, be said to be more secure as it employs more advanced security features like using open source technology and VPN access.

Bottom line: Is the Litecoin Core wallet safe?

Yes, Litecoin Core desktop client is relatively safe. Since its establishment in 2011, the wallet has been subjected to several technical upgrades, each introducing a new security feature. So far, the Litecoin desktop wallet has employed several highly effective security features. These include open-sourced technology, physical backup, password encryption, VPN/Tor Browser access for improved privacy and anonymity. We, however, observe that the wallet doesn’t employ such security features as two-factor authentication and multi-signature access.

Categories
Forex Assets

‘LTC/USD’ – Understanding The Crypto/Fiat Pair & Trading Costs Involved

Introduction

Cryptocurrencies are traded in pairs by pairing them with a fiat currency. Always, the cryptocurrency is written on the left and the fiat currency on the right. LTC/USD is a cryptocurrency, which is an abbreviation for the Litecoin versus the US Dollar. Like the Bitcoin and Ethereum, Litecoin is extensively traded in the exchange market.

Understanding LTC/USD

The market price of LTCUSD depicts the value of the US Dollar, which is equivalent to 1 Litecoin. It is quoted as 1 LTC per X USD. For example, if the value of LTCUSD is 41.69, then one Litecoin is worth 41.69 US Dollars.

LTC/USD specifications

Spread

Spread is the difference between the bid and the ask price in the market, where bid price is given considered when shorting a pair and ask price when going long on a pair. The varies from broker to broker. It also differs based on the type of execution model used. Below are the spreads for the LTC/USD pair for both ECN & STP accounts.

  • Spread on ECN: 50 pips (0.5 USD)
  • Spread on STP: 60 pips (0.6 USD)

Fee

ECN brokers charge some commission on every position a trader opens and closes. The fee for ECN accounts is about $0.18 per standard lot, which corresponds to 18 pips.

Slippage

Slippage is the difference between the price asked by the user and the price given by the broker. There is this difference due to two reasons – High market volatility & broker’s execution speed.

Trading Range in LTC/USD

Below is the trading range table for the LTCUSD, which represents the minimum, average, and maximum volatilities of a pair for different timeframes using the ATR indicator. These values can prove to be helpful for assessing one’s profit/loss on a trade.

Procedure to assess Pip Ranges

  1. Add the ATR indicator to your chart
  2. Set the period to 1
  3. Add a 200-period SMA to this indicator
  4. Shrink the chart so you can assess a large time period
  5. Select your desired timeframe
  6. Measure the floor level and set this value as the min
  7. Measure the level of the 200-period SMA and set this as the average
  8. Measure the peak levels and set this as Max.

LTC/USD Cost as a Percent of the Trading Range

The cost as a percent of the trading range represents the variation of cost on a trade based on the change in the volatility of the market. And these variations are indicated as a percentage. Using the magnitude of the percentages, we shall determine the ideal times of the day to trade this coin.

ECN Model Account

Spread = 50 | Slippage = 5 |Trading fee = 18

Total cost = Slippage + Spread + Trading Fee = 18 + 50 + 5 = 73

STP Model Account

Spread = 60 | Slippage = 5 | Trading fee = 0Total cost = Slippage + Spread + Trading Fee = 5 + 60 + 0 = 65

Trading the LTC/USD

LTCUSD is a crypto-fiat pair that has got enough volatility and liquidity to trade in the market. LTC is the fourth highest traded coin in terms of volume. However, it is not apt to trade anytime during the day. There are ways through which one reduces their costs for the same trade.

In the above table, if the percentages are high, then the costs are very high and vice versa. So, the cost is more for low volatile markets and less for high volatile markets. If you are a scalper or short-term trader, you may trade when the volatility is high as the profit margin is small, and you can avoid high costs.

Positional traders – these traders usually aim for large movements, and high costs become a little insignificant for their big pip movements. So, such traders may trade when the volatility is around the average values. Finally, it is not advisable to trade during low volatilities because the costs are high, and there is barely any movement in the market.

Slippage is a variable in total costs that can be eliminated by placing orders as ‘limit’ or ‘stop.’ We hope you found this analysis on LTCUSD useful. Stay tuned for more informative content. Cheers.

Categories
Crypto Market Analysis

Daily Crypto Review, Oct 2 – Pullback Day or Dead Cat Bounce?

Yesterday, cryptocurrencies behaved as expected, retracing some of their Monday’s gains. Early morning losses continued. Bitcoin lost 2.47% over its 24-hour value. Most altcoins joined the movement such as Ethereum (4%), Ripple (-4.04%), Bitcoin Cash(-4.47%), EOS(-4.57%), Bitcoin SV(-6.15%)  and TRON (-5.61%).

The market cap descended to $218.5 billion, while the 24H volume was $26 billion, as seen in the figure below.

The current market dominance is as follows:

  • BTC:67.55%
  • ETH:8.62%
  • XRP:4.85%
  • BCH:1.82%
  • LTC:1.60%
  • EOS:1.24%
  • Others:15%

The Heat map here, shoes that, as usual, the whole sector moves with almost perfect correlation.

What happens

Ethereum-bases dApp FairWin has collapsed after the exposure of a vulnerability in its smart contract. Researches found the platform admins could drain the entire balance in the dApp easily, an $8 million worth of ETH stored in the platform. Researchers found $250,000 was stolen in a previous version. Source: Medium.com.

According to an article by condesk.com, major Libra backers Visa and Mastercard are re-thinking its participation in this digital project. Libra has been the trigger for regulators to start worrying for the irruption of digital assets and Libra has been opposed by European financial authorities saying Libra could destabilize the Euro, while the US Congress has demanded a complete halt on its development.

The Federal Reserve injects the USD worth the entire crypto market cap in days according to this article by beincrypto.com. The last one is said to add $162 billion to the total USD supply. US FED noted that it is a temporary measure.


Technical Analysis


Bitcoin


Bitcoin’s price has been losing ground after making a double top at $8,519. The MACD is dangerously approaching a bearish transition, while the price is currently sitting on the mean line of the Bollinger Band, at 8,200. That was our expectations yesterday. Thus, nothing to worry about unless weakness continues and the price keeps moving to the lower side of the Bollinger bands and challenge the $8,000 again.


Ethereum


Ethereum is moving in an ascending channel, a weak form of trending. Its price made a high at $185, then during the latest 4H candles has been retracing. At the moment of this writing, the price was held by the mid-line of the Bollinger Bands. MACD is also close to a bearish crossing. The figure created by the latest price action suggests the entire channel is a consolidation of the significant drop made on September 24. Short-term, if the price holds, we see a new test of the $185  high, although the price might go visiting the lower side of the channel.


Ripple


Ripple has retraced more than 50% of the large candlestick made on Sept. 30. Now the price is touching the upper border of the band where it had been ranging before that bullish candle. That may be a supply zone of people who wanted to go long that day but were late.  That means a bounce off of this level is likely. If that does not happen, then the bullish candle was just a trap for bulls, and the movement is negated.


Litecoin


Litecoin is starting to show signs of buying interest. The price has been held by the Bollinger mean line and now has headed up. MACD is bullish, also. The movement is still feeble, and $57 acts as a resistance level, so to confirm a bullish scenario we would like to ask for a close above that level.


Categories
Crypto Market Analysis

Litecoin at the Crossroads, Potential Play Ahead

  • Market Cap: $3,127,694,363
  • Max Supply: 84,000,000
  • Circulating Supply: 58,233,103
  • Daily Volume: $253,712,183

Litecoin is at the crossroads

Litecoin has hit the biggest support line so far, and kept above it. However, the downwards trend line is reaching the support line as well, and they will cross on the 24th of September. What will happen?


The most likely scenario

There is an extremely high probability of Litecoin breaking out before 24th of September, and the break has an extremely high likelihood of pushing upwards. Litecoin has been following BTC’s patterns for quite a while, but has still been a worse-performing asset than BTC itself. This might change soon. A proper long-short portfolio should have a Litecoin long position for the next 20 days. However, we do suggest a long-short portfolio with another asset being shorted for the same amount of equity in order to negate crypto market movements.

The less likely scenario

There is, of course, the other part of the story. Litecoin might break to the downside if the buyers do not rally up. Even if it’s highly unlikely, there is a chance for this to happen. If Bitcoin does go down in the next 20 days, Litecoin has high probability of following down its path. This is why having a long-short portfolio during the “bear market” is crucial. All Cryptocurrencies are highly correlated and we need to either only trade with the general trend of the market, or take long-short positions with extreme caution.

Final word

 Most financial advisors and gurus are losing money in Crypto these days simply due to them not being educated in properly managing risk. This is why Forex.Academy is trying to show people that portfolio and risk management is just as important as creating trade ideas. In the case of Litecoin these days, if the market goes up or stays the same, Litecoin will outperform it. If it goes down, Litecoin will outperform it to the downside as well. Either way, this play on LTC is a market play.


Categories
Crypto Market Analysis

Daily Crypto Update 22.06.2018 – Big Bear Field

The market is completely red with losses of double digits in many currencies in a drop that was coming due to the pressure that the market has had all week. The market is showing its volatility again and I see there are some effects (not proven) according to news from Japan. The Financial Services Agency (Regulator in the country) has ordered six exchanges to improve their businesses and to improve their anti-money laundering measures. Some of them stopped adding new clients and started to review the identities of existing account holders. The pressure continues in the crypto field and we will surely see new minimums in many of the cryptos before seeing a reversal.


General Overview


Market Cap: $261.006.460.133

24h Vol: $14.560.479.309

BTC Dominance: 40.7%

The Market Capitalization dropped 20B in just 24 hours which shows the power of sellers at the moment, I think the market will have another bearish boost before Sunday where BTC could lose its $6000 value and very probably will test the $5,700


News


Japan Slaps 6 Licensed Cryptocurrency Exchanges with Business Improvement Orders
Japan’s financial regulator has targeted six licensed cryptocurrency exchanges to issue business improvement orders, ramping up its scrutiny of the
sector.

Breaking: Mt. Gox Case Moved to Civil Rehabilitation, Creditors May Be Paid in Crypto
Creditors holding bitcoins at infamous cryptocurrency exchange Mt. Gox may recover their funds, after all, a court has ruled.

NANO Issues Alert on Android App Vulnerability, Urges Users to Move Funds
NANO, which recently rebranded from RaiBlocks in January 2018, has issued a statement alerting users about a vulnerability in their android wallet, urging them to move their funds to a new wallet. This applies to anyone who generated a wallet seed using the NANO android wallet, which was released just a few hours ago.

Japan’s Biggest Cryptocurrency Exchange Suspend New Accounts amid Stricter Regulation
Merely three days after the Japanese government and local financial authorities requested cryptocurrency exchanges improve their infrastructures, bitFlyer, the country’s biggest cryptocurrency exchange, has suspended the registration of new accounts to overhaul its Anti-Money Laundering (AML) and Know Your Customer (KYC) system.

Source: ccn.com


Analysis


XRP/USD

XRP has broken all the daily pivots and also broke the level of $0.50 to the downside and is trading at $0.49 cents, the pair has lost more than 7% in the last 24H and is sitting now at $0.4929. The next support for the price is $0.4803 which I think can be reached in the next hours.


Market sentiment

4-H chart technicals signal a sell sentiment.

Oscillators are showing sell signals and pointing down.


Pivot points

R3 0.5655
R2 0.5575
R1 0.5459
P 0.5379
S1 0.5263
S2 0.5183
S3 0.5067

LTC/USD

Litecoin price comes under heavy selling pressure as are all the currencies in the charts. The price has dropped almost 12% in the last 24H and it is at the lowest levels seen since 7th December 2017, now the price is sitting at $85.03 and the immediate support is $82.69.


Market sentiment

4-Hourly chart technicals signal bearish.

Oscillators are showing sell signals and pointing down.


Pivot points

R3 102.19
R2 100.70 
R1 98.71 
P 97.02 
S1 95.20 
S2 93.80 
S3 91.84

EOS/USD

EOS price dropped considerably during the trading session and reached reach a 2-month low of $8.20 loosing over 15.71% in the last 24H. The RSI and Stochastic indicators are showing oversold and pointing down, the bear’s strength is completely high and the negative hype can continue during the weekend for the pair.


Market sentiment

4-Hourly chart technicals signal bearish.

Oscillators are showing sell signals and pointing down.


Pivot points

R3 11.48
R2 11.17 
R1 10.78 
P 10.47 
S1 10.09 
S2 9.78 
S3 9.38

 Conclusion


Many of the major cryptocurrencies have contributed with their losses to the market drop of around $18 billion in the past 24 hours, it seems to be a short-term decline but this significant momentum could continue if the Bitcoin price manages to pass the important level of $ 6,000. You will see the drop down all weekend until we see a recovery.

Categories
Crypto Market Analysis

Daily Crypto Update 04.06.2018 – No Trade Zone


General Overview


Market Cap: $345,759,677,827

24h Vol: $16,991,056,608

BTC Dominance: 37.7%

In the last 24 hours, the evaluation of the cryptocurrency market capitalization has been on the rise from 343,187,000,000$ to 354,900,000,000$ at the highest point and has retraced sharply since to 343,918,000,000$.

The market is mixed in color, but the dominant one is red with an average decrease of 4% amongst the top 100 coins. Biggest losers are IOTA which experienced a decrease of 9%, Loom network the same around 9% and MOAC by 8.3%.


News


There haven’t been any major headlines over the weekend that can impact the market’s sentiment, however, those stories that came out as significant are positive overall. Many are analytical in nature, as analysts are eager to see if the prices have bottomed out.

For example, Joost van der Burgt, policy adviser at the Federal Reserve Bank of San Francisco who is leaning on the work of Hyman Minsky and his five stages of an asset bubble (displacement, boom, euphoria, profit-taking, and panic), believes that Bitcoin is in the profit taking stage and that the panic stage is yet to come.

Positive headlines are those regarding blockchain tech adoption and governmental relation to crypto.

China

Baidu, the Chinese multinational technology company specialising in Internet-related services and products, is planning to launch a protocol aimed at reducing mining energy consumption, according to a report by China News Weekly today, June 3.

Spain

Spanish Congress unanimously supported draft legislation that would favourably regulate blockchain technology and cryptocurrencies in the country. However, there are complications with the EU laws compliance, but the attempts to legalise cryptos in Spain are going to be successful.

South Korea

The South Korea National Assembly is set to re-legalise Initial Coin Offerings (ICO) in the country.

Abu Dhabi

Maqta Gateway LLC, a wholly owned subsidiary of Abu Dhabi Ports, has become the first entity in Abu Dhabi to deploy its own blockchain solution, Construction Business News reports June 2.

On the flipside, the negative news is about ZenCash 51% hack

ZenCash became the target of a 51% attack like we saw recently on Bitcoin Gold. The hacker obtained more than 50% of the hashrate, giving him control over the network, but the team at ZenCash acted immediately, containing the attack to only two double spending transactions of 19,000 ZEN which is around 558,000$.


Analysis


BTC/USD

From yesterday’s open, the price of Bitcoin has decreased by only 0.45%. The price has been rising from 7639$ to 7751$ and has retraced since to the 7602$ level where it is currently sitting.


Looking at the daily chart we can see that the price of Bitcoin is in the cross-section of many significant trendlines. The price went above the baseline support (bold black line) but was stopped out at the triangle resistance (bold blue line) and 0.236 Fibo level, and it has retraced back to the baseline support.


Zooming into the hourly chart, we can see that the price broke out from an ascending wedge from the downside and is currently below the baseline support.


Market sentiment

Hourly chart technical signal a sell.

Oscillators are on neutral and moving averages signal a sell.


Pivot points

S3 7341.0 
S2 7520.0 
S1 7619.0 
P 7699.0 
R1 7798.0 
R2 7878.0 
R3 8057.0

ETH/USD

From yesterday’s open, the price of Ethereum has increased by 1.7%. The price went from 594$ to 625$ but it has retraced since to the high of 603$ where it is currently sitting.


Looking at the daily chart, we can see that the price of Ethereum has hit the downward channel resistance line and was repealed by it and is now heading down.


Zooming into the hourly chart, we can clearly see the momentum behind the upward movement, and how the price interacted with the resistance line – it went above it, retested it for support but the support wasn’t there so the price fell below it again and is currently sitting on the support line of the ascending triangle from which it broke previously.


Market sentiment

Ethereum is in the sell zone, as indicated by the hourly chart technicals.

Oscillators are on neutral, and moving averages signal a sell.


Pivot points

S3 343.61 
S2 452.53 
S1 521.49 
P 561.45 
R1 630.41
R2 670.37 
R3 779.29

LTC/USD

From yesterday’s open the price of Litecoin has decreased by 1.38%. The price went from 123$ to 127.9$ at the highest point and has retraced since to 122$ where it is currently sitting.


On the daily chart, we can see that the price of Litecoin went above the retracement zone, but quickly fell into it again leaving a wick on yesterday’s candle.


Zooming into the hourly chart, we can see clearly what happened at these levels – the price went above the 124.87$ support level, retested it for support but it didn’t find it, which is why the price quickly fell below it back to the retracement zone to the prior resistance line, where it did find some temporary support.


Market sentiment 

As in the case of Bitcoin and Ethereum, Litecoin is in the sell zone.

Oscillators are on neutral, and moving averages signal a sell.


Pivot points

S3 110.023 
S2 117.893 
S1 121.657 
P 125.763 
R1 129.527 
R2 133.633 
R3 141.503

Conclusion


We can see that the prices are struggling to get above their resistances even though the buying was triggered. A lot of sideways movement is experienced, and a lot of significant trendlines are near, so without any confirmation as to where the prices are going from here, I conclude that we are in a no trade zone.


Categories
Crypto Market Analysis

Market Cap Has Formed a Cup and Handle Pattern

General overview

Market Cap Has Formed a Cup

Market Cap: $421,269,776,870

24h Vol: $26,437,548,757

BTC Dominance: 37.5%

At the start of the week on Monday, April 23. Crypto market capitalization was around 388 billion dollars and rose up to 436,994,000,000$ on April 25, which is this week high. The day after the high was hit, the evaluation of the crypto market capitalization went to the lowest point of the week of 380,513,000,000$. Since it is on the rise and is now sitting at 421,268,000,000$.

Analysis

BTC/USD

On April 23, the price of Bitcoin was 8748$. Only two days later the price went to 9700$ which is this week’s highest point, and after that it fell by 1000$, coming to the lowest point of the week at 8700$. Since the price has increased to 9240$ where is now sitting slightly above 0.5 Fibonacci level and 100 day EMA. The price has increased by 5,4% overall.

Analysis BTC/USD

On the daily chart we have a potential tweezer top, which is the candles on 24. and 25. and if today ends up closing as doji, we can are going to see a trend reversal coming into the next week.


Overall daily chart signals a buy.

Overall daily chart signals a buy

Pivot points:

S3 6109.5
S2 7355.5
S1 8134.0
P 8601.5
R1 9380.0
R2 9847.5
R3 11093.5

ETH/USD

Since Monday, April 23. The price of Ethereum has increased by 8,8% coming from 620$ to 675$ where is now sitting. Like in the case of Bitcoin, the price oscillated to the weekly high at 708$ and then fallen to the weekly low at 611$.

ETH/USD

The price is currently above the 1.618 Fibonacci level drawn from bottom to the top of the prior range and above the 50 and 100-day EMA. Unlike Bitcoin, today’s candle isn’t a doji. However, it looks even from both sides, which nevertheless indicates indecisiveness.


Overall, daily chart signals a buy.

daily chart signals a buy

Pivot points

S3 324.51
S2 450.42
S1 527.43
P 576.33
R1 653.34
R2 702.24
R3 828.15


XRP/USD

Ripple has decreased in price by 1,62% during the week, starting from 0.86$ at Monday, April 23rd. to 0.847$ where it is today. The price pathway is also like in the case of BTC and ETH been oscillating to form weekly high at 0.958$ and weekly low at 0,77$.

XRP/USD


Looking at the daily chart, we can see that this week was really turbulent for Ripple. The price is currently above 50 and 100-day EMA, but it’s also below 100% Fibonacci level and today’s candle is a doji. Having that and this double top that struggled to become a higher high and failed indicates a potential trend reversal in the following week.

Overall daily chart signals a buy.

daily chart signals

Pivot points

S3 0.20439

S2 0.50804
S1 0.68659
P 0.81169
R1 0.99024
R2 1.11534
R3 1.41899


LTC/USD

LTC/USD

This week the price of Litecoin increased by 3% overall coming from 146,4$ to 150,33$ where is now sitting. At the end of 24, the price of Litecoin was the highest 166$ coming slightly above the 100% Fibonacci level, only to fall the next day to the lowest point of the week at 143$ on the 0.618 Fibonacci level which served as support. The price is currently in between 50 and 100-day EMA slightly below 0,786 Fibonacci level.

Overall, daily chart signals a buy

daily chart signals

Pivot points

S3 79

S2 111
S1 129
P 143
R1 162
R2 175
R3 207


Conclusion

Compared to Monday’s 387 billion dollar evaluation, crypto market capitalization evaluation rose up by 50 billion on Wednesday and fallen by 7 billion on Thursday. The cup and handle is a pattern is now clearly seen.

The similar chart pattern is imprinted on the four major cryptocurrencies which again shows a strong correlation in the crypto markets. Having seen the signs of struggle on the charts that we’ve covered and the tweezer tops followed by doji’s we can conclude that we are in for a bit of a downside before a breakout to new highs in the following period.Cryptocurrencies Market cap

©Forex.Academy