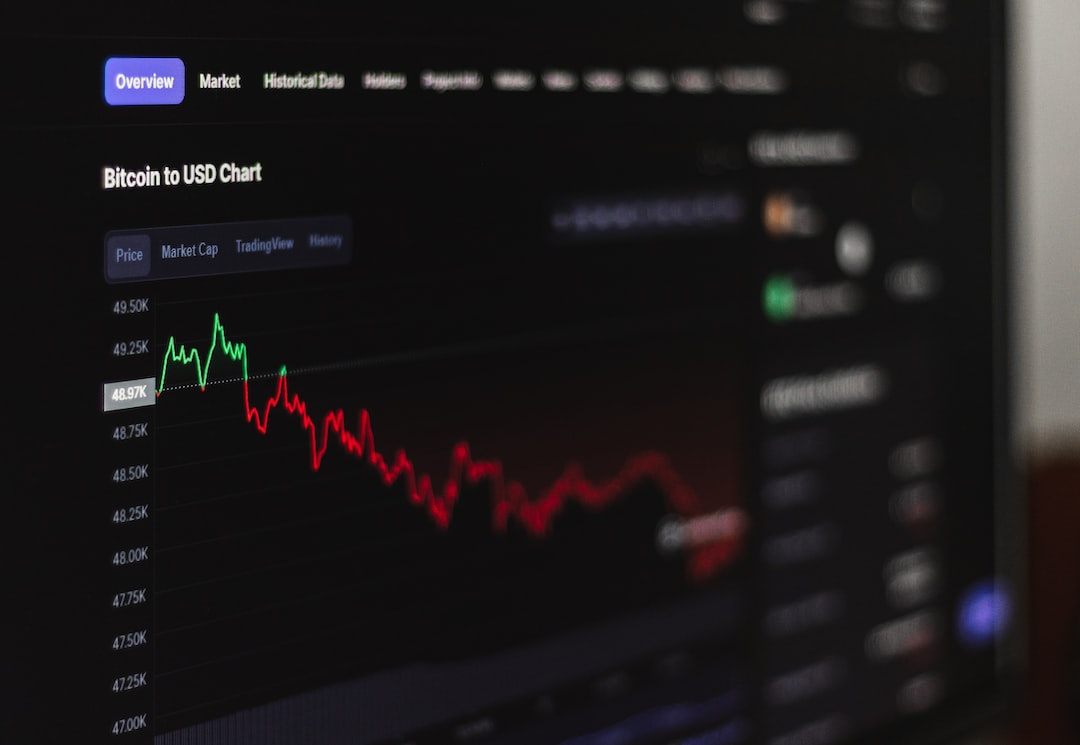
Fibonacci retracements are one of the most popular tools used by traders to identify potential levels of support and resistance in the forex market. These retracements are based on the Fibonacci sequence, which is a mathematical sequence of numbers that occurs throughout nature. Fibonacci retracements are used to identify potential levels of support and resistance by measuring the distance between two points on a chart and then applying the Fibonacci ratios to that distance.
Calculating Fibonacci Retracements
To calculate Fibonacci retracements, you will need to identify two points on a chart. The first point is the high point, which represents the highest price that the asset has reached over a given period. The second point is the low point, which represents the lowest price that the asset has reached over the same period.
Once you have identified these two points, you can then calculate the distance between them. This distance is measured by subtracting the low point from the high point. For example, if the high point is 1.5000 and the low point is 1.4000, then the distance between them is 100 pips.
Once you have calculated the distance between the two points, you can then apply the Fibonacci ratios to that distance. The most commonly used Fibonacci ratios are 0.236, 0.382, 0.500, 0.618, and 0.786.
To apply these ratios, you will need to multiply the distance between the two points by each ratio. For example, if the distance between the two points is 100 pips, then the Fibonacci retracements would be:
• 0.236 retracement = 23.6 pips
• 0.382 retracement = 38.2 pips
• 0.500 retracement = 50.0 pips
• 0.618 retracement = 61.8 pips
• 0.786 retracement = 78.6 pips
These retracement levels can then be used to identify potential levels of support and resistance. For example, if the price of the asset retraces to the 0.618 retracement level, this could be a potential level of support. Conversely, if the price of the asset retraces to the 0.382 retracement level, this could be a potential level of resistance.
Using Fibonacci Retracements in Forex Trading
Fibonacci retracements can be used in a variety of ways in forex trading. Some traders use them to identify potential levels of support and resistance, while others use them to identify potential entry and exit points.
One popular strategy is to wait for the price of the asset to reach a Fibonacci retracement level and then enter a trade in the direction of the trend. For example, if the price of the asset is in an uptrend and retraces to the 0.618 retracement level, a trader may enter a long position with the expectation that the price will continue to rise.
Another popular strategy is to use Fibonacci retracements in conjunction with other technical indicators, such as moving averages, to identify potential levels of support and resistance. For example, if the price of the asset retraces to the 0.618 retracement level and is also near a key moving average, this could be a potential level of support.
Conclusion
Fibonacci retracements are a powerful tool for identifying potential levels of support and resistance in the forex market. By calculating the distance between two points on a chart and applying the Fibonacci ratios to that distance, traders can identify potential entry and exit points, as well as potential levels of support and resistance. However, it is important to remember that Fibonacci retracements are not a guarantee of future price movements and should be used in conjunction with other technical and fundamental analysis tools.


