
Most of the cryptocurrency sector ended up in the green as Bitcoin passed $38,000. Another thing to mention is that the overall industry market cap has reached past $1 trillion for the first time in the history of cryptocurrencies. Bitcoin is currently trading for $38,400, representing an increase of 10.78% compared to yesterday’s value. Meanwhile, Ethereum’s price has increased by 7.78% on the day, while XRP skyrocketed, gaining 46.55% of its value.

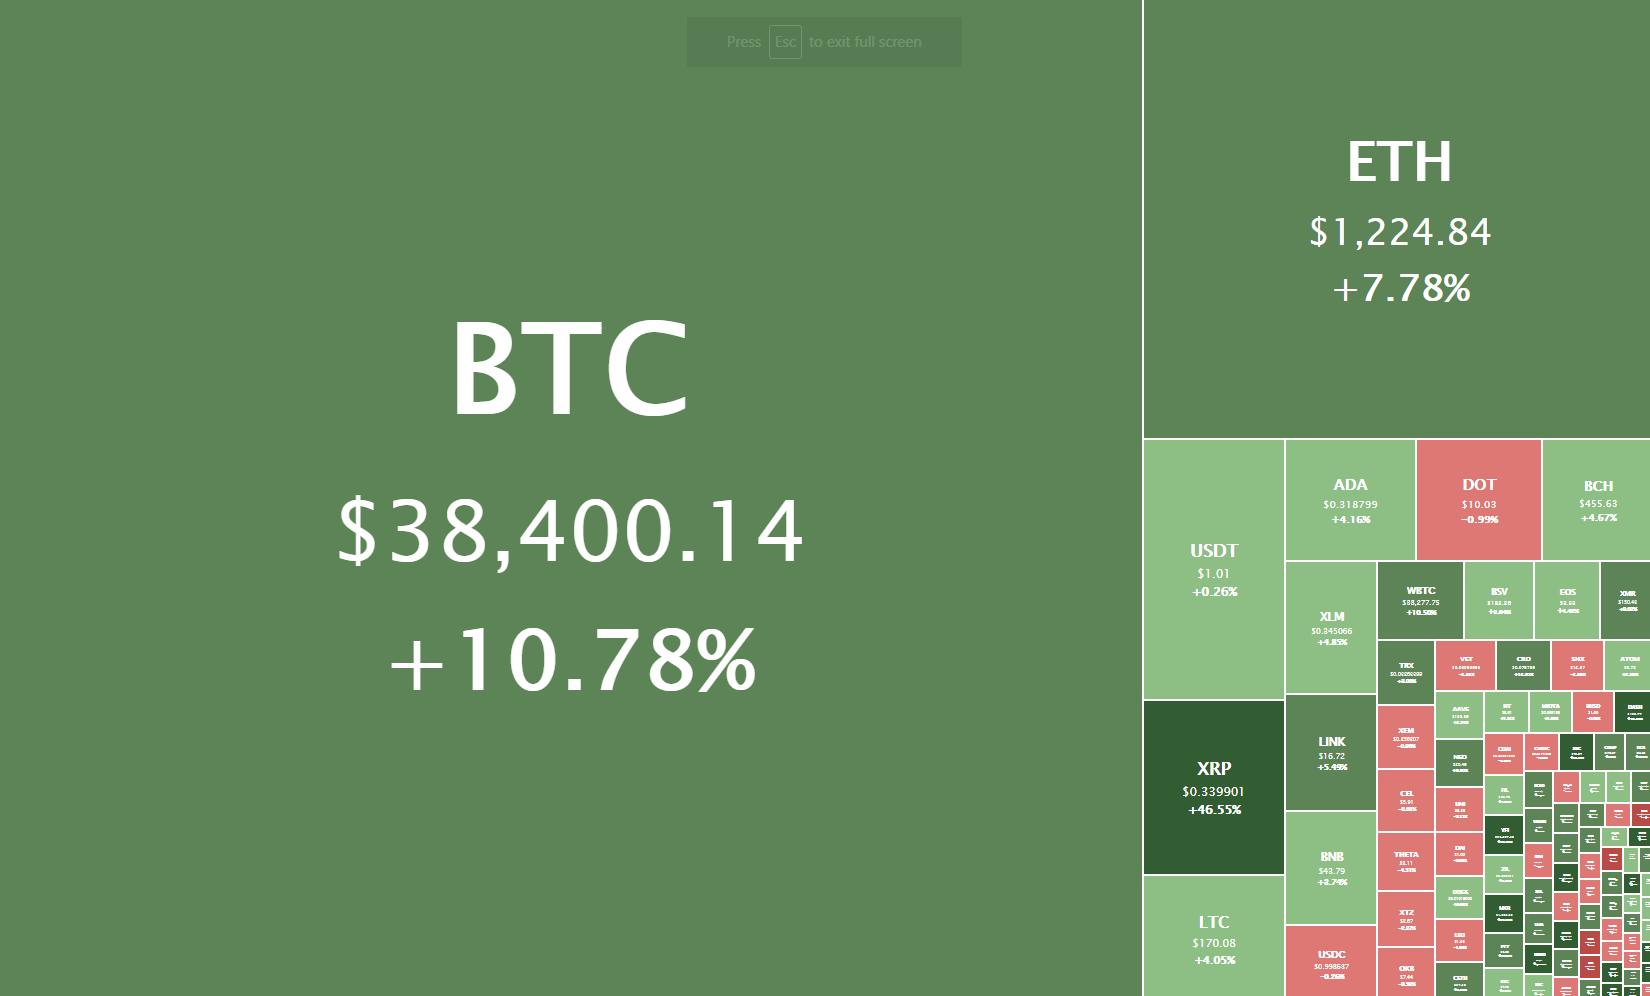
Daily Crypto Sector Heat Map
X Infinity gained 896.37% in the past 24 hours, making it the most prominent daily crypto gainer by far. It is followed by 7up Finance’s 298.93% and EveryCoin’s 278.57% gain. On the other hand, COVER Protocol lost 99.48%, making it the most prominent daily loser. It is followed by UniMex’s loss of 97.1% and Team Heretics Fan Token’s loss of 91.66%.
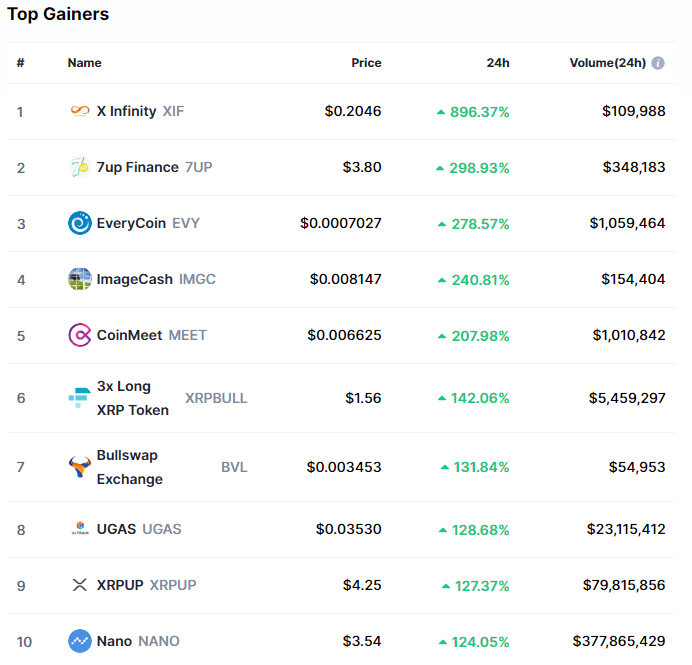
Top 10 24-hour Performers (Click to enlarge)
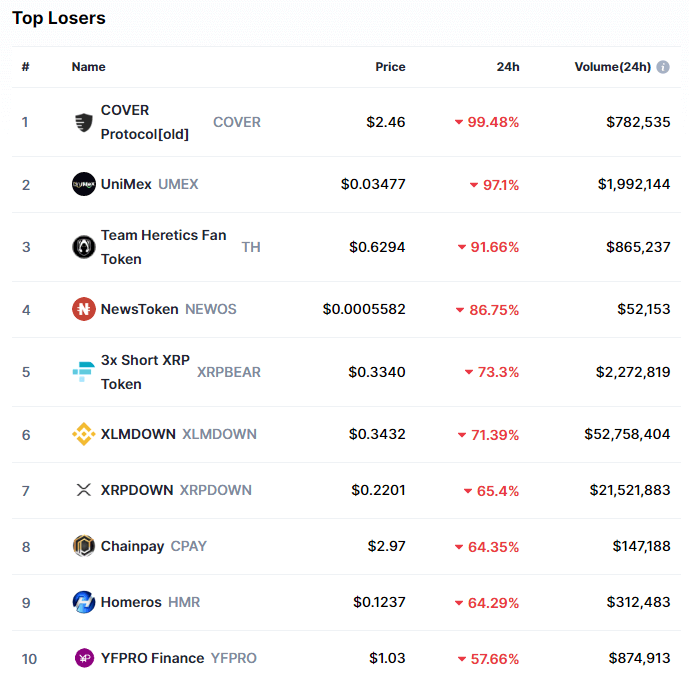
Bottom 10 24-hour Performers (Click to enlarge)
Bitcoin’s market dominance has moved down slightly since our last report, with its value currently being 68.6%. This value represents a 0.7% difference to the downside than the value it had when we last reported.
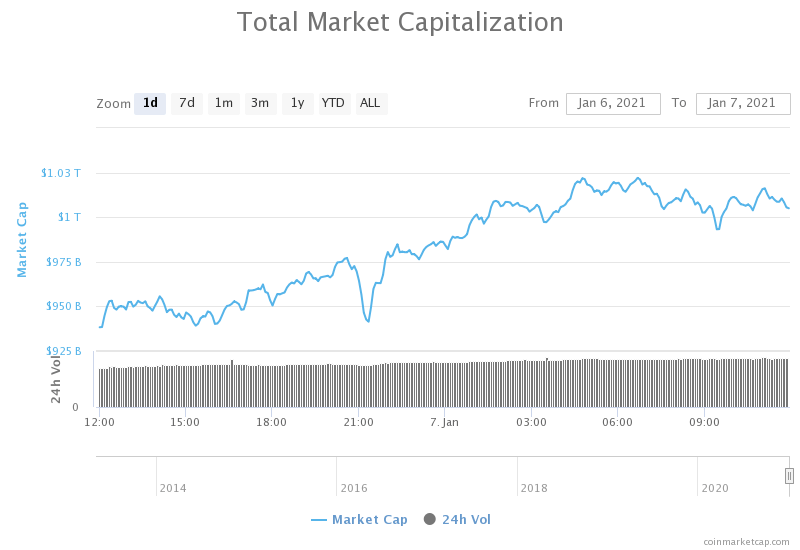
Daily Crypto Market Cap Chart
The cryptocurrency sector capitalization skyrocketed and passed the one trillion mark since we last reported, with its current value being $1,005 trillion. This represents a $33.51 billion increase when compared to our previous report.
_______________________________________________________________________
What happened in the past 24 hours?
_______________________________________________________________________
- ETH trades above $1,200, reaching market level not seen since January 2018 (The Block)
- Global cryptocurrency market cap hits $1 trillion (The Block)
- South Korean gaming giant Nexon is preparing to acquire crypto exchange Bithumb for about $460 million: Report (The Block)
- Will Litecoin Be Delisted if It Becomes a Privacy Coin? (Cryptobriefing)
- Here’s why stablecoins like USDC going ‘legal’ is bullish for DeFi (Cryptoslate)
- Maker’s MKR Token Surges to 2-Year High on DeFi Growth (Coindesk)
- Bitcoin Tops $37K, Setting Record, Hours After Roaring Past $36K (Coindesk)
- FinCEN’s wallet rule is open for another day of comments because ‘government officials can’t count to 15’ (Cointelegraph)
- YouTube star Mr Beast, with 50M subscribers, becomes a verified Brave browser publisher (Cointelegraph)
- Stanford group becomes 9th largest Uniswap delegate, overtakes UC Berkeley (Cointelegraph)
_______________________________________________________________________
Technical analysis
_______________________________________________________________________
Bitcoin

Bitcoin continued the upward trajectory and pushed past the previous all-time high with confidence, reaching a new high of $38,510 at one point. While the price did retrace after hitting the 37,800 at one point, but the 50-hour moving average created strong support, and BTC pushed back up to contest the all-time high level once again.
As we have mentioned many times, shorting of any kind and trading against the overall trend is most likely not optimal, and traders might find a good opportunity to long BTC each time it breaks the all-time high, as this is when it gets a large influx of buyers.
BTC/USD 1-hour chart
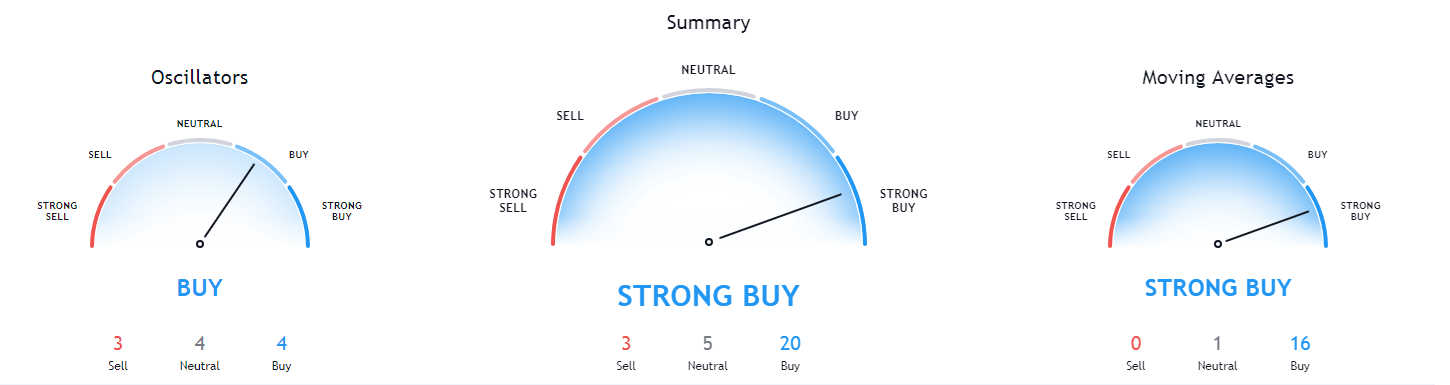
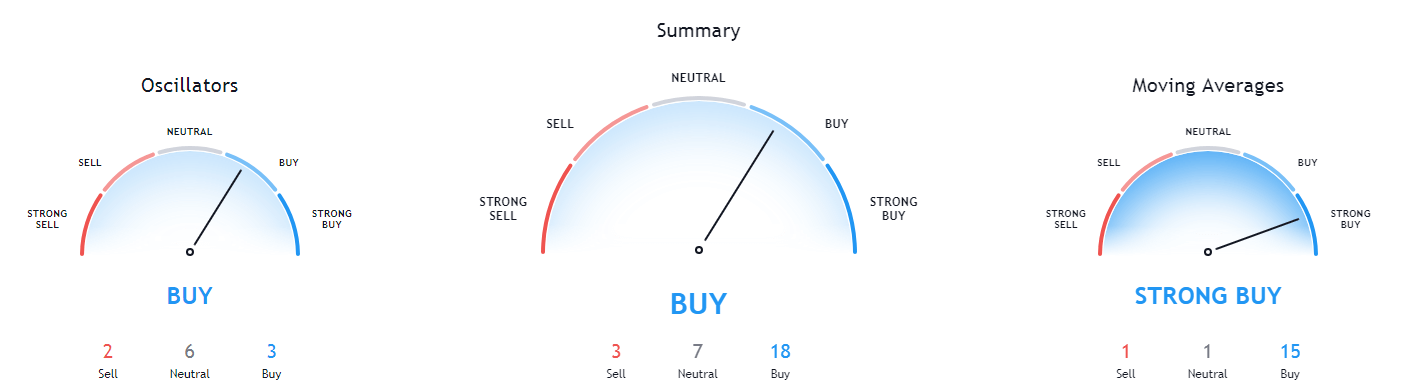
Bitcoin’s short-term technicals (4-hour and daily) are completely bullish, while its long-term overview is a bit more tilted towards neutrality.
BTC/USD 1-day Technicals
Technical factors (4-hour Chart):
- Price is above both its 50-period EMA and its 21-period EMA
- Price is near its top Bollinger band
- RSI is in the overbought territory (72.04)
- Volume is above average
Key levels to the upside Key levels to the downside
1: $37,800 1: $35,880
2: $40,000 2: $34,800
3: $43,220 3: $33,100
Ethereum
Ethereum’s chart looks pretty similar to Bitcoin’s, as they both moved to the upside in the same manner. The second-largest cryptocurrency by market cap pushed past many support levels and reached $1,225 before descending slightly. Alongside Bitcoin’s move to new all-time highs, this move contributed the most to the overall crypto sector market cap passing the $1 trillion mark.
Ethereum is currently trading within a narrow range, bound by $1,169 to the downside and $1,211 to the upside. If ETH decides to move up, the next most likely resistance level will be the $1,341.5 level. If, however, it breaks this range to the downside, it has many support levels.
ETH/USD 1-hour Chart
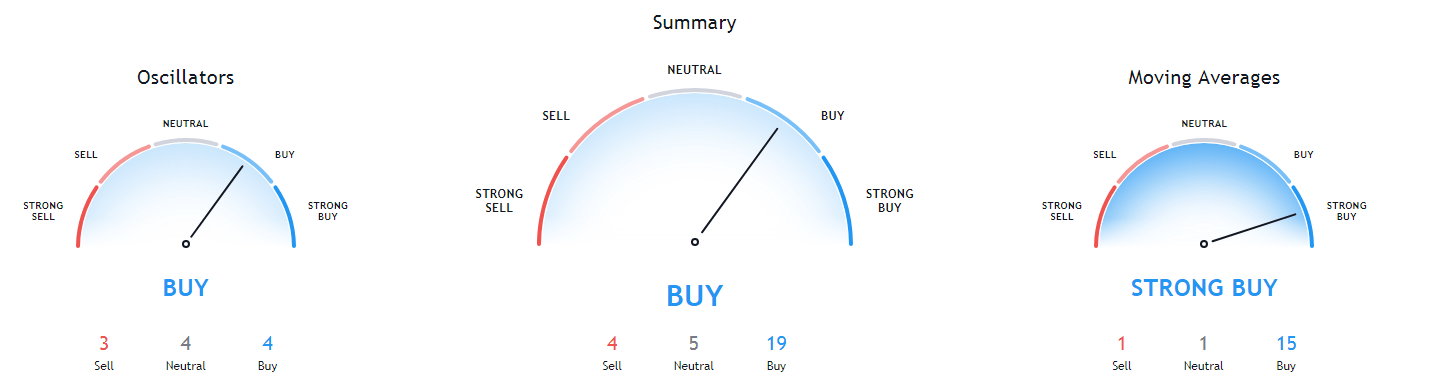
Ethereum’s technicals on the daily, weekly, and monthly time-frames are fully tilted towards the buy-side, while its 4-hour technicals are slightly more neutral.
ETH/USD 1-day Technicals
Technical Factors (4-hour Chart):
- Price is above both its 50-period and its 21-period EMA
- Price is at its top Bollinger band
- RSI is in the overbought area (73.41)
- Volume is significantly above-average
Key levels to the upside Key levels to the downside
1: $1,211 1: $1,169
2: $1,341.5 2: $1,080
3: $1,425 3: $1,050
Litecoin
Litecoin increased in price as well, but while its chart looks similar to Bitcoin’s and Ethereum’s, it’s important to notice that it did not break the high it made on Jan 4. In fact, Litecoin almost got to the $174.5 level but quickly pulled back to $165.
Litecoin found strong support in its 50-hour moving average, which held it above $165 and kept it from possibly breaking $163.7 to the downside.
Litecoin’s next move will most likely be highly dependent on Bitcoin’s short-term movement.
LTC/USD 1-hour Chart
Litecoin’s technicals are fully bullish on every single time frame and vary from “buy” to “strong-buy” indicators.
LTC/USD 1-day Technicals
 Technical factors (4-hour Chart):
- Its price is currently above both its 50-period EMA and its 21-period EMA
- Price between its middle and top Bollinger band
- RSI is nearing the overbought area (63.82)
- Volume is above-average but descending
Key levels to the upside Key levels to the downside
1: $163.7 1: $155.25
2: $174.5 2: $149.3
3: $195.5 3: $143.5
Related posts
 Daily Crypto Review, Jan 13 – Polkadot Outperforms the Market as it Heads Towards $10; Crypto Sector in the Red
 Daily Crypto Review, Jan 14 – Bitcoin Records Double-Digit Gains as it Passes $38K; Crypto Market in the Green
 Daily Crypto Review, Jan 19 – Ether Breaks $1,300; Litecoin Skyrockets
 Daily Crypto Review, Jan 25 – Ethereum Reaches a new All-Time High: What’s Next?