
The crypto sector ended up mostly trading in the red as cryptocurrencies such as Ether, Litcoin, and Bitcoin Cash dropped over 5% on the day. Polkadot was one of the few cryptocurrencies that managed to score double-digit gains and outperform the market by a large margin. However, this is purely due to fundamental reasons (immense support coming from the Binance exchange) rather than technicals.
Bitcoin is currently trading for $34,223, representing a decrease of 3.03% compared to yesterday’s value. Meanwhile, Ethereum’s price has decreased by 4.09% on the day, while LTC lost 3.07% of its value.
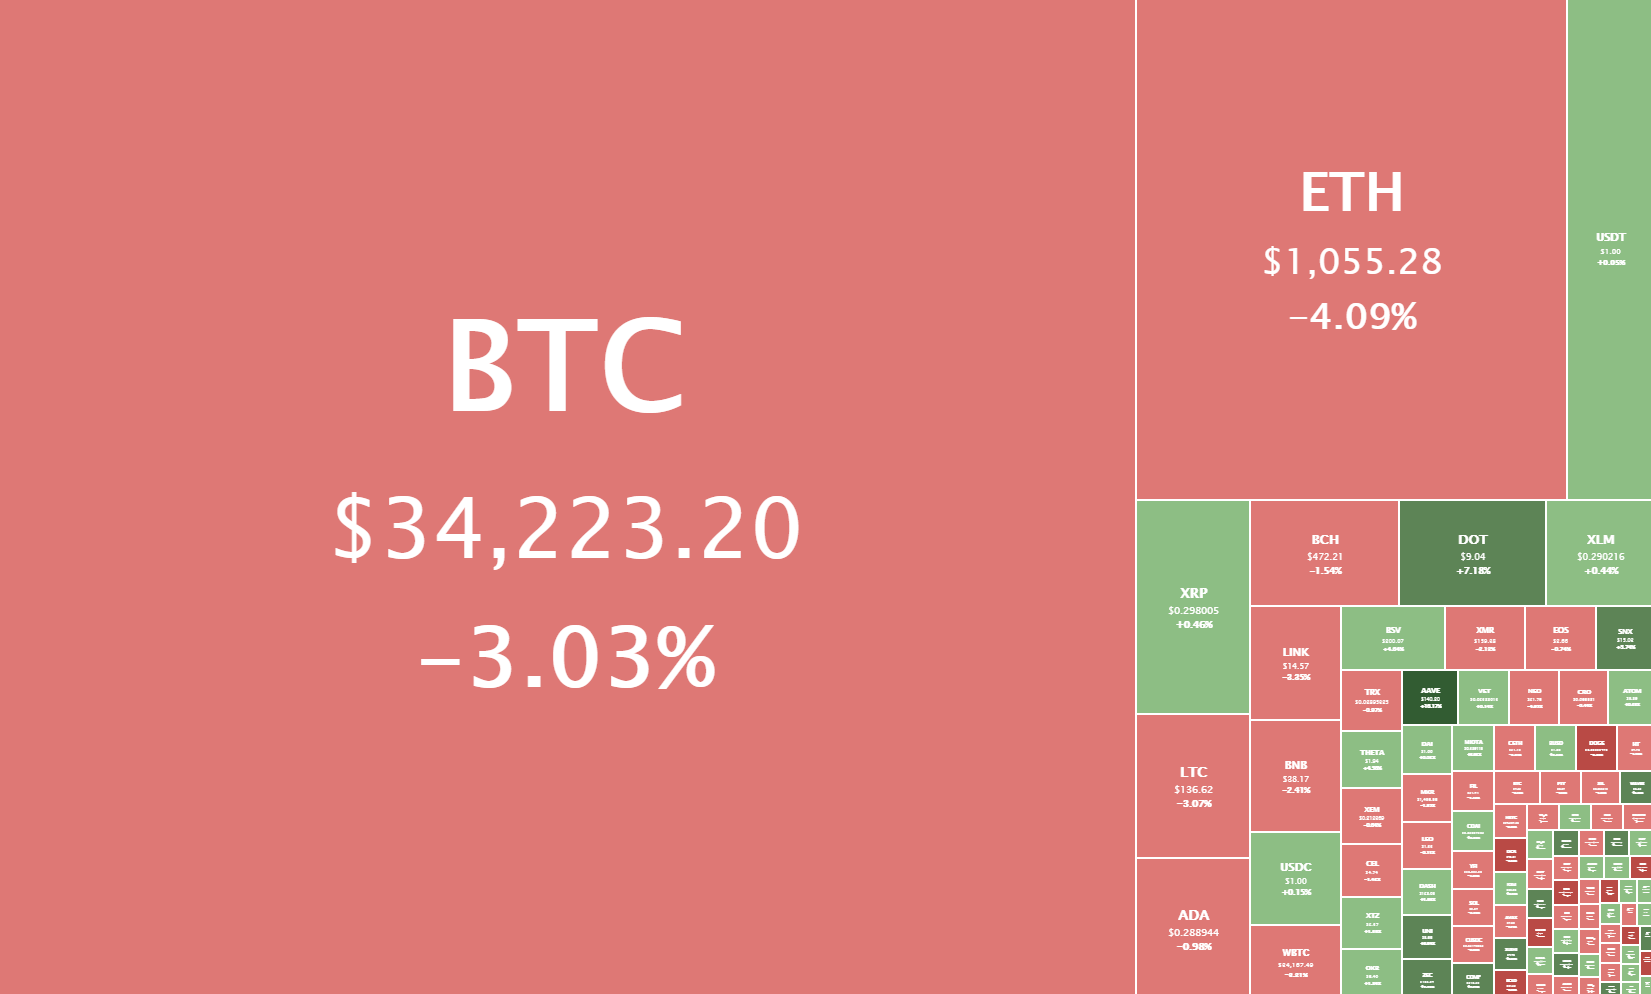
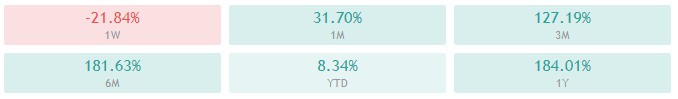
Daily Crypto Sector Heat Map
Metacoin gained 103.61% in the past 24 hours, making it the most prominent daily crypto gainer by far. It is followed by OVR’s 98.72% and Latamcash’s 92.88% gain. On the other hand, Amun Bitcoin 3x Daily Short lost 75.44%, making it the most prominent daily loser. It is followed by Zugacoin’s loss of 73.82% and KIMCHI.finance’s loss of 66.82%.

Top 10 24-hour Performers (Click to enlarge)
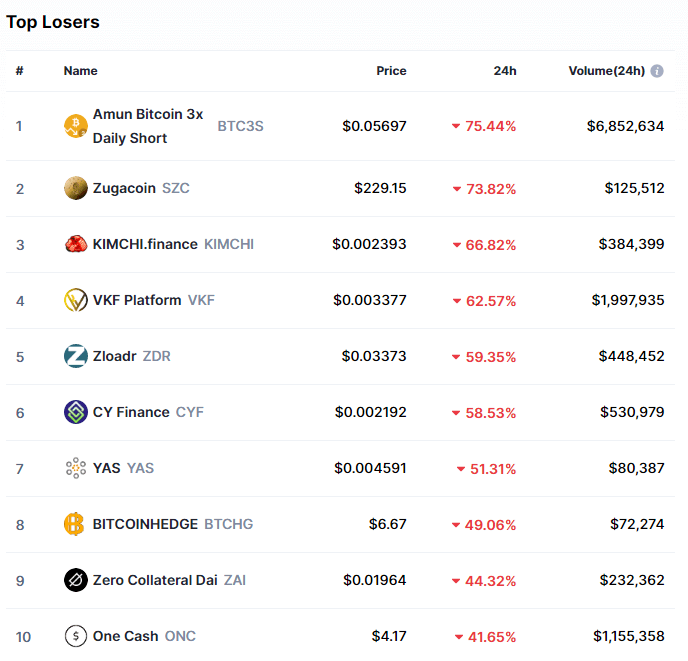
Bottom 10 24-hour Performers (Click to enlarge)
Bitcoin’s market dominance has moved down very slightly since our last report, with its value currently being 68.6%. This value represents a 0.1% difference to the downside than the value it had when we last reported.

Daily Crypto Market Cap Chart
The cryptocurrency sector’s capitalization has decreased since we last reported, with its current value being $948.23 trillion. This represents a $17.92 billion decrease when compared to our previous report.
_______________________________________________________________________
What happened in the past 24 hours?
_______________________________________________________________________
- Billionaire investor Howard Marks’ son owns ‘a meaningful amount’ of bitcoin for family (The Block)
- Bitcoin is ‘highly speculative’ and needs to be regulated, says ECB’s Lagarde (The Block)
- Bitcoin is ‘highly speculative’ and needs to be regulated, says ECB’s Lagarde (The Block)
- Crypto exchange OSL operator completes stock top-up to raise $90 million (The Block)
- UK Treasury Classifies XRP as Non-Security Asset (Cryptobriefing)
- Brian Brooks, Pro-Crypto OCC Leader, Will Step Down (Cryptobriefing)
- PayPal’s new crypto unit just traded over $240 million in a single day (Cryptoslate)
- Bitcoin frenzy? Coinbase surpassing $9 billion in daily volume shows big demand (Cryptoslate)
- Multiple Tokens See Rally Amid Looming ‘Alt Season’ (Coindesk)
- GateHub to continue supporting XRP despite Ripple’s legal issues (Cointelegraph)
_______________________________________________________________________
Technical analysis
_______________________________________________________________________
Bitcoin

Bitcoin spent the day hovering between the $33,320 support level and the $36,640 resistance level, with its price mostly being in the bottom part of the range. The price even breached the support level and went past it on several occasions, but it always returned back up. While it currently seems stable and on decreasing volume, Bitcoin might experience a stronger pullback and an attempt to retest $30,000 once again.
BTC/USD 1-hour chart
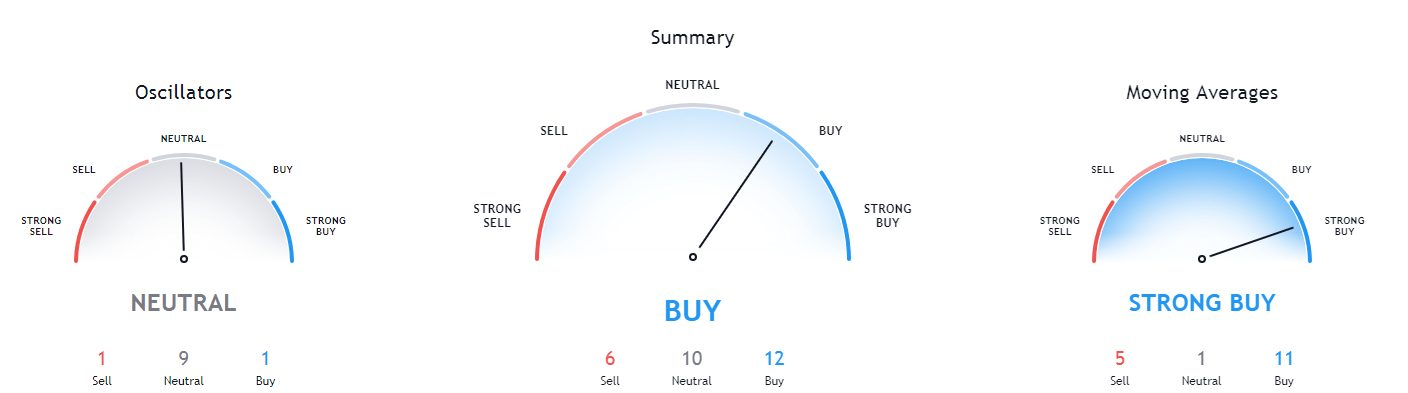
Bitcoin’s technicals on the daily and monthly time-frame bullish, but contain some neutrality alongside the bullishness. However, its weekly overview is completely bullish, while its 4-hour chart is completely bearish.

BTC/USD 1-day Technicals
Technical factors (1-hour Chart):
- Price is between its 50-period EMA and its 21-period EMA
- Price is near its middle Bollinger band
- RSI is neutral (50.24)
- Volume is descending
Key levels to the upside: Key levels to the downside:
1: $36,640 1: $33,200
2: $40,000 2: $30,640
3: $42,000 3: $27,960
Ethereum
Ethereum has traded almost exactly like Bitcoin in the past 24 hours, both in terms of price direction and intensity. The second-largest cryptocurrency by market cap is currently in an extremely narrow and unsustainable range, bound by the Fib retracement level of $1,060 to the upside and a 2017 Fib retracement sitting at $1,047.
Ethereum’s 21-hour and 50-hour moving averages play a significant role in determining price direction and should be considered by the traders at all times.
ETH/USD 1-hour Chart
Ethereum’s technicals on the daily and monthly time-frame bullish, but contain some neutrality alongside the bullishness. However, its weekly overview is completely bullish, while its 4-hour chart is completely bearish.
ETH/USD 1-day Technicals
Technical Factors (1-hour Chart):
- Price is between its 50-period and its 21-period EMA
- Price is at its middle Bollinger band
- RSI is neutral (48.60)
- Volume is descending
Key levels to the upside: Key levels to the downside:
1: $1,129 1: $1,060.5
2: $1,211 2: $1,047.5
3: $1,226.5 3: $992
Litecoin
Litecoin has been pretty stable in the past 24 hours, with its price trading within a range bound by $128.4 to the downside and $142.1 to the upside. These support/resistance levels, alongside the 21-hour and 50-hour EMAs, will determine Litecoin’s future price intensity, while Bitcoin’s next move will most likely determine its price direction.
LTC/USD 1-hour Chart
Litecoin’s technicals on the daily and monthly time-frame are completely bullish. However, its weekly overview shows slightly less bullishness, while its 4-hour chart is almost completely bearish.

LTC/USD 1-day Technicals
Technical factors (1-hour Chart):
- Its price is between its 50-period EMA and its 21-period EMA
- Price slightly below its middle Bollinger band
- RSI is neutral (51.37)
- Volume is descending
Key levels to the upside: Key levels to the downside:
1: $142.1 1: $128.42
2: $161.5 2: $114.75
3: $181.3 3: $98
Related posts
 Daily Crypto Review, Jan 7 – Crypto Sector Market Cap Over $1 Trillion as BTC Approaches the $40k Mark
 Daily Crypto Review, Jan 8 – Bitcoin Continues Its Rise as it Breaks the $40k Mark Briefly
 Daily Crypto Review, Jan 11 – Crypto Sector Plummets as BTC Drops to $32k
 Daily Crypto Review, Jan 18 – Bitcoin Drops During the Weekend, ETH Remains Strong