
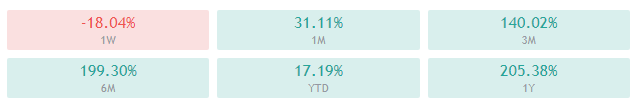
The crypto sector ended up almost completely in the green as Bitcoin recorded double-digit gains and pulled the rest of the market up. Bitcoin is currently trading for $38,222, representing an increase of 11.05% compared to yesterday’s value. Meanwhile, Ethereum’s price has increased by 9.00% on the day, while LTC gained 6.48% of its value.

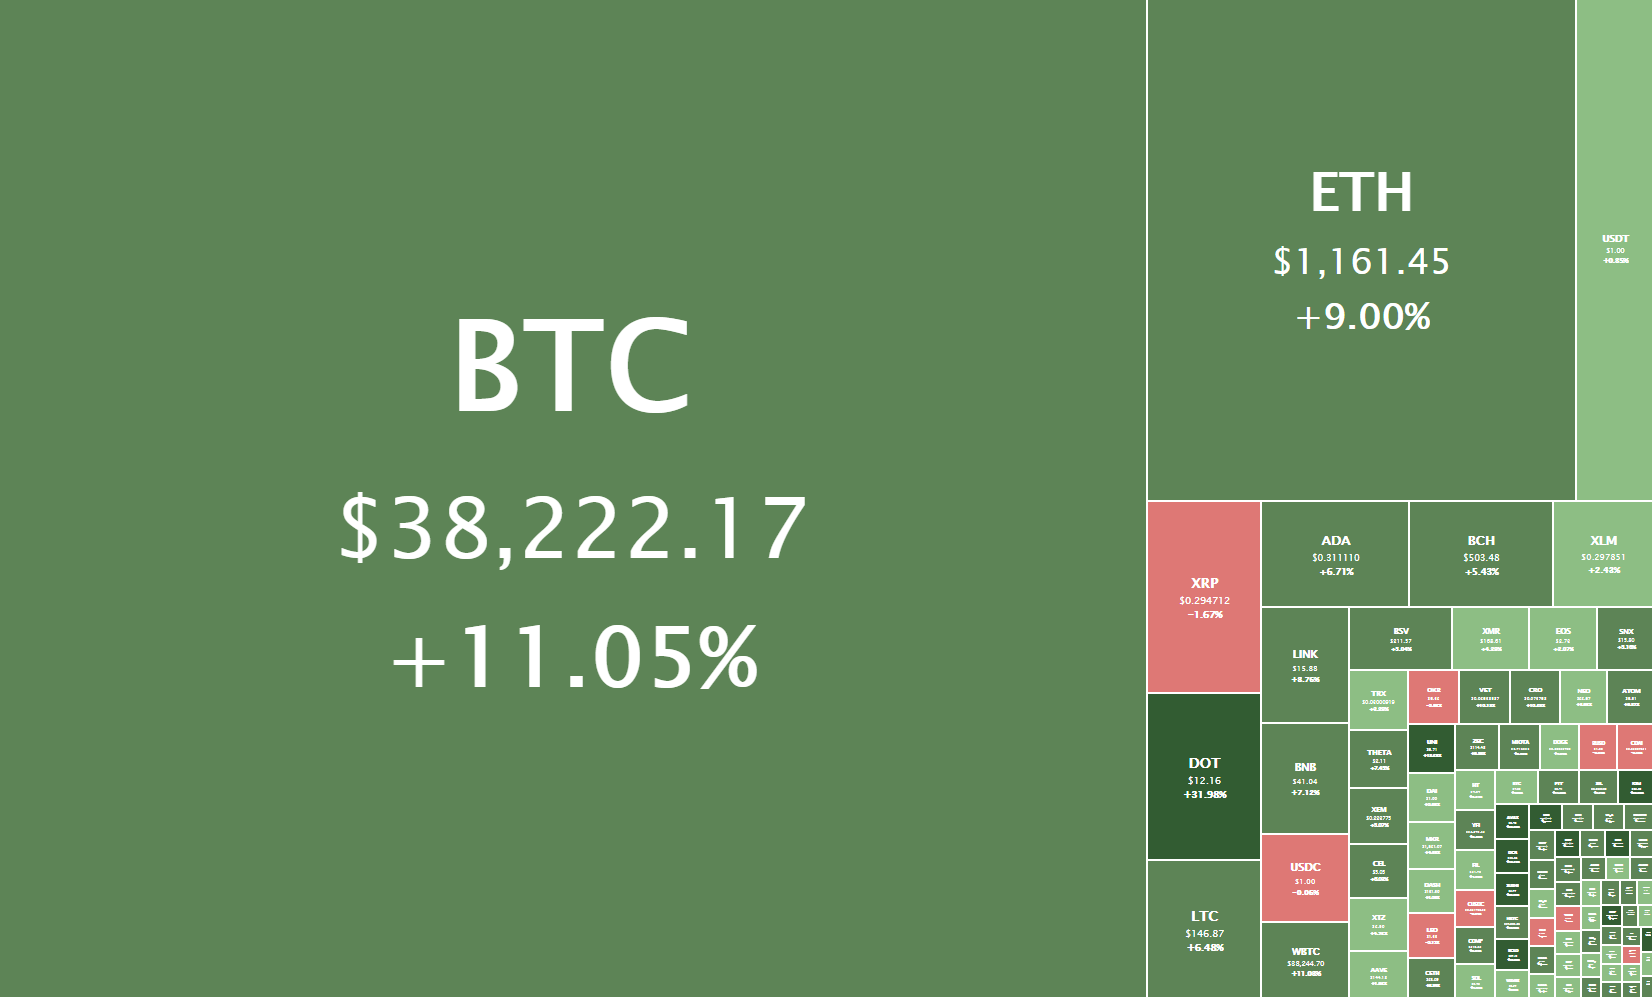
Daily Crypto Sector Heat Map
Simbcoin gained 366.72% in the past 24 hours, making it the most prominent daily crypto gainer by far. It is followed by Penta’s 229.88% and DEX’s 187.13% gain. On the other hand, Daiquilibrium lost 88.91%, making it the most prominent daily loser. It is followed by Dynamic Supply Tracker’s loss of 80.15% and Dynamic Supply’s loss of 63.83%.
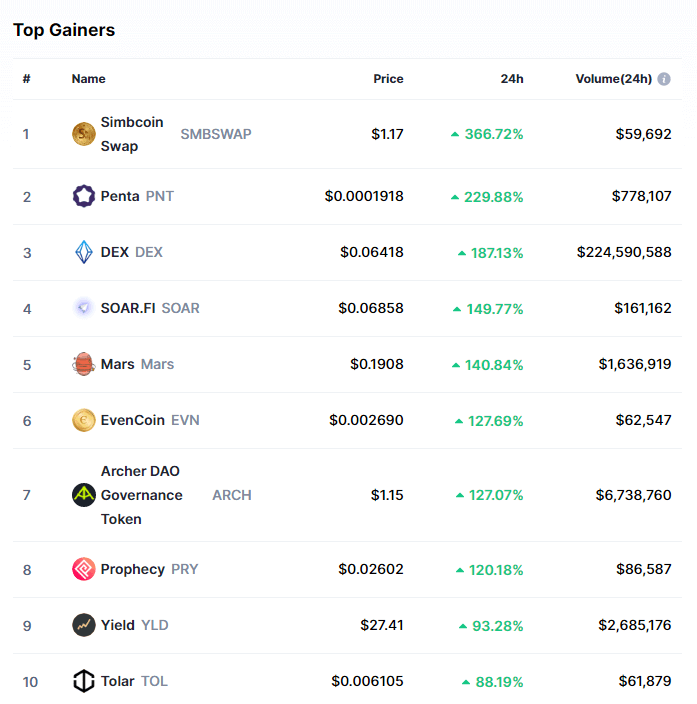
Top 10 24-hour Performers (Click to enlarge)
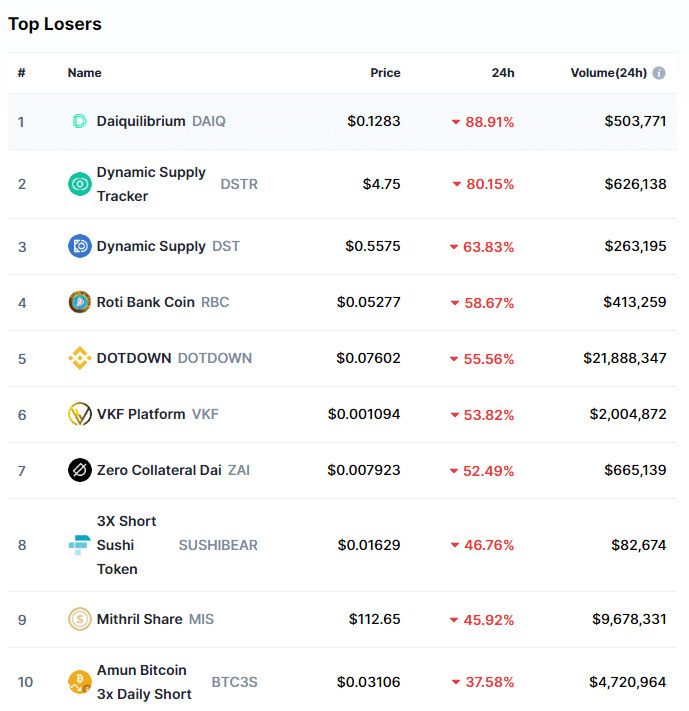
Bottom 10 24-hour Performers (Click to enlarge)
Bitcoin’s market dominance has moved up slightly since our last report, with its value currently being 69%. This value represents a 0.4% difference to the upside when compared to the previously reported value.
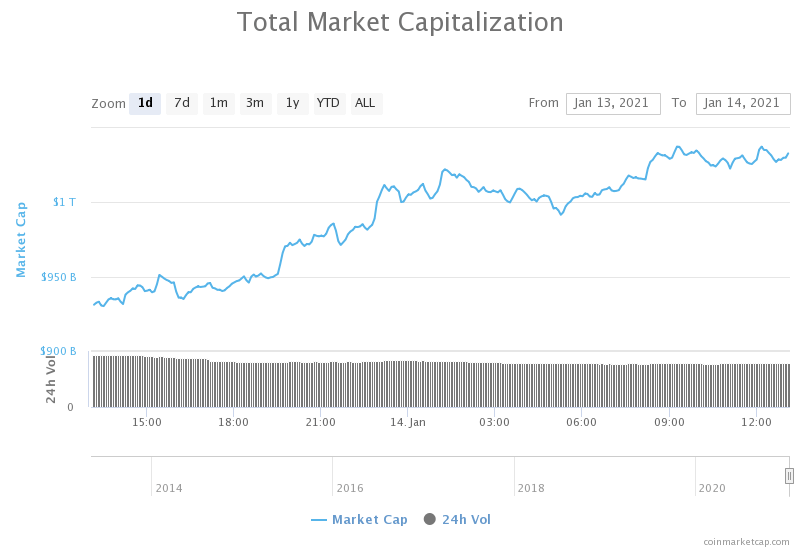
Daily Crypto Market Cap Chart
The cryptocurrency sector’s market capitalization has made significant gains since we last reported, with its current value being $1.032 trillion. This represents an $88.3 billion increase when compared to our previous report.
_______________________________________________________________________
What happened in the past 24 hours?
_______________________________________________________________________
- ECB: Digital euro survey participants cite privacy, security as key elements (The Block)
- While bitcoin was cratering over the weekend, many institutions were buying (The Block)
- Gemini acquires Blockrize, launching a credit card with 3% rewards in BTC (The Block)
- Grayscale says it will dissolve XRP Trust, citing market reaction to SEC lawsuit (The Block)
- Dogecoin Gets Three Exchange Listings in One Day (Cryptobriefing)
- Oracle Tokens Chainlink, Band Rebound and Take Flight (Cryptobriefing)
- Ethereum Miners Oppose “ETH Buyback” Proposal (Cryptobriefing)
- Michael Saylor: Bitcoin is a better bet now than tech stocks were in the early days (Cryptoslate)
- Anchorage Becomes First OCC-Approved National Crypto Bank (Coindesk)
- Pantera Capital CEO doubles down on $115K Bitcoin prediction for 2021 (Cointelegraph)
_______________________________________________________________________
Technical analysis
_______________________________________________________________________
Bitcoin
Bitcoin had started changing its price direction on Jan 13, when it started to slowly push towards the upside. The largest cryptocurrency by market cap managed to pass the $36,640 level and reach as high as $38,789 before pulling back slightly. This steady price increase was followed by average (or even slightly descending) volume.
The pullback BTC went into after hitting the recent high was quickly stopped by the 21-hour and 50-hour EMAs, changing the overall stance from an expected downturn to uncertainty.
BTC/USD 1-hour chart
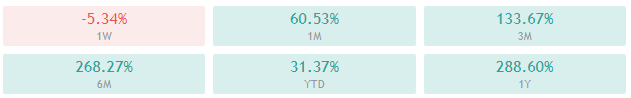
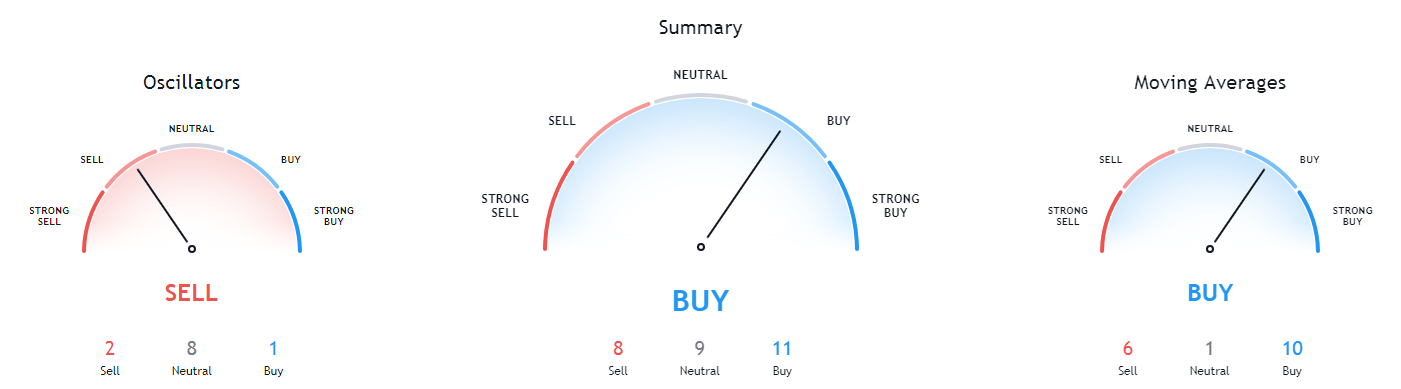
Bitcoin’s technicals on the 4-hour, daily and monthly time-frame are overall bullish, with oscillators pointing to the sell-side. On the other hand, its weekly overview is completely bullish.
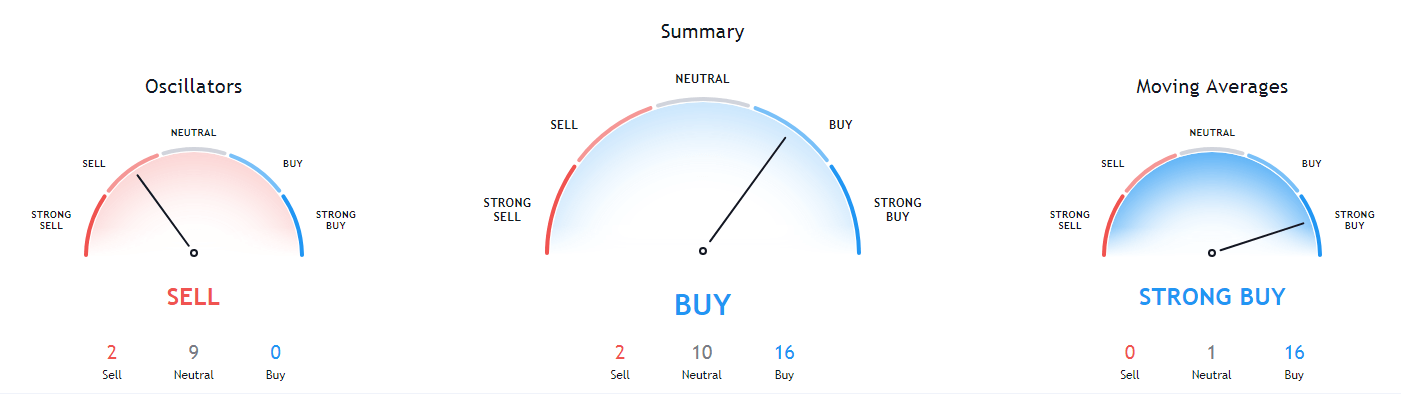
BTC/USD 1-day Technicals
Technical factors (1-hour Chart):
- Price is above both its 50-period EMA and its 21-period EMA
- Price is between its middle and top Bollinger band
- RSI is neutral (62.38)
- Volume is average
Key levels to the upside: Key levels to the downside:
1: $40,000 1: $36,640
2: $42,000 2: $33,200
3: $43,600 3: $30,640
Ethereum
Ethereum’s period of heavy correlation with Bitcoin has continued as its price slowly gained momentum towards the upside. Ether managed to push its price to the $1,183.85 level but couldn’t quite break it. This caused a minor pullback, which ended very quickly.
Ethereum’s 21-hour and 50-hour EMAs play a significant role in determining its price direction and should be considered by the traders at all times. On top of that, any ETH trader should pay attention to BTC’s movements, as those ultimately determine the price direction of most cryptocurrencies.
ETH/USD 1-hour Chart
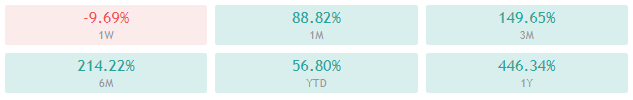
Ethereum’s technicals on the daily and weekly time-frame are currently completely bullish, while its 4-hour and monthly overviews show some signs of neutrality.
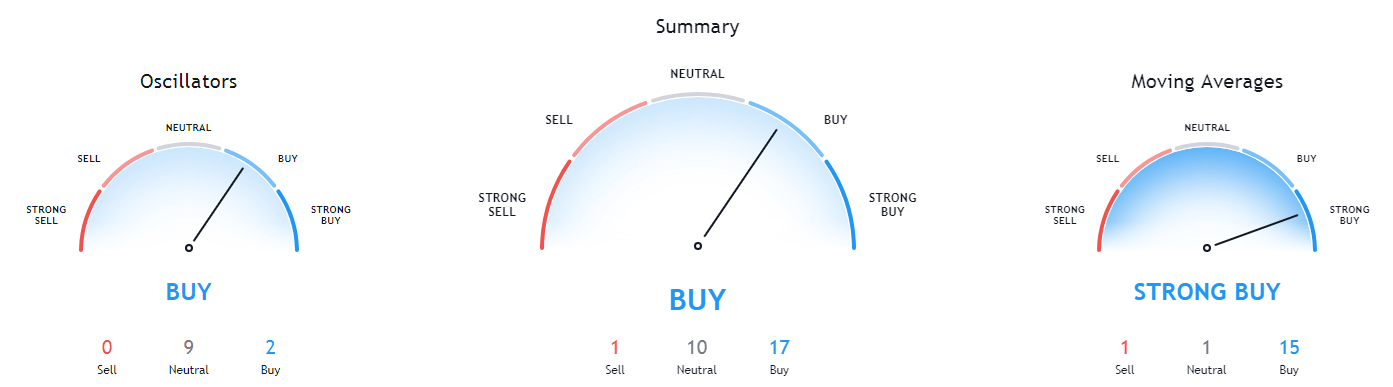
ETH/USD 1-day Technicals
Technical Factors (1-hour Chart):
- Price is above both its 50-period and its 21-period EMA
- Price is near its top Bollinger band
- RSI is neutral (64.19)
- Volume is slightly below average
Key levels to the upside: Key levels to the downside:
1: $1,183.85 1: $1,060.5
2: $1,211 2: $1,047.5
3: $1,226.5 3: $992
Litecoin
While Litecoin did follow Bitcoin’s price direction, it did so with much less conviction and intensity. Its price managed to pass the $142.1 level to the upside and establish its price above it but failed to move into the upper half of the trading range bound by $142.1 to the downside and $161.5 to the upside.
Litecoin currently has a very nicely-built support zone, while its upside is quite open. If Bitcoin’s price remains the same, traders can expect LTC to try to push towards or even contest the $161.5 level.
LTC/USD 1-hour Chart
Litecoin’s technicals on the shorter time-frames (4-hour, daily, and weekly) show overall tilt to the buy-side with hints of neutrality. Its monthly time-frame, however, is completely bullish.
LTC/USD 1-day Technicals
Technical factors (1-hour Chart):
- Its price is slightly above its 50-period EMA and its 21-period EMA
- Price slightly above its middle Bollinger band
- RSI is neutral (57.08)
- Volume is descending
Key levels to the upside: Key levels to the downside:
1: $161.5 1: $142.1
2: $181.3 2: $128.42
3: $186.3 3: $114.75
Related posts
 Daily Crypto Review, Jan 12 – XLM Back in the top10 Cryptos by Market Cap; Crypto Sector in the Green
 Daily Crypto Review, Jan 19 – Ether Breaks $1,300; Litecoin Skyrockets
 Daily Crypto Review, Jan 25 – Ethereum Reaches a new All-Time High: What’s Next?
 Daily Crypto Review, Jan 27 – Bitcoin (BTC), Ethereum (ETH), Litecoin (LTC) Price Analysis