


The crypto sector ended up either slightly red or slightly green, with only rare exceptions making significant moves to either side. Bitcoin is currently trading for $31,679, representing an increase of 0.51% compared to yesterday’s value. Meanwhile, Ethereum’s price has decreased by 1.61% on the day, while LTC lost 3.33% of its value.
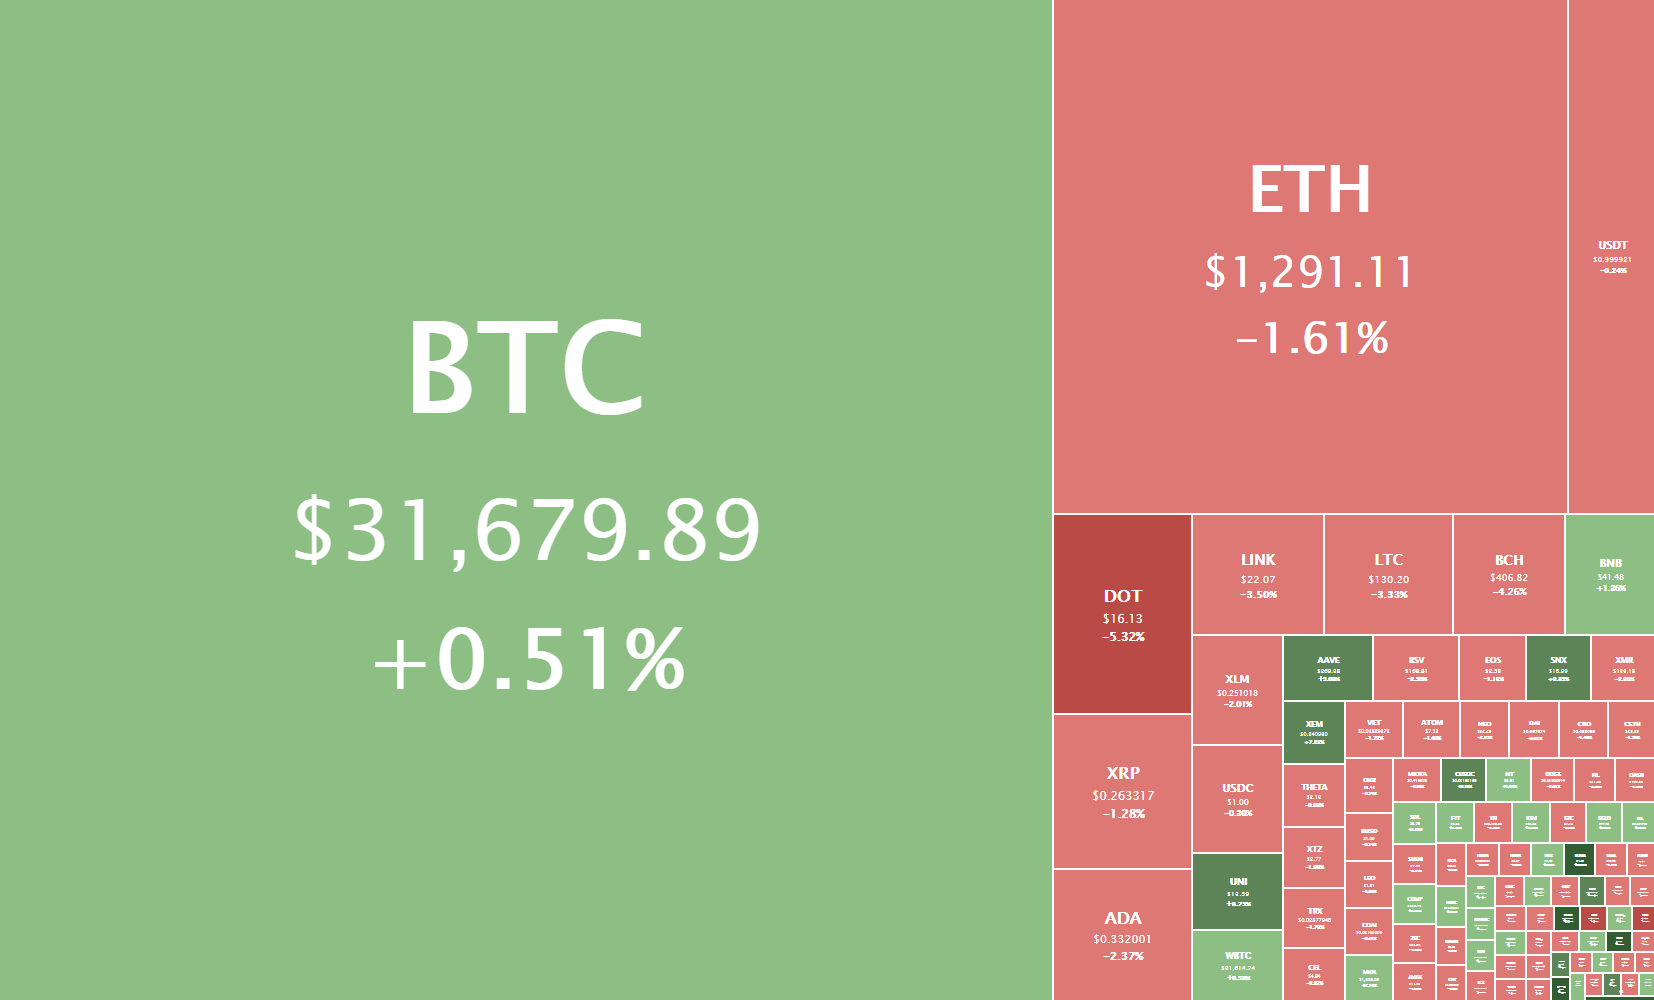
Daily Crypto Sector Heat Map
Coupon Chain gained 74575.19% in the past 24 hours, making it the most prominent daily crypto gainer by far. It is followed by YVS.Finance’s 683.5% and Chonk’s 198.23% gain. On the other hand, Narwhale.finance lost 72.98%, making it the most prominent daily loser. It is followed by 3X Short Matic Token’s loss of 67.68% and MangoChain’s loss of 66.24%.

Top 10 24-hour Performers (Click to enlarge)

Bottom 10 24-hour Performers (Click to enlarge)
Bitcoin’s market dominance increased slightly from when we last reported, currently 63.1%. This represents a 0.2% increase from our previous report.
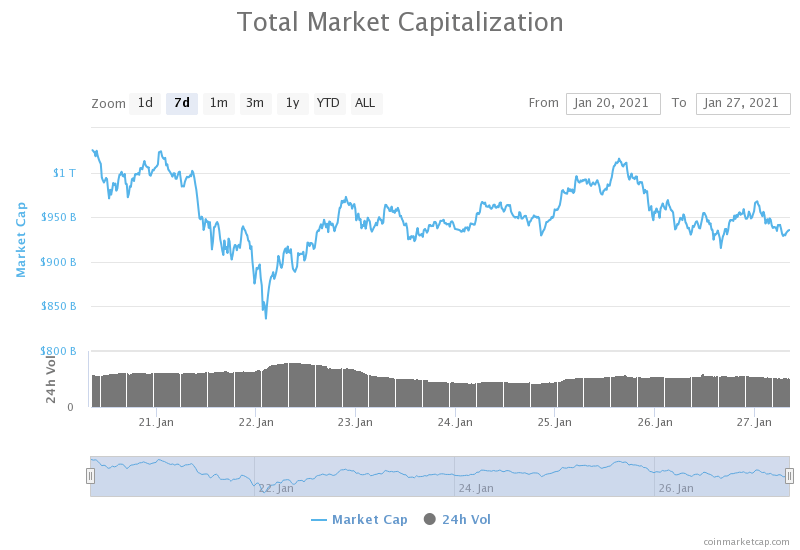
Weekly Crypto Market Cap Chart
The cryptocurrency sector’s market capitalization has decreased very slightly since we last reported, with its current value being $935.58 billion. This represents a $0.96 billion decrease when compared to our previous report.
_______________________________________________________________________
What happened in the past 24 hours?
_______________________________________________________________________
- Union Square Ventures expects to invest ‘around 30%’ of its new $250m fund in crypto industry (The Block)
- Pantera is moving to launch a new fund aimed at institutional bitcoin investors (The Block)
- KPMG resigns as Singapore blockchain firm’s auditor after hedge fund’s damning report (The Block)
- Bitmain CEO Steps Down From World’s Largest Bitcoin Mining Manufacturer (Cryptobriefing)
- Tether Issuance Hits $25 Billion as USDT on Exchanges, DeFi Reaches New High (Cryptobriefing)
- Ripple Expands in Asia Pacific Despite Legal Uncertainty (Cryptobriefing)
- Bank of England governor is bearish on Bitcoin, but sees growth of CBDCs (Cryptoslate)
- Binance CEO: We’re in the early stages of a multi-year crypto bull cycle (Cryptoslate)
- Former Goldman Sachs exec Raoul Pal: Bitcoin price could hit $50,000 by March (Cryptoslate)
- Bitcoin Falls as Miners Sell, Institutions Watch Yellen (Coindesk)
_______________________________________________________________________
Technical analysis
_______________________________________________________________________
Bitcoin

After a day of attempting to break out of its slightly descending channel, Bitcoin has returned to the downtrend. The largest cryptocurrency by market cap tried to regain the $32,350 level but failed in doing so. This created a strong sell-wall above its current price of just below $32,000.
Bitcoin’s immediate upside is guarded by the 21-hour and 50-hour EMAs, as well as the 32,350 level. Its downside, however, is a free-fall until the zone above $30,000.
BTC/USD 1-hour chart
Bitcoin’s daily overview is mostly neutral (with some hints of bearishness), while its weekly and monthly overviews are slightly bullish. On the other hand, its 4-hour time-frame is completely bearish.
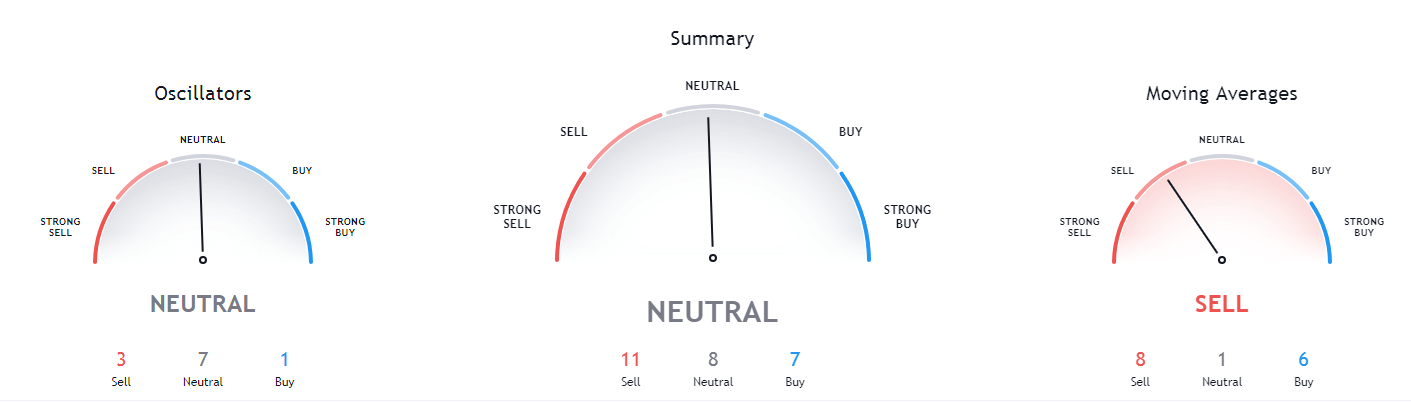
BTC/USD 1-day Technicals
Technical factors (1-hour Chart):
- Price is slightly below its 50-period EMA and its 21-period EMA
- Price is slightly under its middle Bollinger band
- RSI is neutral (46.41)
- Volume is average
Key levels to the upside: Key levels to the downside:
1: $32,350 1: $30,072
2: $34,627 2: $30,000
3: $37,445 3: $27,960
Ethereum
The second-largest cryptocurrency by market cap returned to mirroring Bitcoin’s movement after entering its consolidation phase. Ethereum has, after failing to break the $1,350 level, returned to its slightly-downwards movement. The zone just above the $1,300 level mentioned yesterday was also broken, meaning that ETH is now trading between $1,211 to the downside and $1,350 to the upside.
Ethereum’s immediate upside is guarded by the 21-hour and 50-hour EMAs, as well as the $1,350 level. Its first major support level is sitting at $1,211.
ETH/USD 1-hour Chart
Ethereum’s technicals on the daily, weekly, and monthly time-frames are tilted towards the buy-side, but all have neutral oscillators. Its 4-hour overview, however, is completely neutral.

ETH/USD 1-day Technicals
Technical Factors (1-hour Chart):
- Price is slightly below both its 50-period and its 21-period EMA
- Price slightly below its middle Bollinger band
- RSI is neutral (46.02)
- Volume is average
Key levels to the upside: Key levels to the downside:
1: $1,350 1: $1,211
2: $1,420 2: $1,183.85
3: $1,440 3: $1047.6
Litecoin
Litecoin has seemingly created a double bottom formation after hitting and staying above the $128.4 level twice. This may be a bullish signal for LTC traders, but the move needs to be accompanied by at least a slight increase in volume.
Despite creating a double bottom, LTC will have a hard time moving past the 21-hour and 50-hour EMAs, as they seem to be its immediate resistance levels. On the other hand, its $128.4 support level is holding up well for now, making it very uncertain where LTC will go in the short-term.
LTC/USD 1-hour Chart
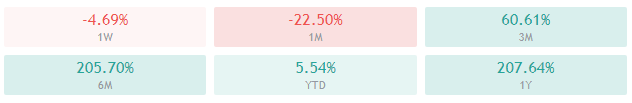
Litecoin’s daily overview is mostly neutral (with some hints of bearishness), while its weekly and monthly overviews are slightly bullish. On the other hand, its 4-hour time-frame is completely bearish.
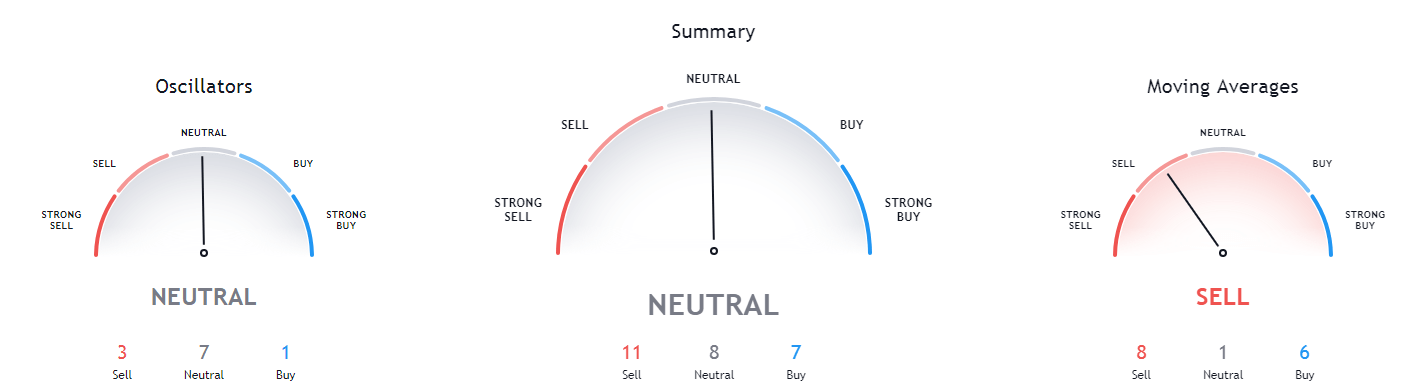
LTC/USD 1-day Technicals
Technical factors (1-hour Chart):
- Its price is below both its 50-period EMA and its 21-period EMA
- Price slightly below its middle Bollinger band
- RSI is neutral (41.89)
- Volume is slightly below average
Key levels to the upside: Key levels to the downside:
1: $142.1 1: $128.42
2: $161.5 2: $120
3: $181.3 3: $114.75
Related posts
 Daily Crypto Review, Jan 12 – XLM Back in the top10 Cryptos by Market Cap; Crypto Sector in the Green
 Daily Crypto Review, Jan 15 – Bitcoin Retraces After Hitting $40k; Ethereum Contests $1.2k
 Daily Crypto Review, Jan 21 – BTC in a Triangle Formation – What do the Analysts Say?
 Daily Crypto Review, Jan 26 – Blood on the Streets: Crypto Market in the Red