
The crypto sector ended up almost completely in the red as most cryptocurrencies pulled back to lower levels. Bitcoin is currently trading for $31,575, representing a decrease of 5.26% compared to yesterday’s value. Meanwhile, Ethereum’s price has decreased by 7.24% on the day, while LTC lost 6.79% of its value.

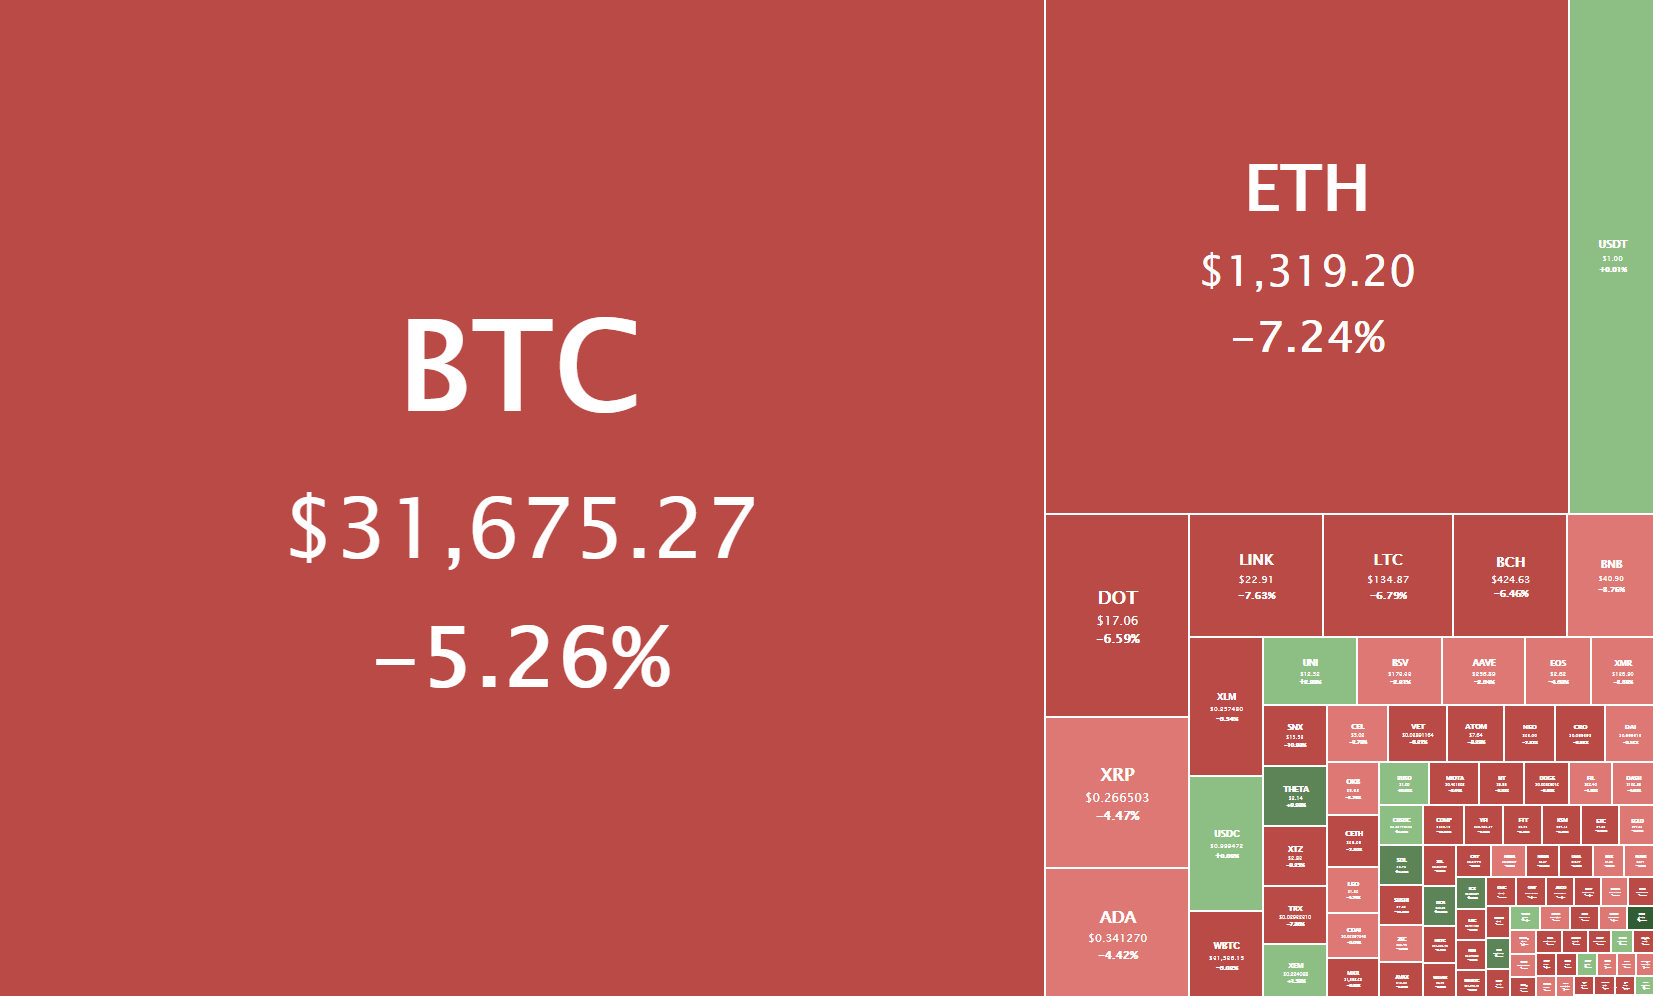
Daily Crypto Sector Heat Map
EveryCoin gained 501.69% in the past 24 hours, making it the most prominent daily crypto gainer by far. It is followed by BBYS’s 280.04% and X Infinity’s 255.24% gain. On the other hand, ARTH lost 61.58%, making it the most prominent daily loser. It is followed by Typhoon Cash’s loss of 44.07% and Aventus’s loss of 40.31%.
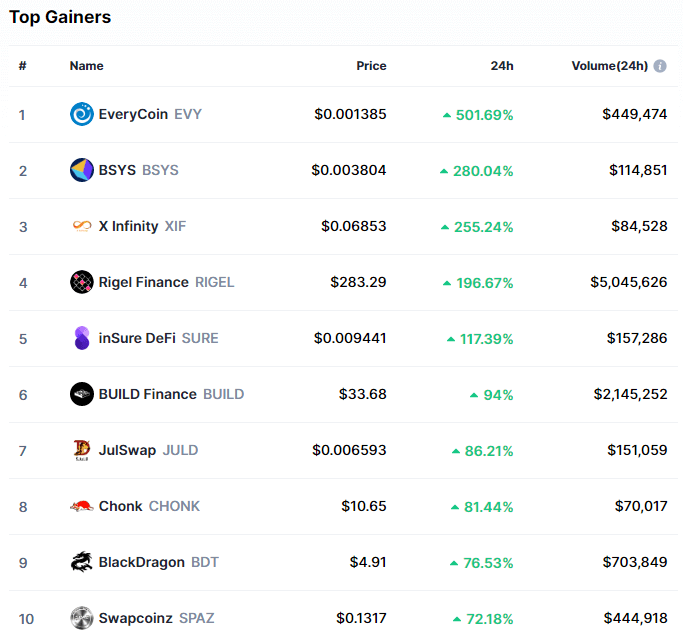
Top 10 24-hour Performers (Click to enlarge)
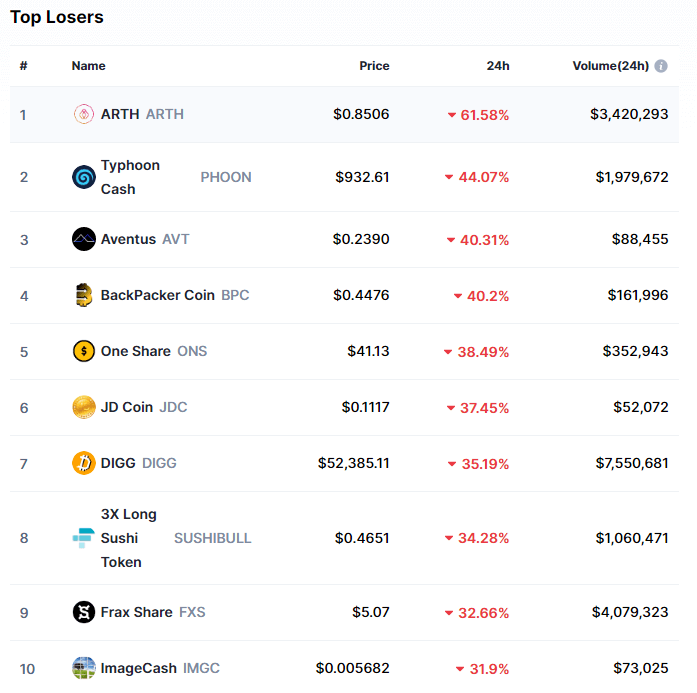
Bottom 10 24-hour Performers (Click to enlarge)
Bitcoin’s market dominance increased slightly from when we last reported, with its value currently being 62.9%. This represents a 0.2% increase from our previous report.
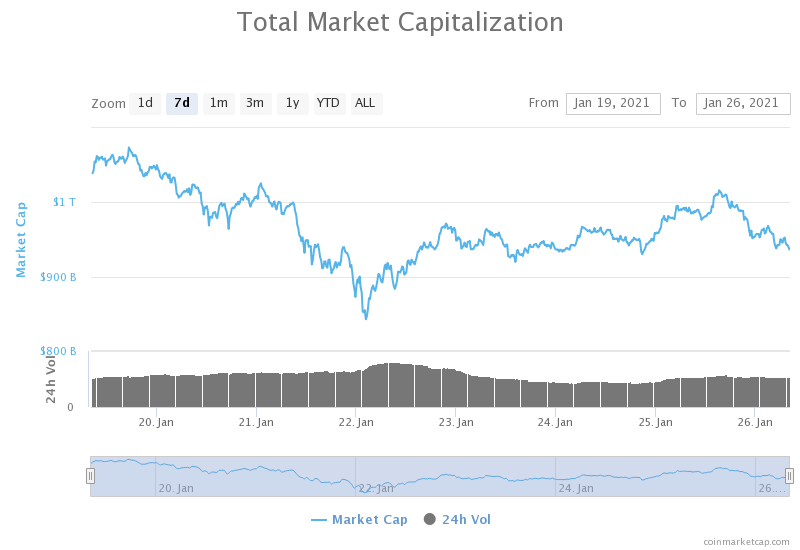
Weekly Crypto Market Cap Chart
The cryptocurrency sector’s market capitalization has decreased greatly since we last reported, with its current value being $936.54 billion. This represents a $54.92billion decrease when compared to our previous report.
_______________________________________________________________________
What happened in the past 24 hours?
_______________________________________________________________________
- January sees $237 billion in monthly stablecoin volume thus far, breaking prior record (The Block)
- Cryptocurrencies could serve role as electronic store of value: Bank of Singapore chief economist (The Block)
- Bank of England governor says a ‘lasting’ digital currency has yet to be invented (The Block)
- Janet Yellen confirmed as the Biden administration’s Treasury Secretary (The Block)
- Yearn Could Steal DeFi Spotlight From Aave, Uniswap (Cryptobriefing)
- Russians Donate $120,000 of BTC for Navalny’s Release (Cryptobriefing)
- The dominoes are falling: Another NASDAQ-listed firm just bought Bitcoin (Cryptoslate)
- Harvard, Yale, Brown Endowments Have Been Buying Bitcoin for at Least a Year: Sources (Coindesk)
- 3 reasons Bitcoin abruptly dropped by 7.4% overnight (Cointelegraph)
- Glassnode predicts BTC break-out as investors refuse to realize losses (Cointelegraph)
_______________________________________________________________________
Technical analysis
_______________________________________________________________________
Bitcoin

Bitcoin’s gains in the past two days were taken away when bears took over the market after BTC failed to break the $34,627 mark. The cryptocurrency declined to the $32,350 level but quickly lost hold of it as well. BTC is currently hovering right above the $31,000 mark.
Bitcoin’s 1-hour RSI is getting dangerously close to the oversold territory, while its volume is descending, indicating a possible price stagnation or a direction reversal.
BTC/USD 1-hour chart
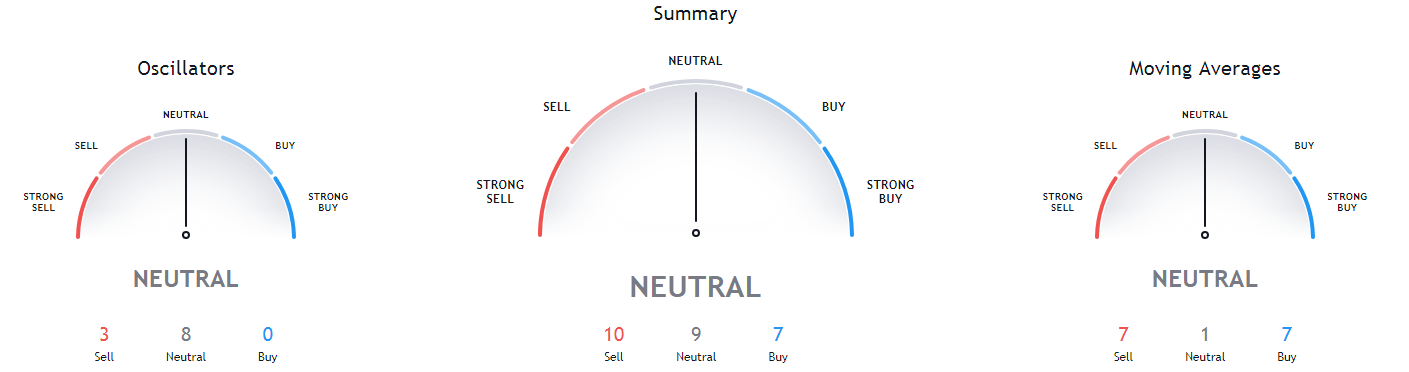
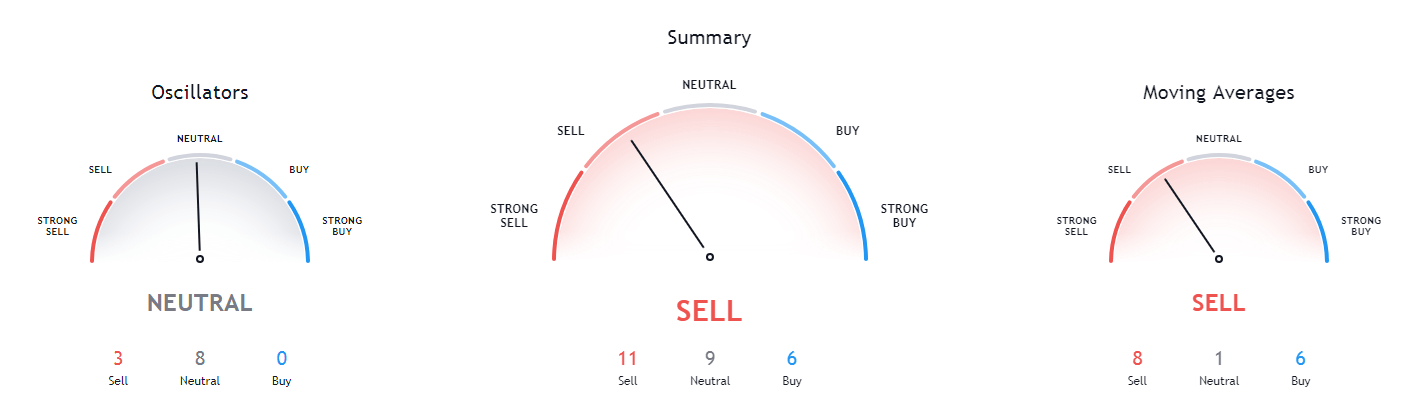
Bitcoin’s daily overview is completely neutral, while its weekly and monthly overviews are completely bullish. On the other hand, the 4-hour time-frame is completely bearish.
BTC/USD 1-day Technicals
Technical factors (1-hour Chart):
- Price is below its 50-period EMA and its 21-period EMA
- Price is close to its bottom Bollinger band
- RSI is near the oversold area (31.21)
- Volume is average
Key levels to the upside: Key levels to the downside:
1: $32,350 1: $30,072
2: $34,627 2: $30,000
3: $37,445 3: $27,960
Ethereum
The second-largest cryptocurrency by market cap spent the day retracing after posting a new all-time high at $1,477.30. ETH tested many levels but ultimately fell below the previous all-time high, and then the $1,420 and $1,350 levels as well. It is currently consolidating just above $1,300.
Ethereum seemingly created a zone of support just above the $1,300 level, which is holding up for 10 hours now. If this support holds long enough for BTC to change its price direction (or at least enter a sideways trading period), we may see ETH bulls reentering the market once again.
ETH/USD 1-hour Chart
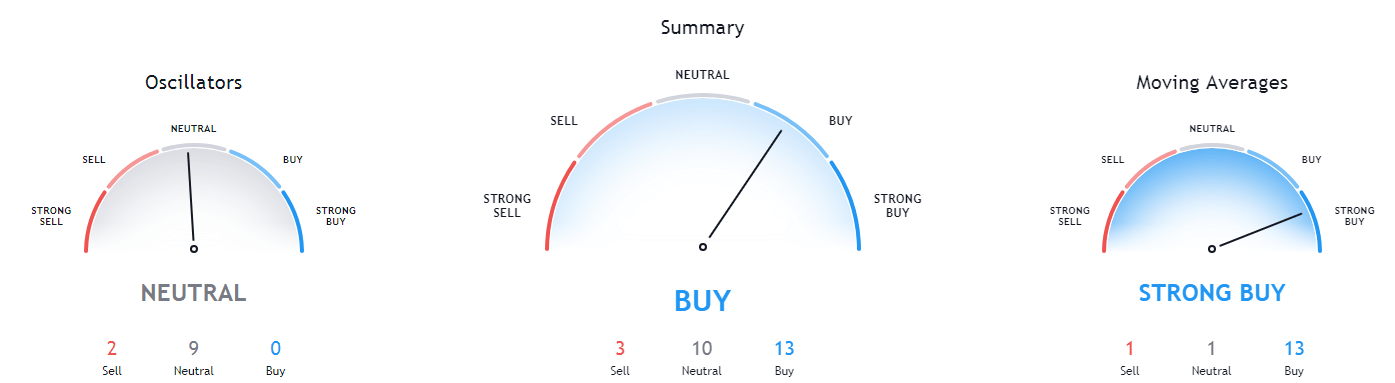
Ethereum’s technicals on all time-frames are slightly tilted towards the buy-side, with its oscillators taking a more neutral stance.
ETH/USD 1-day Technicals
Technical Factors (1-hour Chart):
- Price is below both its 50-period and its 21-period EMA
- Price near its bottom Bollinger band
- RSI is very close to being oversold (39.73)
- Volume is average
Key levels to the upside: Key levels to the downside:
1: $1,350 1: $1,211
2: $1,420 2: $1,183.85
3: $1,440 3: $1047.6
Litecoin
Litecoin has lost all of the gains it made yesterday, and then some. The eighth-largest cryptocurrency by market cap failed to pass the zone just under $150, which triggered a pullback and a dip below the $142.1 support (now resistance) level. On top of that, LTC also fell below the trading range it was in for the previous four days (excluding yesterday’s push).
LTC/USD 1-hour Chart
Litecoin’s short-term and long-term overviews have opposing stances: while its 4-hour and overviews show a slight tilt towards the sell-side, its weekly and monthly overviews are slightly bullish.
LTC/USD 1-day Technicals
Technical factors (1-hour Chart):
- Its price is below its 50-period EMA and its 21-period EMA
- Price slightly above its bottom Bollinger band
- RSI is close to being in the oversold territory (33.05)
- Volume is average
Key levels to the upside: Key levels to the downside:
1: $142.1 1: $128.42
2: $161.5 2: $120
3: $181.3 3: $114.75
Related posts
 Daily Crypto Review, Jan 20 – ETH Reaches a New All-Time High; Crypto Sector in the Red
 Daily Crypto Review, Jan 22 – Bitcoin Briefly Drops Below $30K; Market Sees Blood on the Streets
 Daily Crypto Review, Jan 28 – Bitcoin Strong Bounce off the 30K level, Altcoins Reversals Followed
 Daily Crypto Review, Jan 29 – Dogecoin Skyrockets as r/Wallstreetbets Enters on Crypto; Bitcoin Jumps on Elon Musk’s Twitter Profile