

The crypto sector ended up almost completely in the red, though most cryptos barely lost any value. Bitcoin is currently trading for $31,200, representing a decrease of 1.13% compared to yesterday’s value. Meanwhile, Ethereum’s price has decreased by 0.95% on the day, while LTC lost 2.06% of its value.
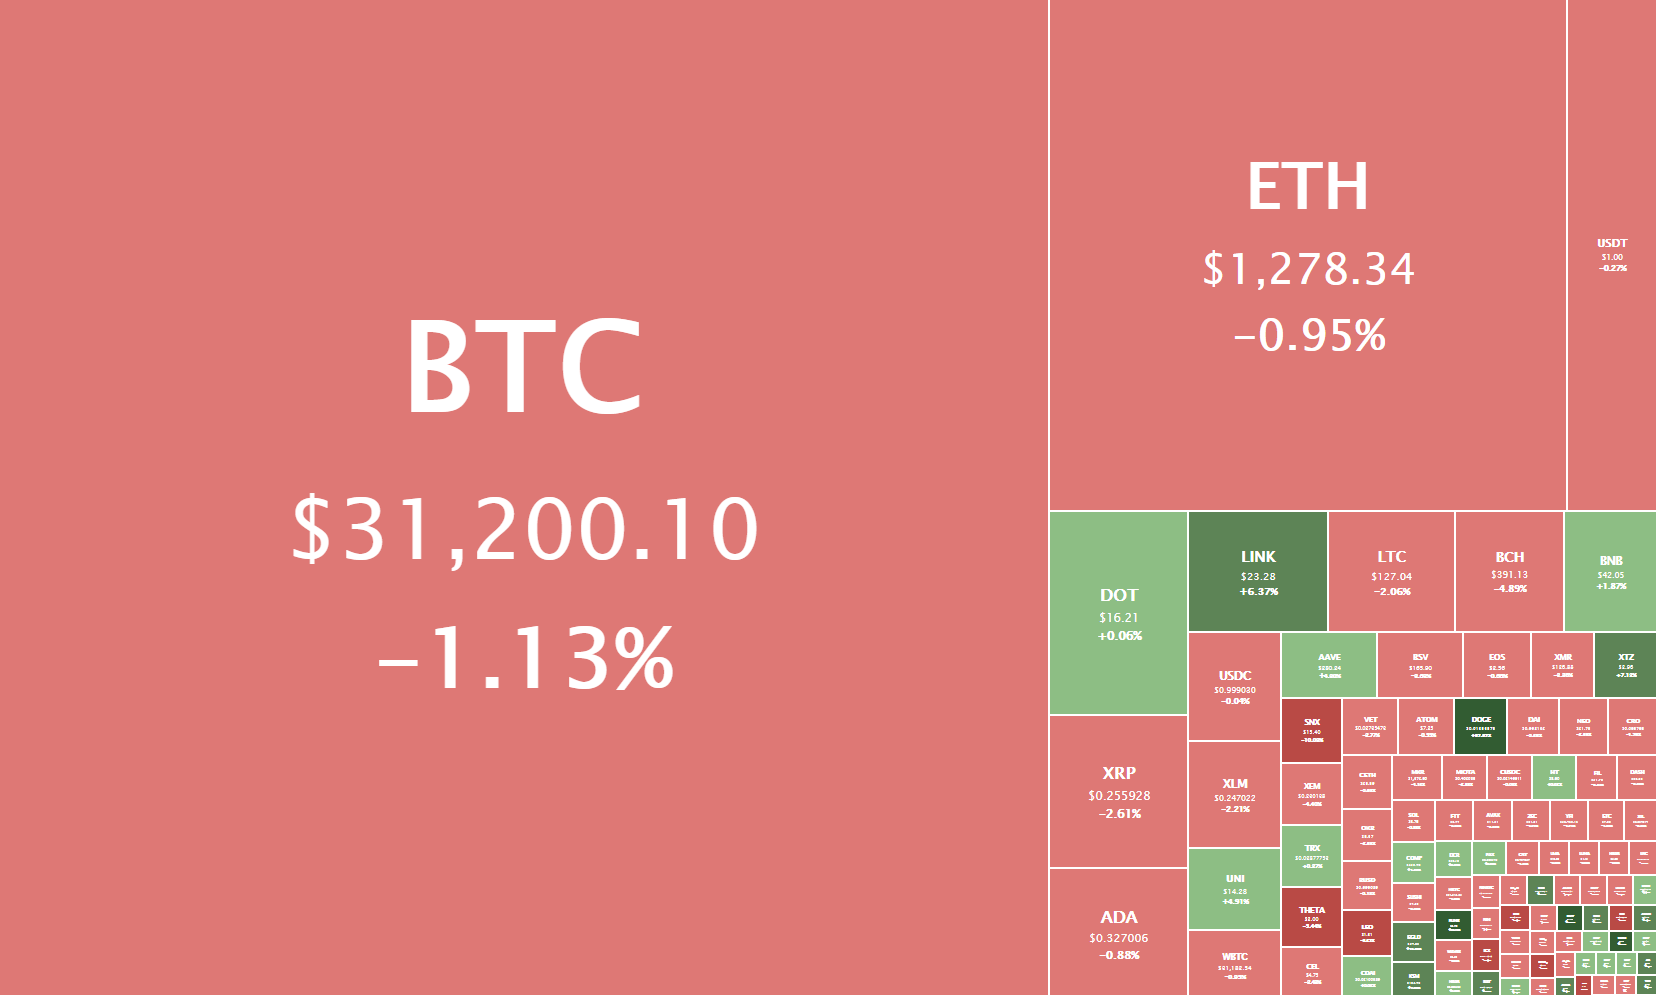
Daily Crypto Sector Heat Map
Zero Collateral Dai gained 828.50% in the past 24 hours, making it the most prominent daily crypto gainer by far. It is followed by QuadrantProtocol’s 327.68% and 3x Long Dogecoin Token’s 137.80% gain. On the other hand, EveryCoin lost 89.97%, making it the most prominent daily loser. It is followed by Zugacoin’s loss of 79.94% and TokenPay’s loss of 50.46%.

Top 10 24-hour Performers (Click to enlarge)
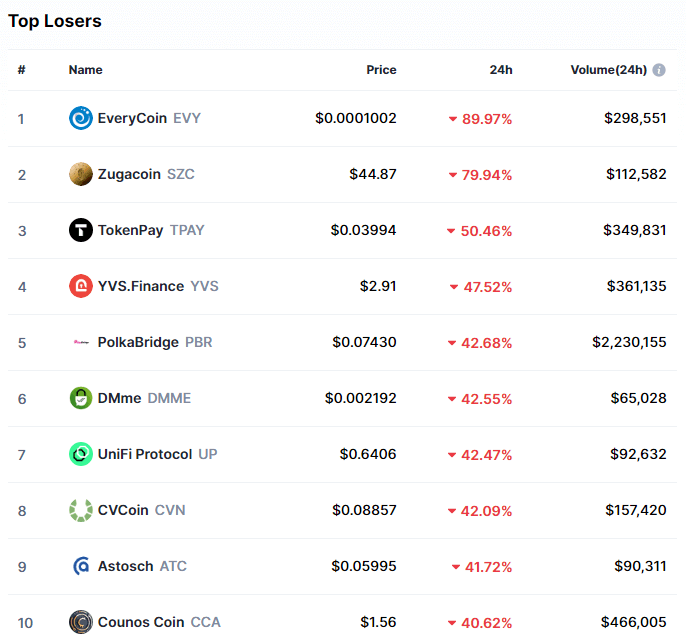
Bottom 10 24-hour Performers (Click to enlarge)
Bitcoin’s market dominance decreased slightly from when we last reported, currently 62.9%. This represents a 0.2% decrease from our previous report.
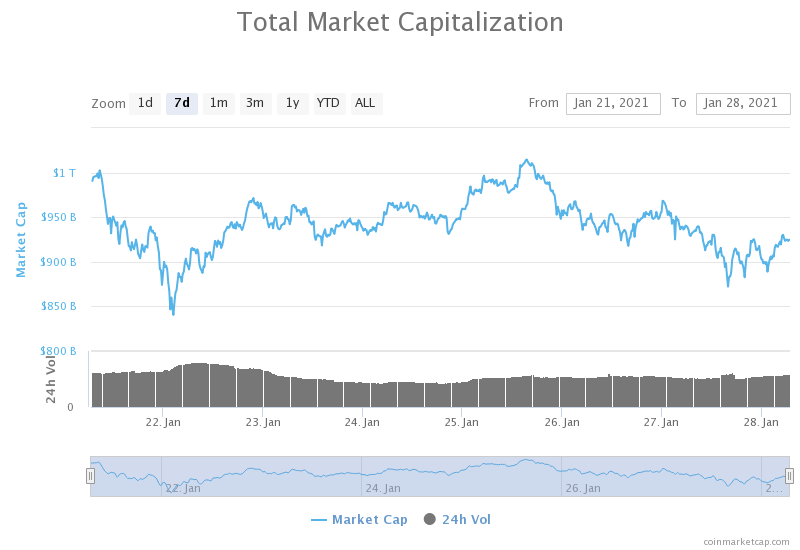
Weekly Crypto Market Cap Chart
The cryptocurrency sector’s market capitalization has decreased very slightly since we last reported, with its current value being $924.75 billion. This represents a $10.78 billion decrease when compared to our previous report.
_______________________________________________________________________
What happened in the past 24 hours?
_______________________________________________________________________
- BIS: Two-thirds of surveyed central banks are studying stablecoin impact on monetary and financial stability (The Block)
- Blockstream buys $25 million worth of bitcoin mining hardware from MicroBT (The Block)
- ECB’s Lagarde says technology questions remain for a potential digital euro (The Block)
- Reddit To Expand Points With Ethereum Foundation (Cryptobriefing)
- Bitcoin, Ethereum at Risk of Painful Correction After Losing Crucial Support (Cryptobriefing)
- Dogecoin Is Now Available on Ethereum for DeFi Users (Cryptobriefing)
- What venture capitalists look for in crypto startups and entrepreneurs (Cryptoslate)
- Bitcoin ETF unlikely until market cap reaches $2 trillion, fund manager says (Cryptoslate)
- Early Bitcoin advocate Chamath Palihapitiya to contest for California governor (Cryptoslate)
- Guggenheim says institutional demand not enough to keep BTC above $30K (Cointelegraph)
_______________________________________________________________________
Technical analysis
_______________________________________________________________________
Bitcoin
After another day of its price moving towards the downside, Bitcoin attempted a rally towards the $32,350 mark. After its price establishing strong support at the $30,000 level, the largest cryptocurrency by market cap started surging. There is a strong chance that BTC will pass the $32,350 level if the hourly candle ends up above the 21-hour EMA.
Scott Minerd, the CIO of investment services firm Guggenheim, said that the institutional demand is insufficient to keep BTC above $30,000. Many analysts agree with this short-term assessment, while almost all of them are bullish in the long-term.
BTC/USD 1-hour chart
Bitcoin’s daily overview is mostly neutral (with some hints of bearishness), while its weekly and monthly overviews are tilted towards the buy-side. On the other hand, its 4-hour time-frame is completely bearish.
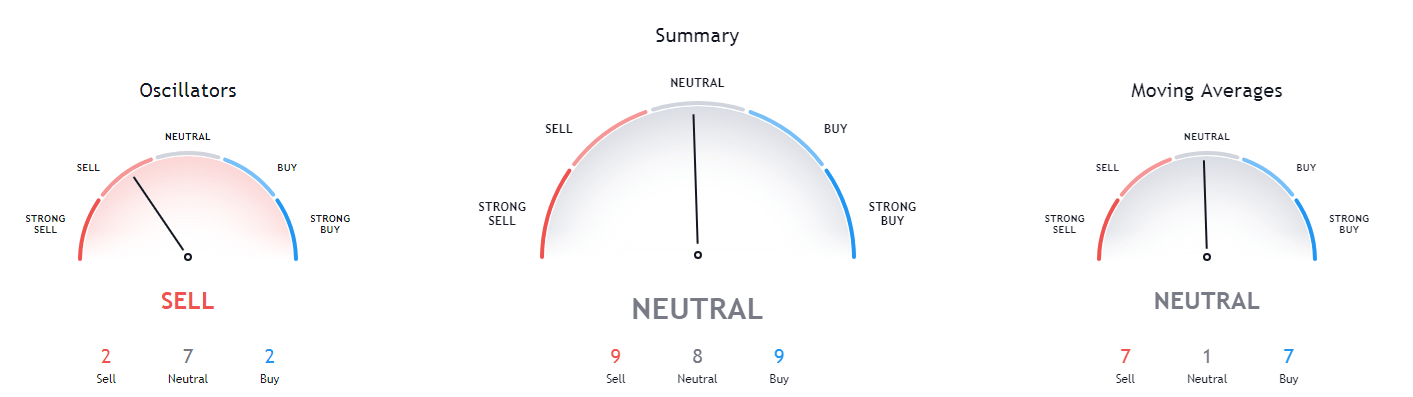
BTC/USD 1-day Technicals
Technical factors (1-hour Chart):
- Price is above its 50-period EMA and its 21-period EMA
- Price is slightly above its middle Bollinger band
- RSI is neutral (56.39)
- Volume is above average
Key levels to the upside: Key levels to the downside:
1: $32,350 1: $30,072
2: $34,627 2: $30,000
3: $37,445 3: $27,960
Ethereum

The second-largest cryptocurrency by market cap spent the day testing the $1,211 level multiple times. After the support level held up on various occasions, ETH bulls entered the market and started pushing its price up. However, it is still uncertain whether this push towards the upside will end as another lower high and a continuation of the downtrend, or a break from the trend.
Ethereum’s immediate downside is guarded by the 21-hour and 50-hour EMAs, while its first major resistance level is the $1,350 mark, as well as the descending line that connects ETH’s recent lower highs.
ETH/USD 1-hour Chart
Ethereum’s technicals on the daily, weekly, and monthly time-frames are tilted towards the buy-side but also show some neutrality. Its 4-hour overview, however, is slightly bearish.
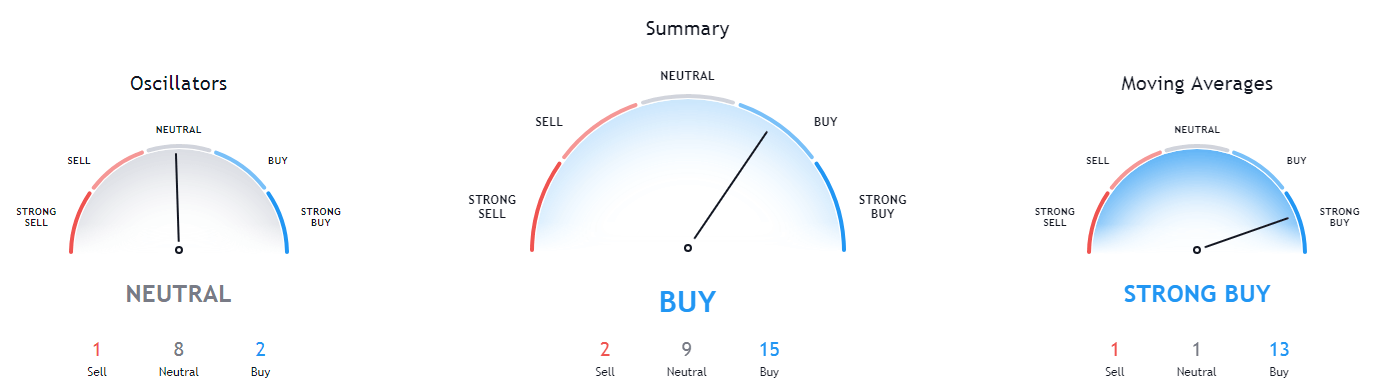
ETH/USD 1-day Technicals
Technical Factors (1-hour Chart):
- Price is above both its 50-period and its 21-period EMA
- Price at its top Bollinger band
- RSI is neutral (57.04)
- Volume is average
Key levels to the upside: Key levels to the downside:
1: $1,350 1: $1,211
2: $1,420 2: $1,183.85
3: $1,440 3: $1047.6
Litecoin
Litecoin managed to break out from its downtrend after breaking the $128.4 mark. What’s surprising is that such a strong trend was broken by just average volume. LTC found support in the 21-hour EMA, which currently stands right below the price level.
Litecoin has a zone of heavy resistance straight above it (above $130). It is very unlikely that it can “survive” without a major boost in volume, especially in these market conditions.
LTC/USD 1-hour Chart
Litecoin’s daily overview is mostly neutral (with some hints of bearishness), while its weekly and monthly overviews are tilted towards the buy-side. On the other hand, its 4-hour time-frame is completely bearish.
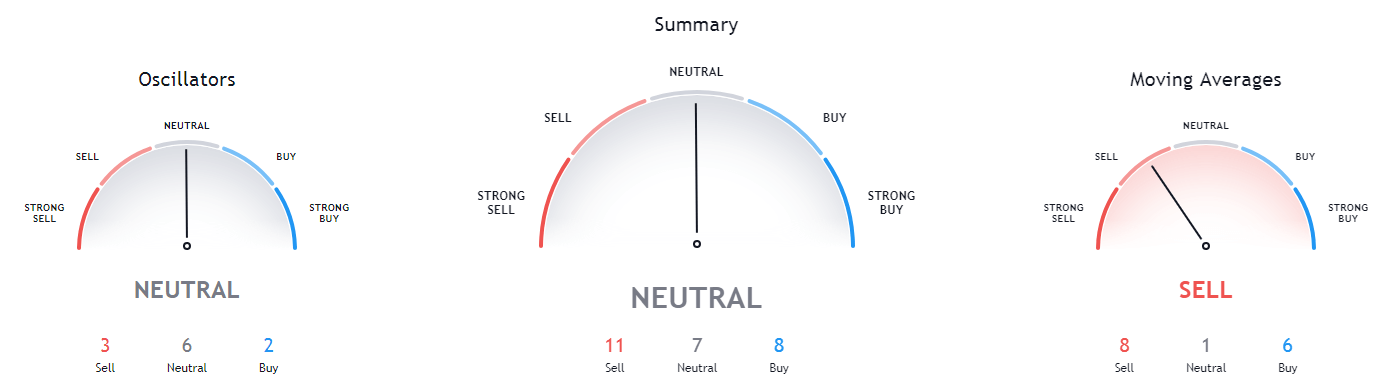
LTC/USD 1-day Technicals
Technical factors (1-hour Chart):
- Its price is above both its 50-period EMA and its 21-period EMA
- Price at its top Bollinger band
- RSI is neutral (58.51)
- Volume is average
Key levels to the upside: Key levels to the downside:
1: $142.1 1: $128.42
2: $161.5 2: $120
3: $181.3 3: $114.75
Related posts
 Daily Crypto Review, Jan 8 – Bitcoin Continues Its Rise as it Breaks the $40k Mark Briefly
 Daily Crypto Review, Jan 11 – Crypto Sector Plummets as BTC Drops to $32k
 Daily Crypto Review, Jan 20 – ETH Reaches a New All-Time High; Crypto Sector in the Red
 Daily Crypto Review, Jan 22 – Bitcoin Briefly Drops Below $30K; Market Sees Blood on the Streets