
The crypto sector ended up almost completely in the red as Bitcoin’s drop below $30,000 (at one point) led the market down. Bitcoin is currently trading for $31,730, representing a decrease of 8.41% compared to yesterday’s value. Meanwhile, Ethereum’s price has decreased by 11.29% on the day, while LTC lost 4.76% of its value.
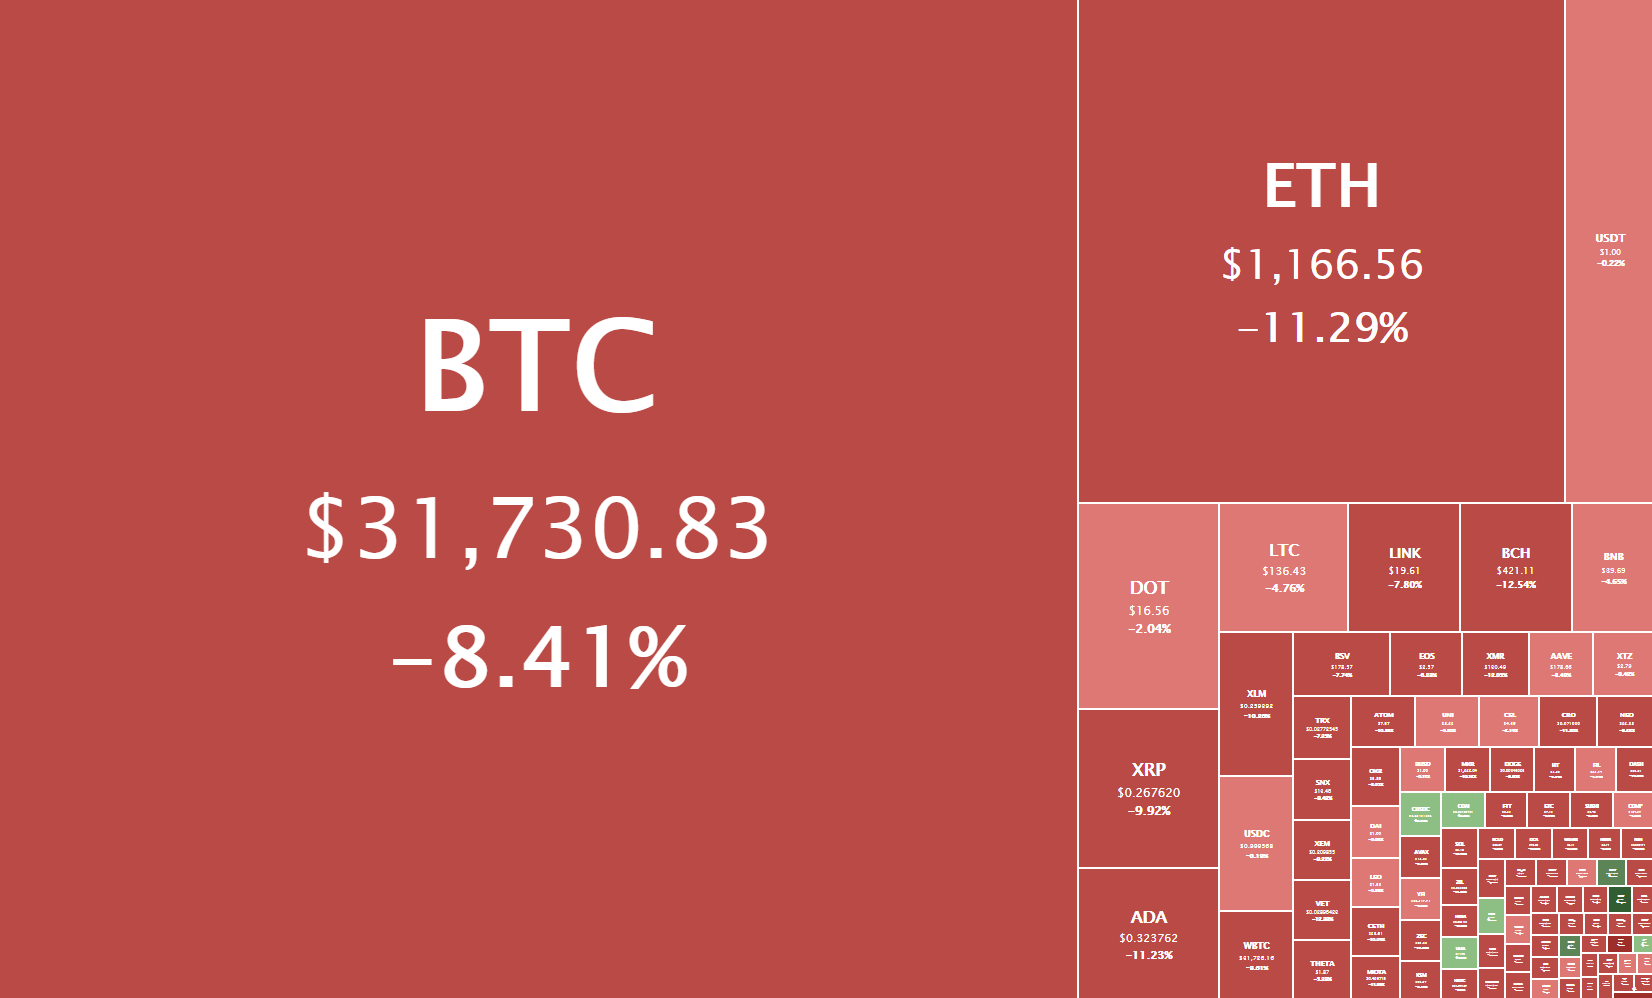
Daily Crypto Sector Heat Map
EveryCoin gained 734.83% in the past 24 hours, making it the most prominent daily crypto gainer by far. It is followed by Vox.Finance’s 132.94% and DACC’s 129.86% gain. On the other hand, PegsShares lost 99.20%, making it the most prominent daily loser. It is followed by Mithril Share’s loss of 75.17% and Chimpion’s loss of 59.53%.
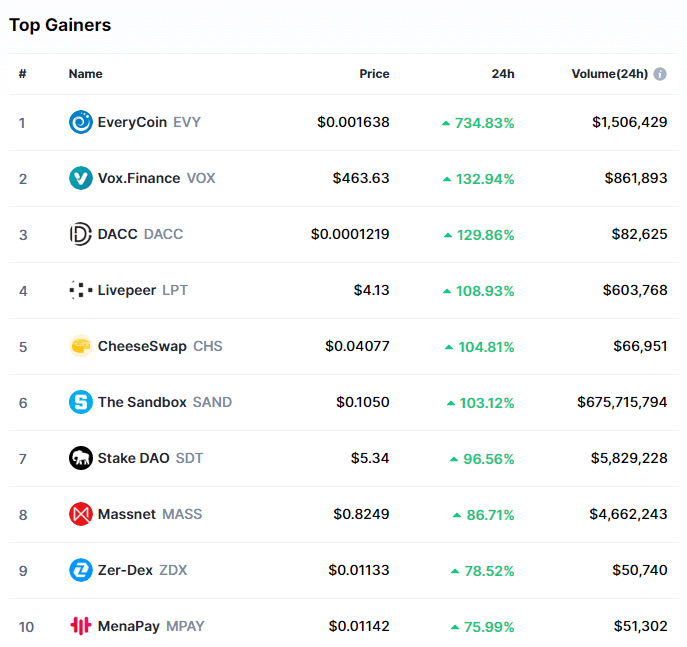
Top 10 24-hour Performers (Click to enlarge)
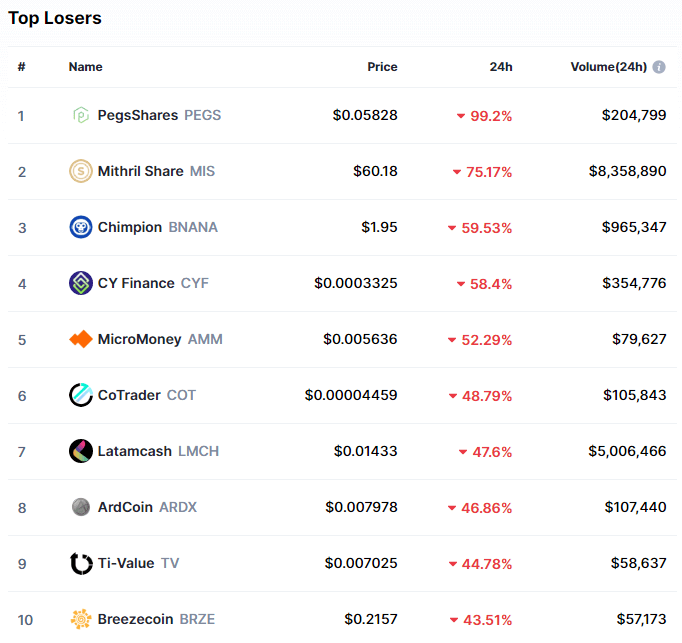
Bottom 10 24-hour Performers (Click to enlarge)
Bitcoin’s market dominance stayed at the same spot as when we last reported, with its value currently being 64.8%.
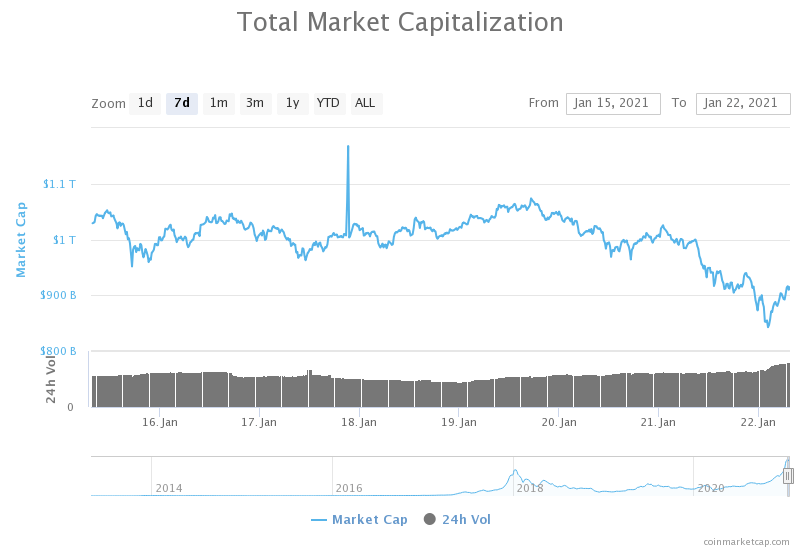
Weekly Crypto Market Cap Chart
The cryptocurrency sector’s market capitalization has decreased greatly since we last reported, with its current value being $914.56 billion. This represents a $10.97 billion decrease when compared to our previous report.
_______________________________________________________________________
What happened in the past 24 hours?
_______________________________________________________________________
- Acting chair of SEC named as Gary Gensler awaits confirmation (The Block)
- Sberbank seeks central bank approval for blockchain platform: report (The Block)
- The city of Shenzhen is planning yet another $3 million digital currency test (The Block)
- Kraken Introduces New Tokens for the UK and Australia (Cryptobriefing)
- Kyber 3.0 Will Introduce Dynamic Market Making (Cryptobriefing)
- Unpacking Bitcoin’s Recent “Double-Spend” Event (Cryptobriefing)
- How Phala Network is bringing on-chain privacy to the Polkadot (DOT) ecosystem (Cryptoslate)
- Former Ripple advisor to become US ‘Comptroller of the Currency’ under Joe Biden (Cryptoslate)
- Minority Mining Pools Threaten to Collude Against Contentious Ethereum Update (Coindesk)
- Is Grayscale is about to unveil a LINK Trust? (Cointelegraph)
_______________________________________________________________________
Technical analysis
_______________________________________________________________________
Bitcoin
Bitcoin has had a horrible day as bears took over the market. Its price dropped to as low as $28,800, but found support in its 50-day EMA. The downturn, however, means that the largest-cryptocurrency by market cap fell out of its triangle formation, most likely spelling a start of a short-term downtrend or sideways trading phase.
Bitcoin is very unpredictable at the moment, but traders could find an opportunity in looking for drastic volume increases and “catch the wave” of buyers or sellers (while taking into account all the support and resistance levels).
BTC/USD 1-hour chart
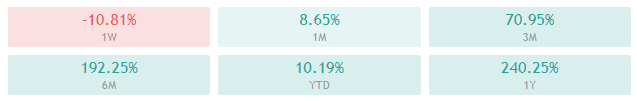
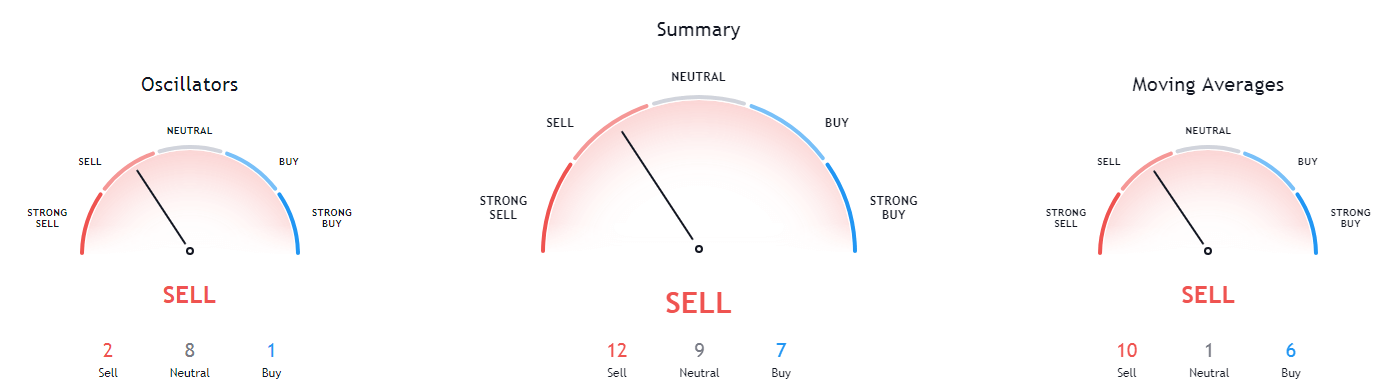
Bitcoin’s weekly and monthly time-frames are bullish but show some signs of neutrality or bearishness. On the other hand, its 4-hour and daily time-frames are completely bearish.
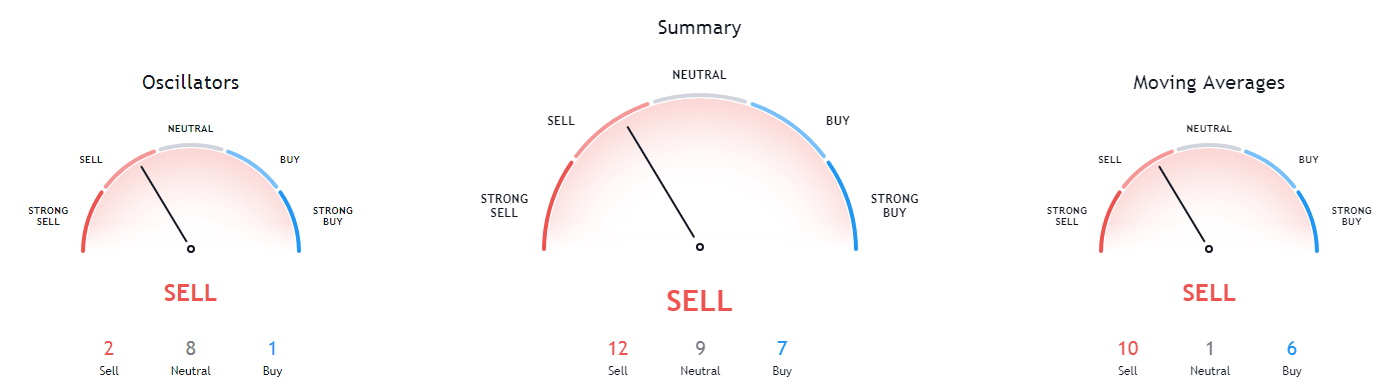
BTC/USD 1-day Technicals
Technical factors (1-hour Chart):
- Price is slightly below its 50-period EMA and at its 21-period EMA
- Price is at its middle Bollinger band
- RSI is neutral after returning from being oversold (48.04)
- Volume is above average
Key levels to the upside: Key levels to the downside:
1: $32,350 1: $30,072
2: $34,627 2: $30,000
3: $37,445 3: $27,960
Ethereum

The second-largest cryptocurrency by market cap followed Bitcoin’s direction, but with slightly less intensity. Ether’s price dropped below the $1,211 and $1,183.85 levels and found support in the $1,047.6 level. However, the bounce that came after the bulls came into the market was insufficient to break the $1,183.85 level, and Ethereum’s price is now trading just below it.
The $1,183.85 level could be considered a pivot point, and ETH’s short-term price direction will greatly depend on whether bulls manage to break this resistance.
ETH/USD 1-hour Chart
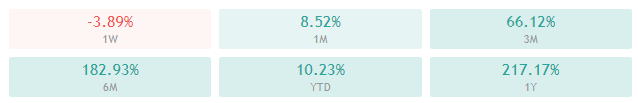
Ethereum’s technicals are still mostly tilted towards the buy-side, with its longer time-frames (weekly and monthly) being completely bullish, while its daily time frame’s oscillators are pointing to the sell-side. On the other hand, its 4-hour time-frame is completely bearish.
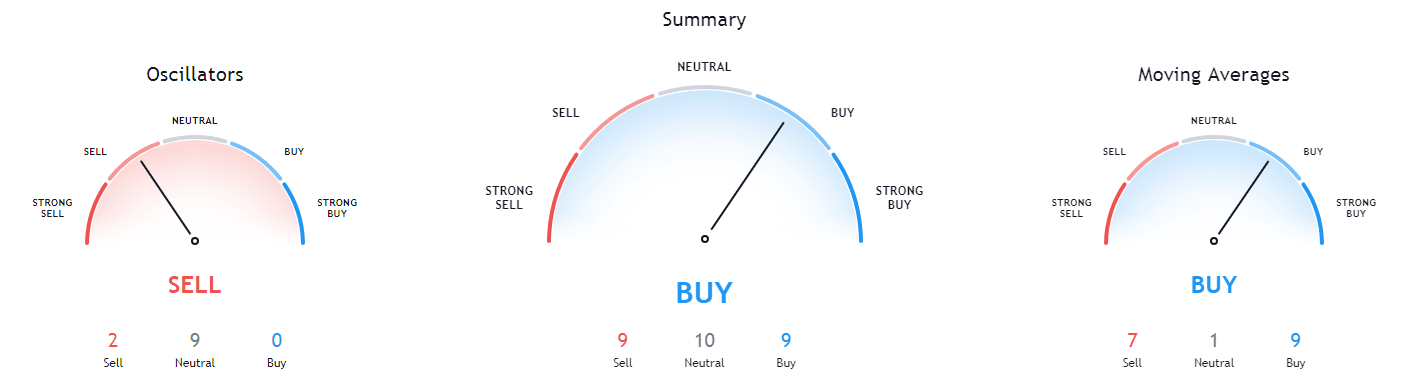
ETH/USD 1-day Technicals
Technical Factors (1-hour Chart):
- Price is below its 50-period and at its 21-period EMA
- Price is at its middle Bollinger band
- RSI is neutral (45.02)
- Volume is above average
Key levels to the upside: Key levels to the downside:
1: $1,183.85 1: $1047.5
2: $1,211 2: $960.5
3: $1,350 3: $932.5
Litecoin
Litecoin’s movement in the past 24 hours much resembled Ethereum, with its price dropping below the $142.1 level and finding support slightly below the $128.4 level. While its push up did not reach the now-resistance level of $142.1, Litcoin did find support in the 21-hour EMA.
Litecoin’s volume increase in recent hours is negligible compared to the increase that Bitcoin and Ethereum saw. This may indicate less intensity in the moves to come, regardless of the price direction.
LTC/USD 1-hour Chart
Litecoin’s weekly and monthly time-frames are completely bullish and but show no signs of neutrality or bearishness. On the other hand, its 4-hour and daily time-frames are completely bearish.
LTC/USD 1-day Technicals
Technical factors (1-hour Chart):
- Its price is slightly below its 50-period EMA and slightly above its 21-period EMA
- Price slightly above its middle Bollinger band
- RSI is neutral (51.31)
- Volume is slightly above average
Key levels to the upside: Key levels to the downside:
1: $142.1 1: $128.42
2: $161.5 2: $120
3: $181.3 3: $114.75
Related posts
 Daily Crypto Review, Jan 12 – XLM Back in the top10 Cryptos by Market Cap; Crypto Sector in the Green
 Daily Crypto Review, Jan 14 – Bitcoin Records Double-Digit Gains as it Passes $38K; Crypto Market in the Green
 Daily Crypto Review, Jan 25 – Ethereum Reaches a new All-Time High: What’s Next?
 Daily Crypto Review, Jan 27 – Bitcoin (BTC), Ethereum (ETH), Litecoin (LTC) Price Analysis