
The crypto sector pushed even higher as Bitcoin passed the $40,000 mark and created a new all-time high. Bitcoin is currently trading for $39,094, representing an increase of 5.35% compared to yesterday’s value. Meanwhile, Ethereum’s price has decreased by 1% on the day, while XRP gained 23.53% of its value.

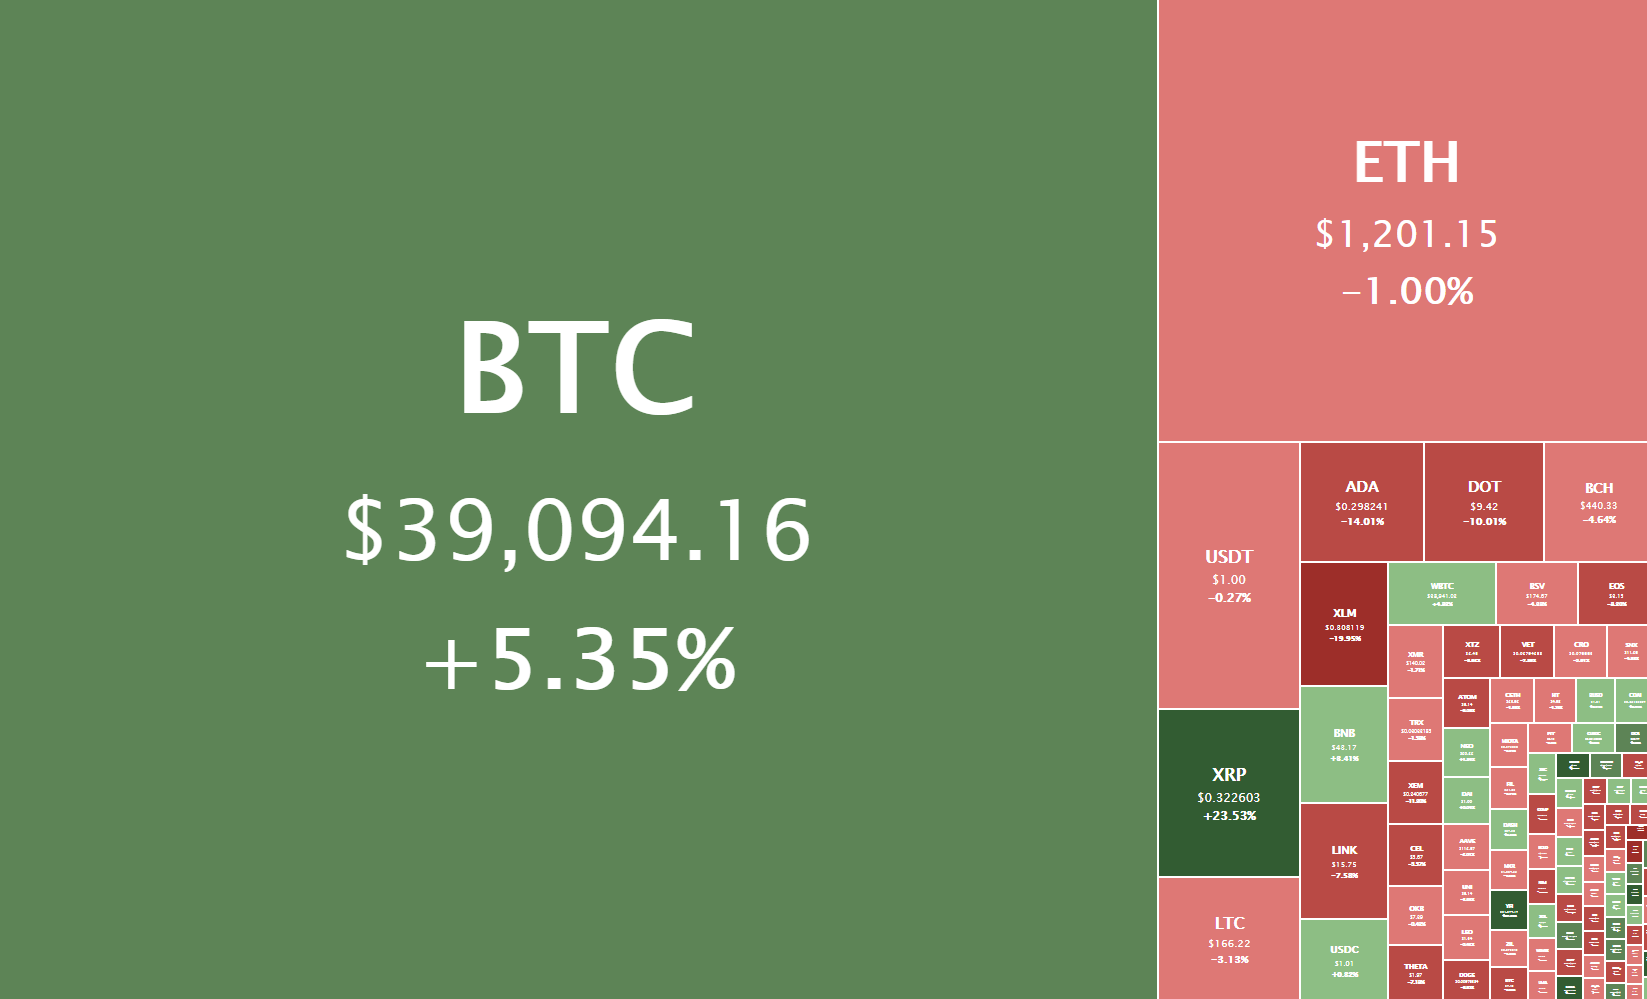
Daily Crypto Sector Heat Map
COVER Protocol gained 2124.46% in the past 24 hours, making it the most prominent daily crypto gainer by far. It is followed by KIMCHI.finance’s 1159.97% and TAI’s 265.52% gain. On the other hand, Stand Share lost 74.11%, making it the most prominent daily loser. It is followed by the Receive Access Ecosystem’s loss of 61.71% and CY Finance’s loss of 56.34%.
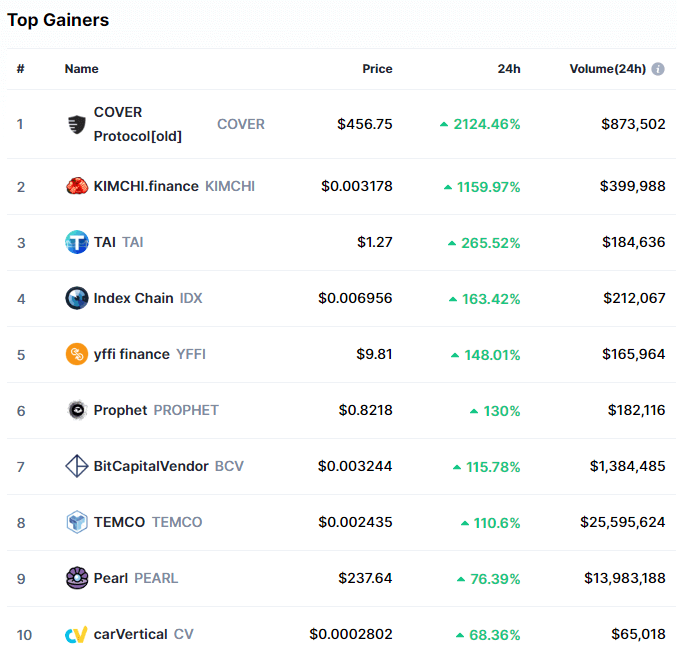
Top 10 24-hour Performers (Click to enlarge)
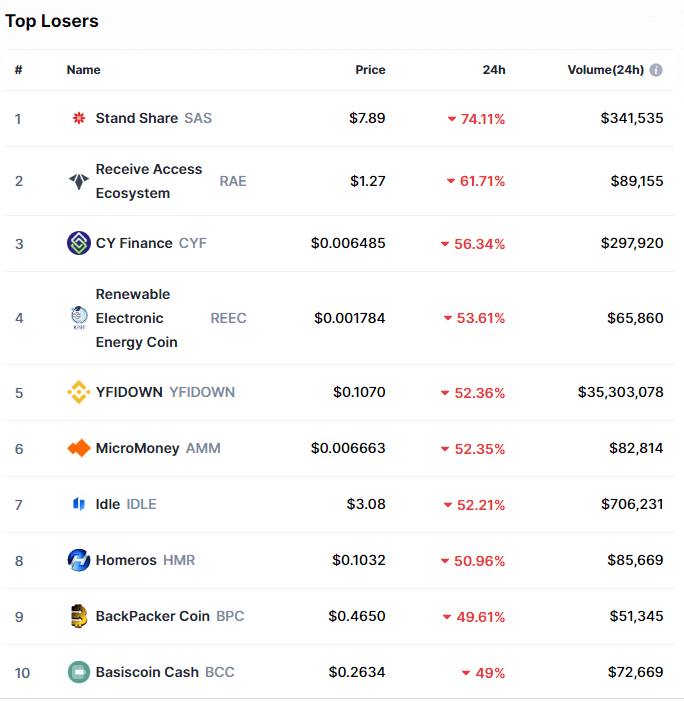
Bottom 10 24-hour Performers (Click to enlarge)
Bitcoin’s market dominance has moved up half a percent since our last report, with its value currently being 69.8%. This value represents a 0.5% difference to the upside than the value it had when we last reported.
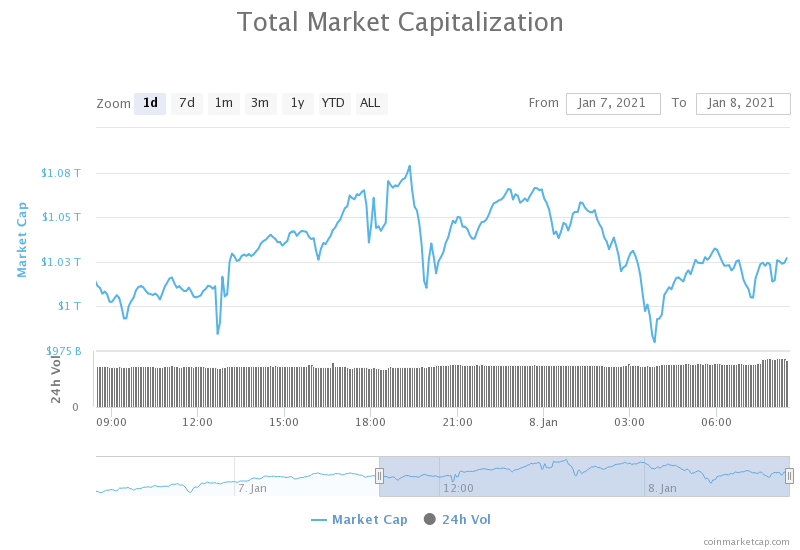
Daily Crypto Market Cap Chart
The cryptocurrency sector capitalization has decreased slightly since we last reported, with its current value being $1,03 trillion. This represents a $2 billion decrease when compared to our previous report.
_______________________________________________________________________
What happened in the past 24 hours?
_______________________________________________________________________
- ETH’s market capitalization hits a new all-time high (The Block)
- Bitcoin shoots past $40,000 for the first time ever (The Block)
- Coinbase hits number 30 in the top 100 free apps on Apple’s mobile store (The Block)
- Ripple CEO Brad Garlinghouse responds to questions surrounding the SEC lawsuit (The Block)
- On-chain volumes for stablecoins reached a new monthly high in December (The Block)
- FinCEN Flooded With 65,000 Comments Opposing Impractical Crypto Bill (Cryptobriefing)
- PayPal, Coinbase, and Winklevoss Twins Invest in Crypto Tax Startup (Cryptobriefing)
- Big gains for Stellar (XLM) as multiple banking settlement rumors proliferate (Cryptoslate)
- ‘Bitcoin Rich List’ Rebounds to Hit All-Time High (Coindesk)
- Google searches for ‘Ethereum’ hit all-time high (Cointelegraph)
_______________________________________________________________________
Technical analysis
_______________________________________________________________________
Bitcoin
Bitcoin has continued moving up, with its price surpassing the $38,000 and $39,000 mark without much problem. The largest cryptocurrency by market cap reached as high as $40,402.5 level before crashing down as bulls could not sustain the price. The price instantly dipped to $36,388 but quickly recovered to the $39,000 area, where it is consolidating at the moment.
Bitcoin has positioned itself for another push towards the upside as it quickly found support in the 50-hour moving average, proving that it doesn’t even need to dip to the horizontal support levels to stabilize itself.
BTC/USD 4-hour chart
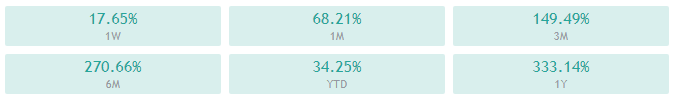
Bitcoin’s technicals on the 4-hour, daily, and weekly chart show a tilt towards the buy-side with no signs of neutrality or bearishness. On the other hand, its monthly overview shows slight bearishness in the oscillator sector opposing the overall bullishness.
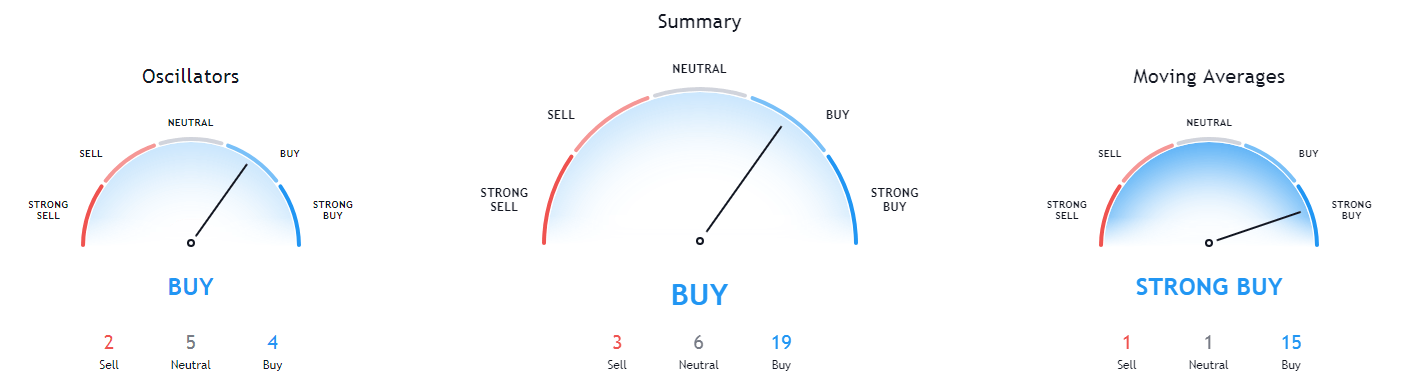
BTC/USD 1-day Technicals
Technical factors (4-hour Chart):
- Price is above both its 50-period EMA and its 21-period EMA
- Price is between its middle and top Bollinger band
- RSI is in the overbought territory (70.36)
- Volume is above average
Key levels to the upside: Key levels to the downside:
1: $40,402 1: $38,140
2: $43,000 2: $36,740
3: $46,500 3: $35,610
Ethereum
Ethereum followed Bitcoin to the upside, pushing its price above its previous resistance levels and up to as high as $1292. Just like Bitcoin, Ethereum instantly dipped to $1,140 but quickly recovered. However, this is where the high correlation with Bitcoin ends, as Ethereum didn’t recover its recent highs but rather lost quite a bit of its value.
While it has recovered since the price dip, Ethereum is now right below the $1,211 resistance level. The cryptocurrency has a high possibility of passing it even if Bitcoin remains stagnant. Still, any moves that would contest the next resistance level would have to be backed by the largest cryptocurrency by market cap.
ETH/USD 1-hour Chart
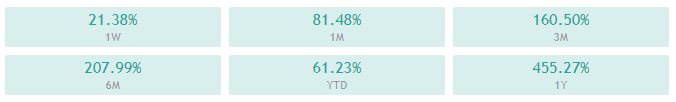
Ethereum’s technicals on the daily time-frame show an overall bullish tilt with no hints of neutrality. On the other hand, the monthly, weekly, and 4-hour time-frames show some signs of neutrality or even bearishness.
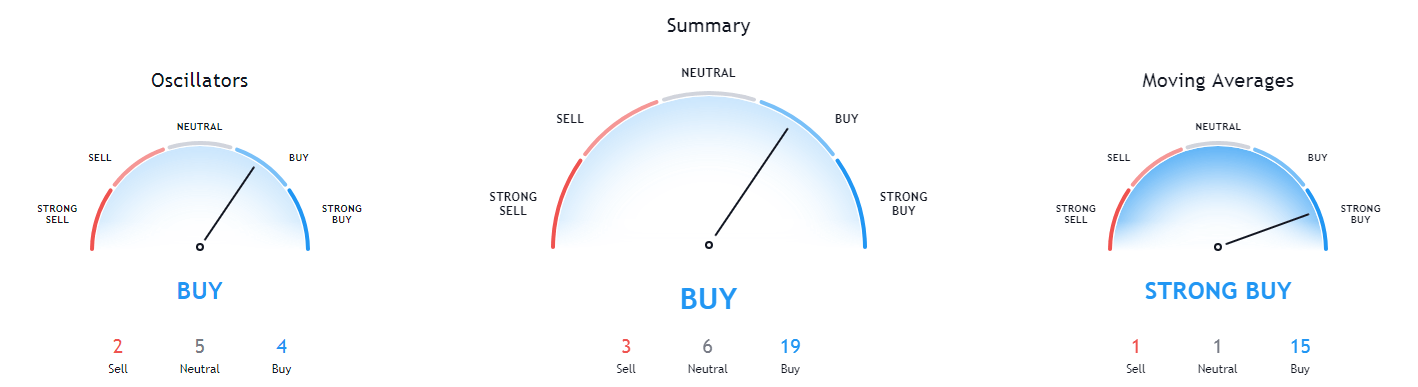
ETH/USD 1-day Technicals
Technical Factors (4-hour Chart):
- Price is above its 50-period and at its 21-period EMA
- Price is near its middle Bollinger band
- RSI has left the overbought area (63.27)
- Volume is significantly above-average
Key levels to the upside: Key levels to the downside:
1: $1,292 1: $1,211
2: $1,420 2: $1,180
3: $1,500 3: $1,092
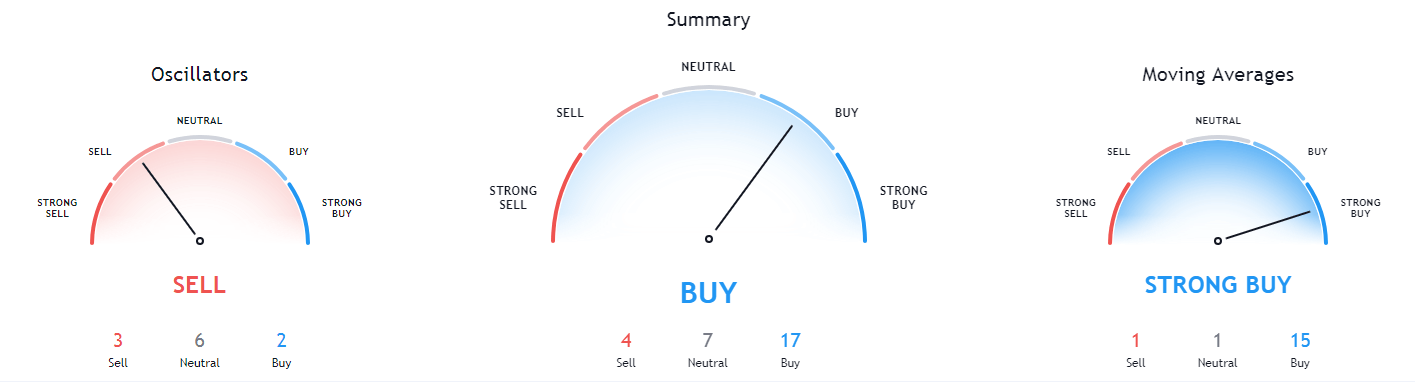
Litecoin
Litecoin followed the market as well, pushing its price further up and breaking its previous resistance level of $174.5. However, while LTC did manage to break this level and post a new high of $181.25 for a moment, the price was unsustainable, resulting in a classic price drop, followed by a failed attempt of recovering (the moment when LTC hit the $174.5 level after dropping below it) acting as a confirmation of a price drop, and then a full-on retracement towards the downside.
Litecoin has bounced off of the $152.25 level beautifully and is now attempting to pass the 50-hour and 21-hour moving averages and continue its move up.
LTC/USD 1-hour Chart
Litecoin’s technicals on the 4-hour, daily, and weekly time-frame are bullish but show some neutrality or even bearishness. On the other hand, its monthly overview is completely bullish.
LTC/USD 1-day Technicals
Technical factors (4-hour Chart):
- Its price is currently above its 50-period EMA and at its 21-period EMA
- Price at its middle Bollinger band
- RSI is neutral (54.95)
- Volume is on above-average levels
Key levels to the upside: Key levels to the downside:
1: $174.5 1: $163.7
2: $181.3 2: $155.25
3: $195.5 3: $149.3
Related posts
 Daily Crypto Review, Jan 15 – Bitcoin Retraces After Hitting $40k; Ethereum Contests $1.2k
 Daily Crypto Review, Jan 20 – ETH Reaches a New All-Time High; Crypto Sector in the Red
 Daily Crypto Review, Jan 21 – BTC in a Triangle Formation – What do the Analysts Say?
 Daily Crypto Review, Jan 22 – Bitcoin Briefly Drops Below $30K; Market Sees Blood on the Streets