The crypto sector was split between slight gainers and slight losers, but overall lost some value as the market cap dropped below $1 trillion. Bitcoin is currently trading for $34,644, representing a decrease of 2.39% compared to yesterday’s value. Meanwhile, Ethereum’s price has decreased by 4.12% on the day, while LTC lost 5.41% of its value.

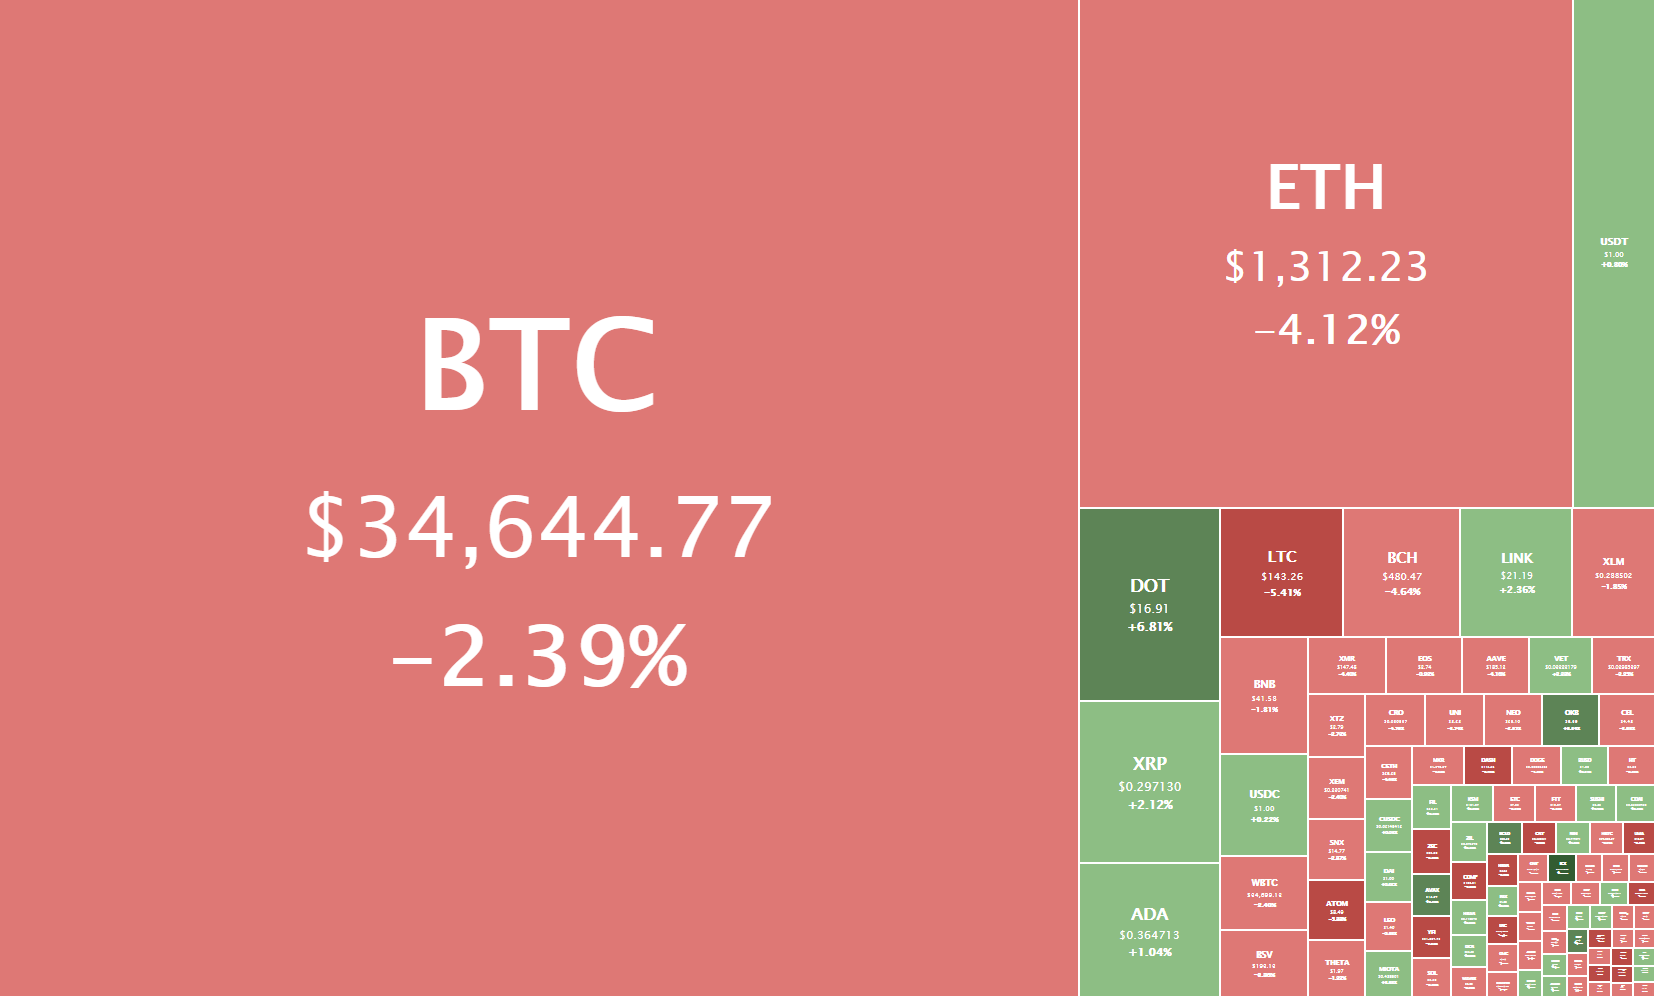
Daily Crypto Sector Heat Map
Cocos-BCX gained 107983.76% in the past 24 hours, making it the most prominent daily crypto gainer by far. It is followed by HAPY Coin’s 383.49% and Vox.Finance’s 371.42% gain. On the other hand, PegsShares lost 59.35%, making it the most prominent daily loser. It is followed by KIMCHI.finance’s loss of 44.21% and EveryCoin’s loss of 34.88%.
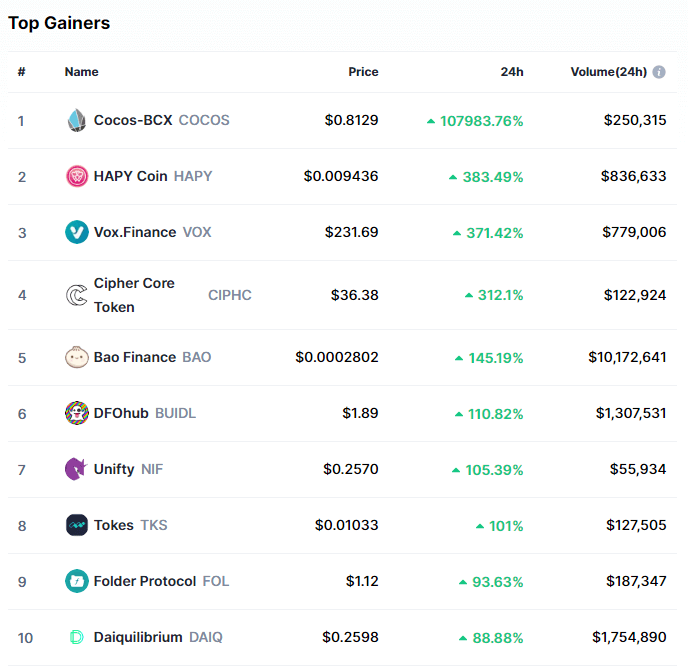
Top 10 24-hour Performers (Click to enlarge)
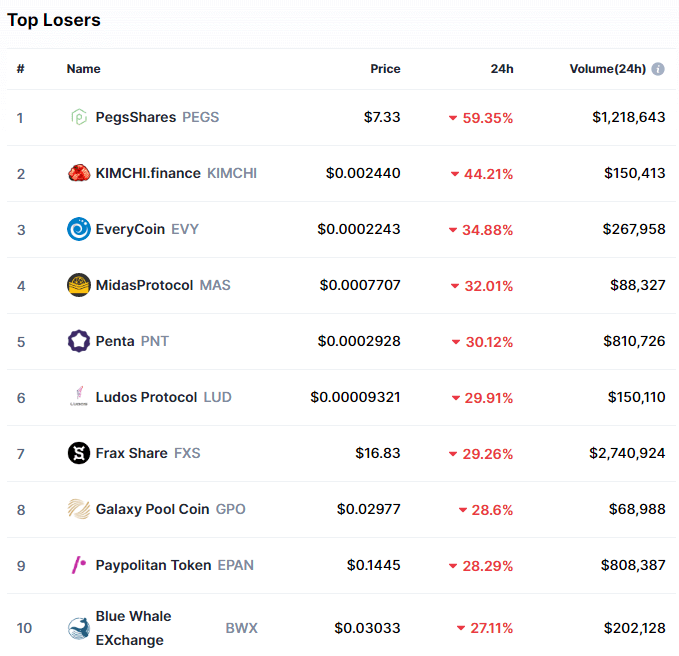
Bottom 10 24-hour Performers (Click to enlarge)
Bitcoin’s market dominance has moved down slightly since our last report as altcoins started to outperform, with its value currently being 64.8%. This value represents a 0.1% difference to the downside when compared to the previously reported value.
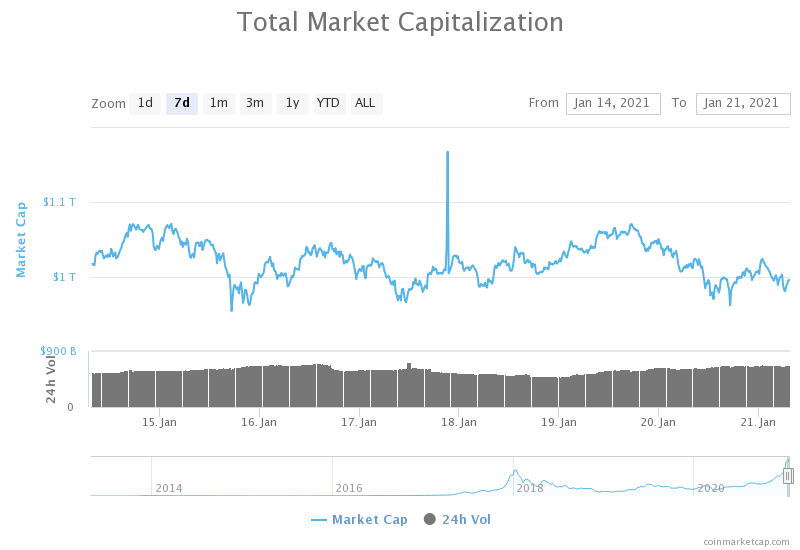
Weekly Crypto Market Cap Chart
The cryptocurrency sector’s market capitalization has decreased slightly since we last reported, with its current value being $955.53 billion. This represents a $69 billion decrease when compared to our previous report.
_______________________________________________________________________
What happened in the past 24 hours?
_______________________________________________________________________
- BlackRock filings suggest asset management giant could buy bitcoin futures via certain funds (The Block)
- Lawyer for Bitfinex, Tether says firms are almost finished producing documents sought by NYAG (The Block)
- Market insiders struggle to explain Asia’s typically bearish crypto trading sessions (The Block)
- Silvergate results show Q4 momentum as bank starts year with a $200 million follow-on public offering (The Block)
- Crypto.com Predicts Bitcoin & Ethereum Trends for 2021 (Cryptobriefing)
- Fundstrat Strategist Posts $10,500 Ethereum Target for 2021 (Cryptobriefing)
- Ripple looks to new administration to take U.S. blockchain industry forward (Cryptoslate)
- There are now over 600k unique Ethereum NFTs on the market (Cryptoslate)
- The Relationship Between US Government Debt and Bitcoin, Explained (Coindesk)
- 83% of cryptocurrencies that peaked in 2018 are still down by 90% (Cointelegraph)
_______________________________________________________________________
Technical analysis
_______________________________________________________________________
Bitcoin
Bitcoin’s daily time-frame shows that the cryptocurrency is still contained within the triangle formation, which will be a major determinant in BTC’s future price movement. If we zoom in to the hourly time-frame, we can see that BTC moved down, broke the $34,627, and pushed towards the downside, but got instantly stopped by the triangle formation’s bottom line.
While Bitcoin’s short-term overview seems slightly bearish, many analysts call for a push towards $60,000 before any major pullback. However, judging by the current trading session, BTC has a higher chance of breaking the triangle formation to the downside at the moment.
BTC/USD 1-hour chart
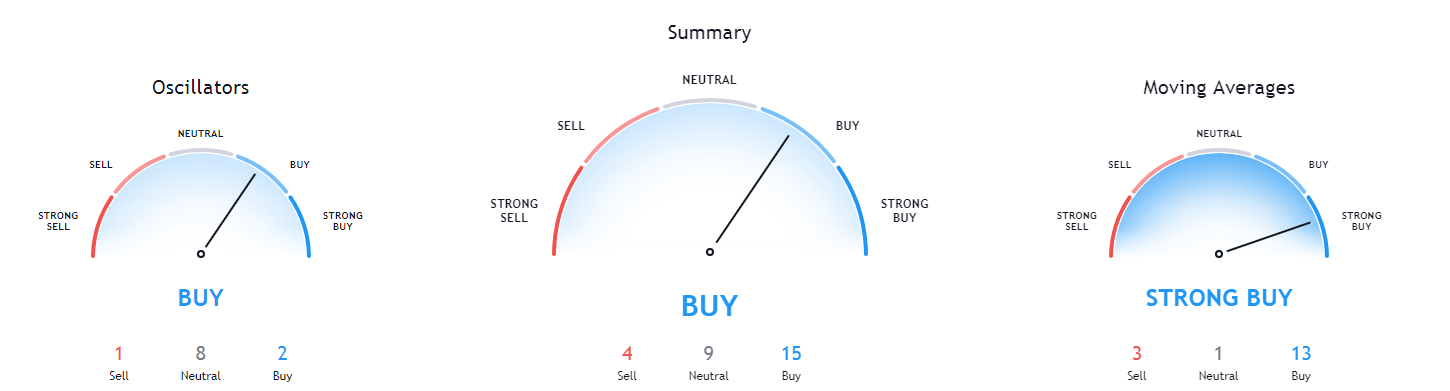
Bitcoin’s weekly and monthly time-frames are completely bullish and show no signs of bearishness. On the other hand, its daily time-frame oscillators point to “sell” while the rest of the overview is still bullish, and its 4-hour time-frame is completely bearish.

BTC/USD 1-day Technicals
Technical factors (1-hour Chart):
- Price is slightly below both its 50-period EMA and its 21-period EMA
- Price is slightly below its middle Bollinger band
- RSI is neutral (44.21)
- Volume is average (low)
Key levels to the upside: Key levels to the downside:
1: $37,445 1: $34,627
2: $40,000 2: $32,350
3: $42,000 3: $27,960
Ethereum
The second-largest cryptocurrency by market cap went into retracement mode after creating a new all-time high of $1,440 two days ago. Ether’s price moved in a straight descending pattern at first but then bounced back up and tried to retest the $1,350 level. As time passed, it was more and more evident that ETH failed to break $1,350 to the upside and that its price is now contained between $1,350 to the upside and $1,211 to the downside.
Ether’s current upside is heavily guarded, not only by the $1,350 level but also by the 21-hour and 50-hour EMAs.
ETH/USD 1-hour Chart
Ethereum’s technicals on all time-frames are bullish, but only its daily time-frame shows no signs of neutrality or bearishness. The rest of the time-frames (4-hour, weekly, and monthly) have their oscillators pointing to a neutral or bearish stance.
ETH/USD 1-day Technicals
Technical Factors (1-hour Chart):
- Price is slightly below its 50-period and its 21-period EMA
- Price is slightly below its middle Bollinger band
- RSI is neutral (44.30)
- Volume is average
Key levels to the upside: Key levels to the downside:
1: $1,350 1: $1,211
2: $1,420 2: $1,183.85
3: $1,440 3: $1047.5
Litecoin
Litecoin spent the day trading on very low volume compared to the previous days, with its price contesting the $142.1 level twice. At the moment, LTC traders can face two scenarios, one being LTC falling below $142.1 level and pushing towards $128.4, and the second one being that LTC acts on the double bottom it created and pushes up to regain some of the lost value.
LTC/USD 1-hour Chart
Litecoin’s technicals are pretty split, with its 4-hour and daily indicators showing almost complete bearish sentiment and its weekly and monthly overviews showing complete bullishness.
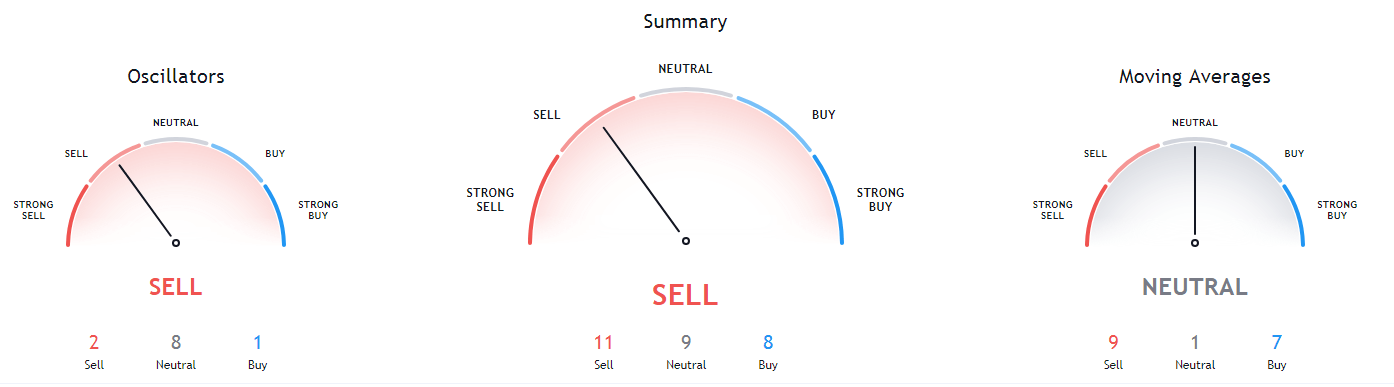
LTC/USD 1-day Technicals
Technical factors (1-hour Chart):
- Its price is slightly below both its 50-period EMA and its 21-period EMA
- Price between its middle and bottom Bollinger band
- RSI is neutral (41.78)
- Volume is below average
Key levels to the upside: Key levels to the downside:
1: $161.5 1: $142.1
2: $181.3 2: $128.42
3: $186.3 3: $114.75
Related posts
 Daily Crypto Review, Jan 12 – XLM Back in the top10 Cryptos by Market Cap; Crypto Sector in the Green
 Daily Crypto Review, Jan 14 – Bitcoin Records Double-Digit Gains as it Passes $38K; Crypto Market in the Green
 Daily Crypto Review, Jan 25 – Ethereum Reaches a new All-Time High: What’s Next?
 Daily Crypto Review, Jan 27 – Bitcoin (BTC), Ethereum (ETH), Litecoin (LTC) Price Analysis