
The crypto sector ended up mostly in the green as altcoins pushed up (while Bitcoin remained mostly stable). Several cryptocurrencies reached new all-time highs, including Ethereum and Aave. Bitcoin is currently trading for $33,335, representing an increase of 1/59% compared to yesterday’s value. Meanwhile, Ethereum’s price has increased by 7.93% on the day, while LTC gained 2.12% of its value.


Daily Crypto Sector Heat Map
Foglory Coin gained 389.19% in the past 24 hours, making it the most prominent daily crypto gainer by far. It is followed by Unifty’s 187.19% and MileVerse’s 160.11% gain. On the other hand, EveryCoin lost 76.45%, making it the most prominent daily loser. It is followed by Zloadr’s loss of 62.48% and FUTUREXCRYPTO’s loss of 54.1%.
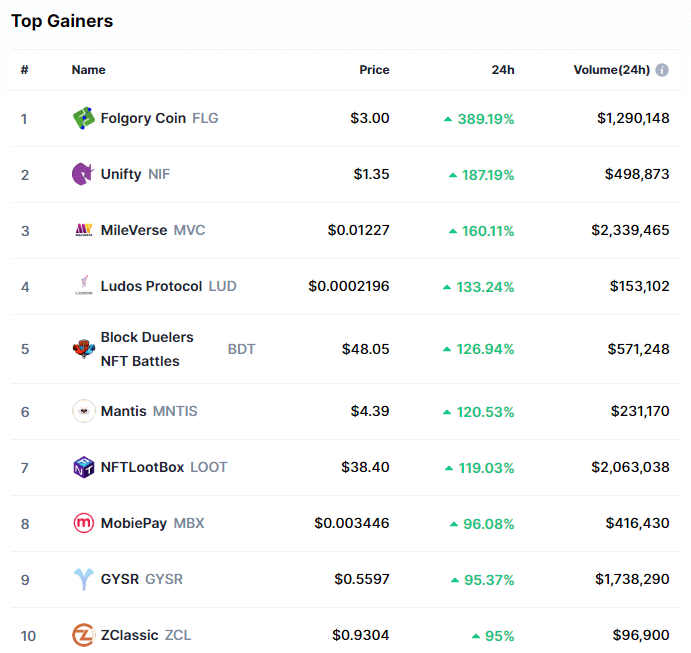
Top 10 24-hour Performers (Click to enlarge)
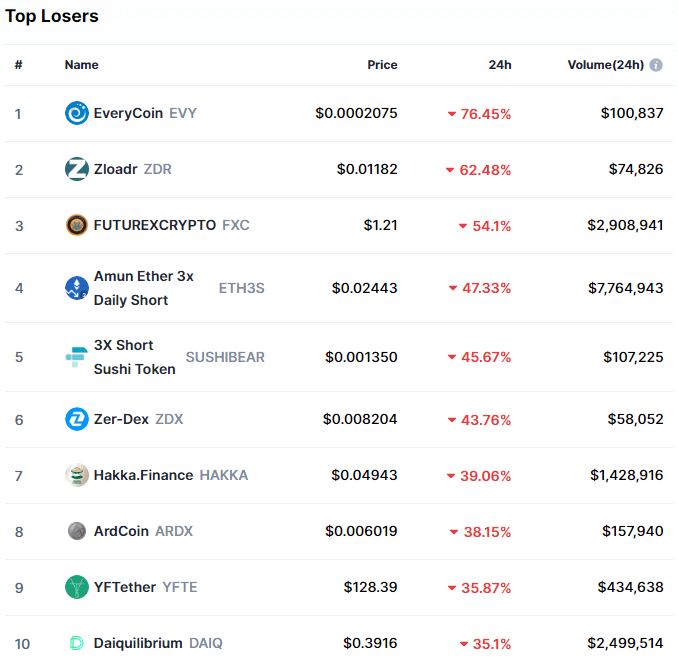
Bottom 10 24-hour Performers (Click to enlarge)
Bitcoin’s market dominance dropped further from when we last reported, with its value currently being 62.7%. This represents a 2.1% decrease from our previous report.
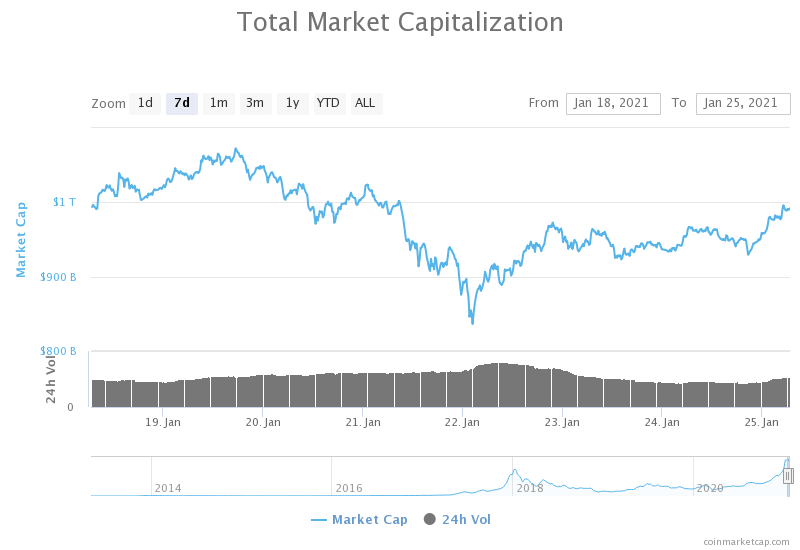
Weekly Crypto Market Cap Chart
The cryptocurrency sector’s market capitalization has increased greatly since we last reported, with its current value being $991.66 14.56 billion. This represents a $77.10 billion increase when compared to our previous report.
_______________________________________________________________________
What happened in the past 24 hours?
_______________________________________________________________________
- Coinbase to offer secondary market for private shares ahead of public stock listing (The Block)
- Registration statement filed for new bitcoin exchange-traded fund from Valkyrie (The Block)
- Bitstamp implements tighter KYC measures for crypto withdrawals in the Netherlands (The Block)
- Tezos Price Recovers Following DAO Announcement (Cryptobriefing)
- wNews: All Eyes on Biden, Bitcoin, and the Future of Index Funds (Cryptobriefing)
- There’s a massive 32,000 Ethereum sell wall at $1,250 stopping bullish price action (Cryptoslate)
- Grayscale adds $120 million worth of Bitcoin to its coffers amid continued institutional interest (Cryptoslate)
- MicroStrategy CEO claims to have “thousands” of executives interested in Bitcoin (Cryptoslate)
- Chainlink’s LINK Cryptocurrency Hits New Record Price High (Coindesk)
- Cryptocurrency makes World Economic Forum’s Davos Agenda (Cointelegraph)
_______________________________________________________________________
Technical analysis
_______________________________________________________________________
Bitcoin
Bitcoin has spent the weekend with its price slowly descending towards the $30,000 mark until a new surge of buyers changed the price direction. BTC has bounced from the $30,900 level and pushed up past the $33,250 level. Its price is currently consolidating in the $33,400 zone.
Bitcoin’s upside is guarded not only by the $34,627 level but the recent high of $33,865. Traders will have to be careful when taking long positions on BTC and will have to devote most of the time checking the order flow to properly gauge the resistance levels.
BTC/USD 1-hour chart
Bitcoin’s 4-hour and weekly overviews are bullish and show some signs of neutrality or bearishness, while its monthly overview is completely bullish. On the other hand, its daily time-frame is pretty neutral.
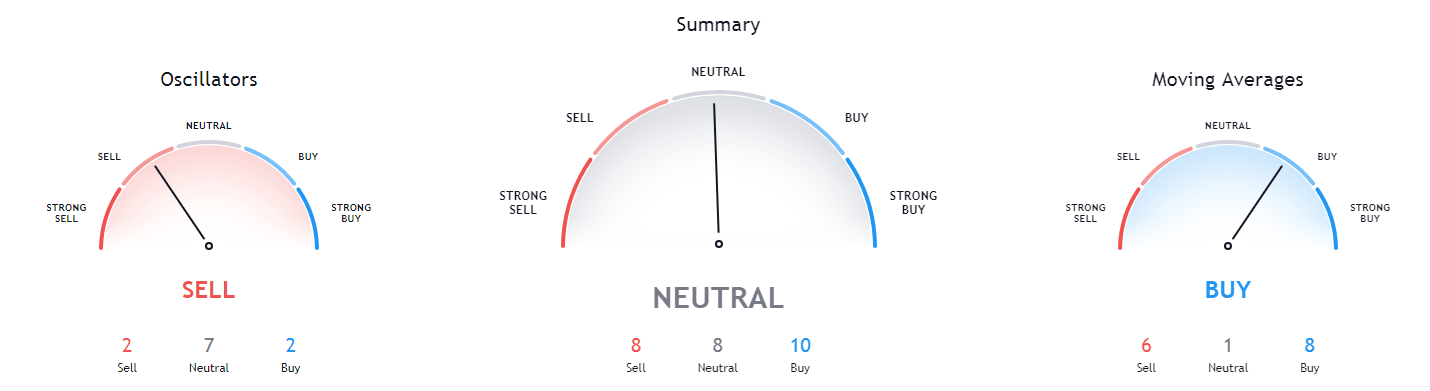
BTC/USD 1-day Technicals
Technical factors (1-hour Chart):
- Price is slightly above its 50-period EMA and its 21-period EMA
- Price is close to its top Bollinger band
- RSI is near the overbought area (64.47)
- Volume is slightly below average
Key levels to the upside: Key levels to the downside:
1: $34,627 1: $32,350
2: $37,445 2: $30,072
3: $38,000 3: $27,960
Ethereum

The second-largest cryptocurrency by market cap “decoupled” from Bitcoin and pushed up, surging to its all-time highs and briefly creating a new one at $1,477.3. Ether is currently fighting to stay above $140 and enter the price discovery mode yet again.
Ethereum has quite a lot of support levels right beneath its current price, most notably the $1,440, $1,420, and $1,350 levels. Its upside levels past the all-time high will, however, have to be determined by drawing Fib retracement levels.
ETH/USD 1-hour Chart
Ethereum’s technicals on the 4-hour, daily, and weekly time-frames are bullish and show some signs of neutrality or bearishness, while its monthly overview is completely bullish.

ETH/USD 1-day Technicals
Technical Factors (1-hour Chart):
- Price is above both its 50-period and its 21-period EMA
- Price near its top Bollinger band
- RSI is very close to being overbought (68.27)
- Volume is above average
Key levels to the upside: Key levels to the downside:
1: $1,440 1: $1,420
2: $1,477.3 2: $1,350
3: $1,500 3: $1,211
Litecoin
Litecoin’s weekend went without much price fluctuation, with LTC moving between $133 and $143.5. However, LTC bulls managed to push past the $142.1 level and bring its price to $145, where it is now consolidating. Litecoin’s volume also surged during the price increase.
Litecoin traders will have to pay attention to several factors, including LTC technicals, Bitcoin price movement as well as Ethereum price movement.
LTC/USD 1-hour Chart
Litecoin’s overviews on all time-frames are bullish, with its 4-hour, daily, and weekly time-frames having some signs of neutrality, while its monthly overview is completely bullish.

LTC/USD 1-day Technicals
Technical factors (1-hour Chart):
- Its price is slightly above its 50-period EMA and its 21-period EMA
- Price slightly above its middle Bollinger band
- RSI is neutral (63.36)
- Volume is slightly above average
Key levels to the upside: Key levels to the downside:
1: $161.5 1: $142.1
2: $181.3 2: $128.42
3: $186.3 3: $120
Related posts
 Daily Crypto Review, Jan 12 – XLM Back in the top10 Cryptos by Market Cap; Crypto Sector in the Green
 Daily Crypto Review, Jan 14 – Bitcoin Records Double-Digit Gains as it Passes $38K; Crypto Market in the Green
 Daily Crypto Review, Jan 19 – Ether Breaks $1,300; Litecoin Skyrockets
 Daily Crypto Review, Jan 27 – Bitcoin (BTC), Ethereum (ETH), Litecoin (LTC) Price Analysis