
The crypto sector was mostly stable in the past 24 hours, as most cryptocurrencies were trying to find their top or retraced slightly. Bitcoin is currently trading for $37,766, representing a decrease of 0.42% compared to yesterday’s value. Meanwhile, Ethereum’s price has increased by 5.98% on the day, while LTC gained 0.33% of its value.

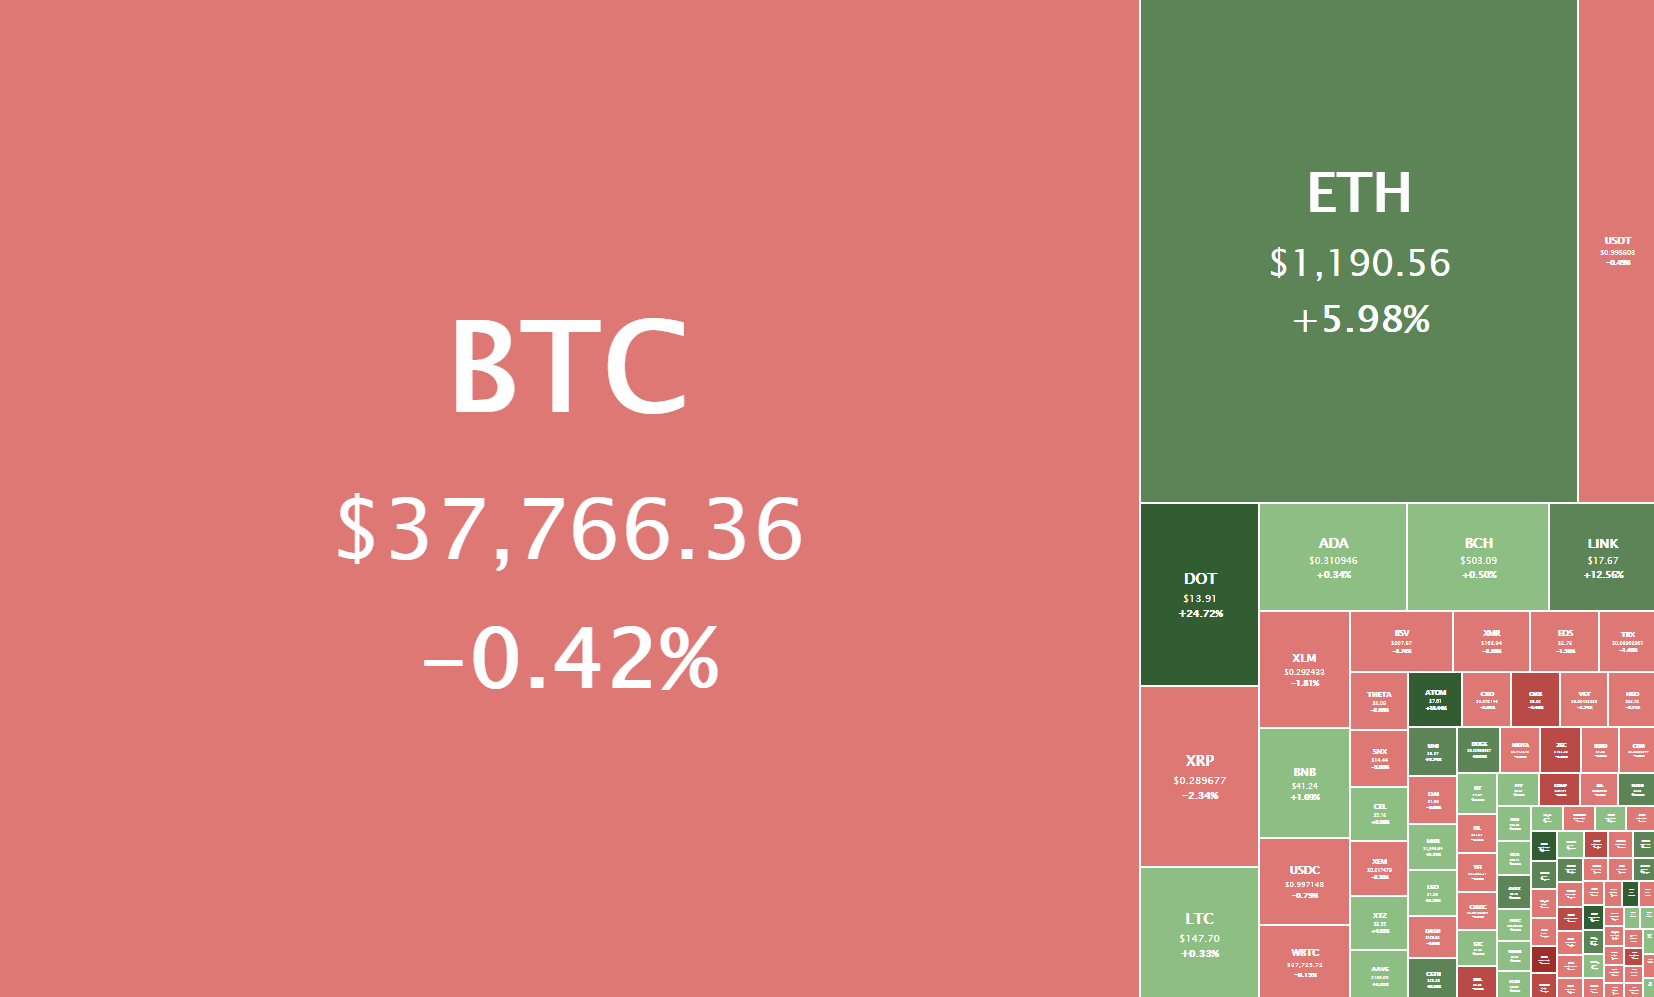
Daily Crypto Sector Heat Map
FastSwap gained 244.13% in the past 24 hours, making it the most prominent daily crypto gainer by far. It is followed by HedgeTrade’s 225.26% and Capital.Finance’s 145.48% gain. On the other hand, Zugacoin lost 87.51%, making it the most prominent daily loser. It is followed by Roti Bank Coin’s loss of 77.52% and BitiPro Exchange Token’s loss of 74.35%.
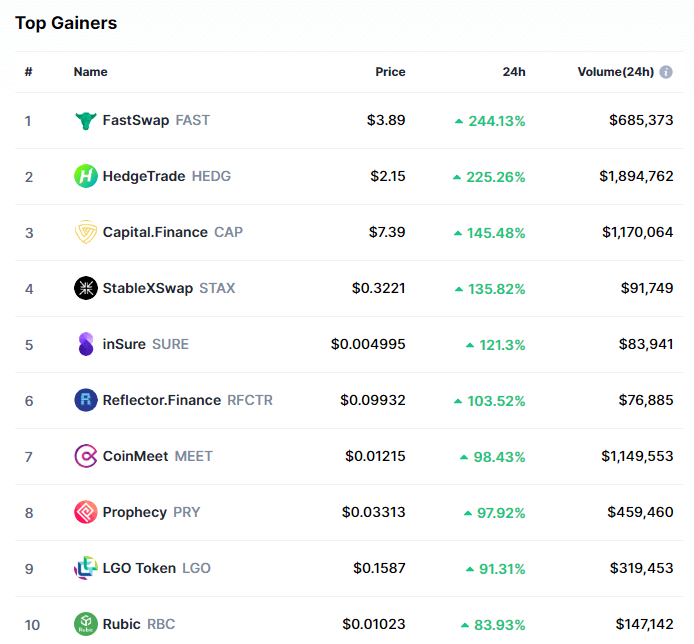
Top 10 24-hour Performers (Click to enlarge)
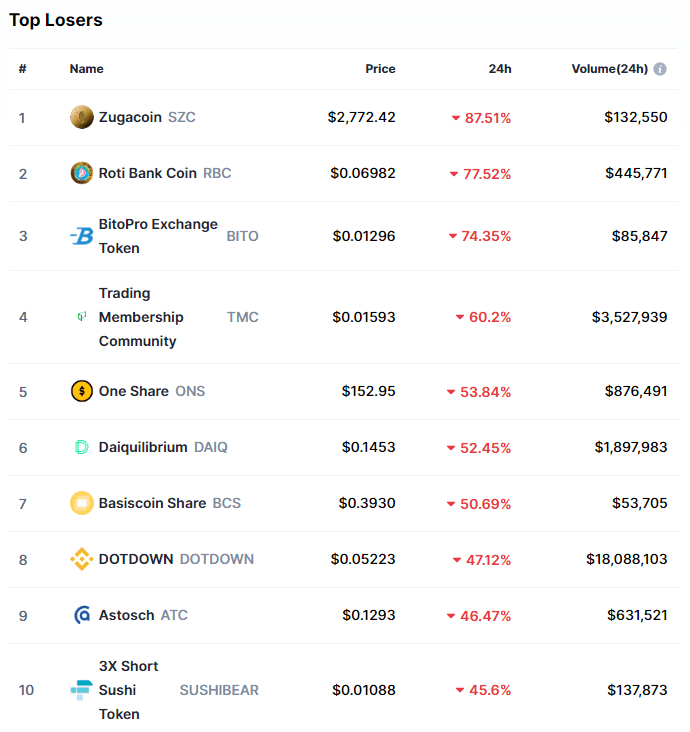
Bottom 10 24-hour Performers (Click to enlarge)
Bitcoin’s market dominance has moved down slightly since our last report, with its value currently being 68.4%. This value represents a 0.6% difference to the downside when compared to the previously reported value.
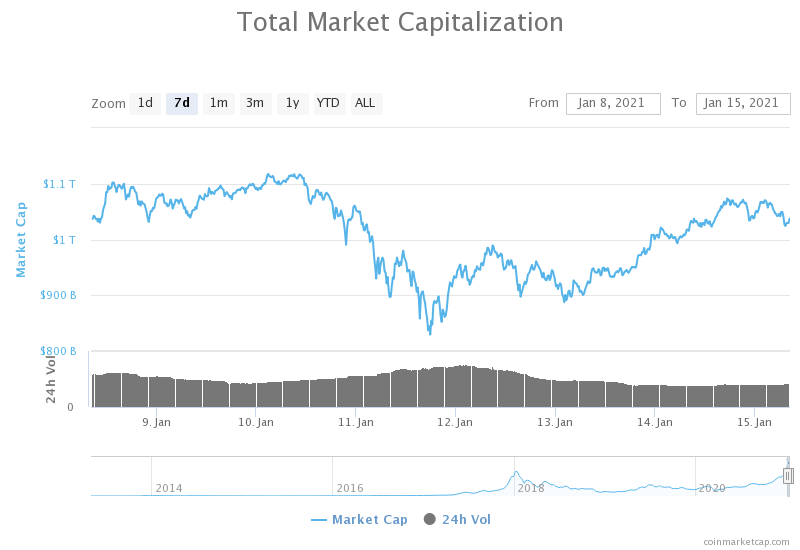
Weekly Crypto Market Cap Chart
The cryptocurrency sector’s market capitalization has made negligible gains since we last reported, with its current value being $1.037 trillion. This represents a $5 billion increase when compared to our previous report.
_______________________________________________________________________
What happened in the past 24 hours?
_______________________________________________________________________
- FinCEN reopens comment period for proposed crypto wallet rule (The Block)
- Jerome Powell says the Fed’s work on stablecoin risks is a ‘very high priority’ (The Block)
- Deltec, the bank for stablecoin issuer Tether, bought ‘large position’ in Bitcoin for clients (The Block)
- Uniswap Now Has More Than $3 Billion in Liquidity (Cryptobriefing)
- Multi-Trillion Dollar Stimulus Hopes Boost Bitcoin, Stocks (Cryptobriefing)
- Staking Polkadot (DOT) just became easier for institutions (Cryptoslate)
- Bitcoin Bounces as Options Market Sees 20% Chance of $50K at Month’s End (Coindesk)
- Bitcoin Core’s Latest Release Is Out: Here’s What’s in It (Coindesk)
- DOT flip: Polkadot overtakes XRP to become the fourth largest cryptocurrency (Cointelegraph)
- Block.one’s Bitcoin reserves are now worth double the entire EOS market cap (Cointelegraph)
_______________________________________________________________________
Technical analysis
_______________________________________________________________________
Bitcoin
Bitcoin has ended its uptrend by hitting a high of $40,112 yesterday, prompting a slight pullback. The pullback was, just like the price increase, happening on low volume and had the same intensity as well. The only differentiating factor was its direction. The move to the downside ended with BTC’s price hitting the 50-hour moving average and pushing up.
Bitcoin has a couple of strong resistance lines to the upside, one being the immediate 21-hour EMA, and then the $40,000 and ultimately $42,000 levels. On the other hand, its support is guarded by the 50-hour EMA and the $36,640 level.
BTC/USD 1-hour chart
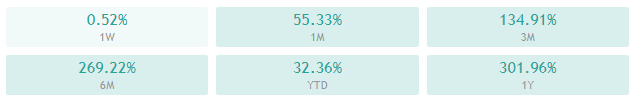
Bitcoin’s technicals on the daily and monthly time-frame are overall bullish but have oscillators pointing to the sell-side. On the other hand, its 4-hour and weekly overviews are completely bullish.
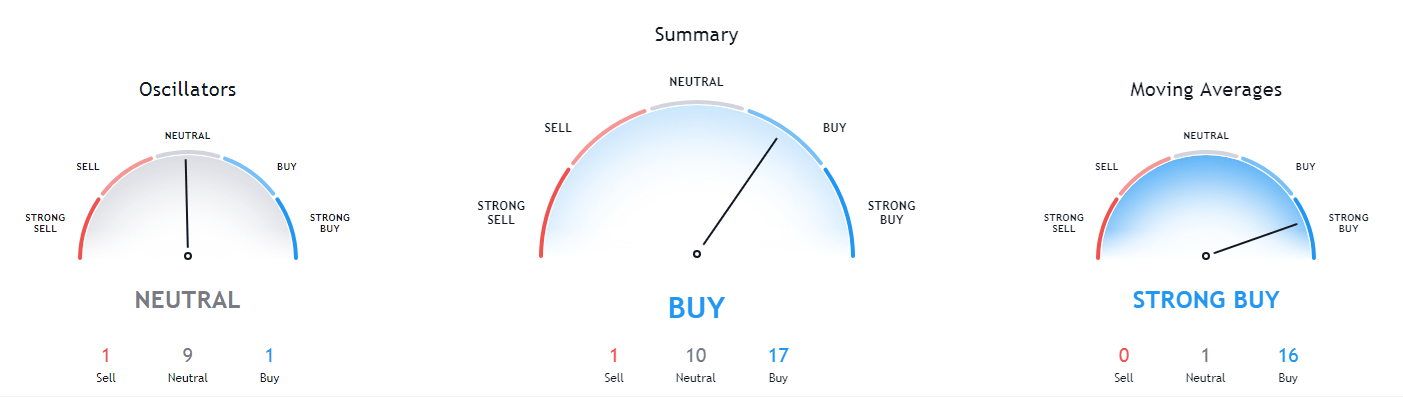
BTC/USD 1-day Technicals
Technical factors (1-hour Chart):
- Price is between its 50-period EMA and its 21-period EMA
- Price is slightly below its middle Bollinger band
- RSI is neutral (50.19)
- Volume is average
Key levels to the upside: Key levels to the downside:
1: $40,000 1: $36,640
2: $42,000 2: $33,200
3: $43,600 3: $30,640
Ethereum
Ethereum’s push to the upside has, just like with Bitcoin, seemingly ended. However, its pullback hasn’t started at all, as its price kept fluctuating between the recently $1,183.85 support level and the recent high. Trading in such a narrow range is not sustainable, and ETH will break either to the upside or downside very soon.
ETH traders can finally catch a nice trade as the cryptocurrency has (at least a bit) moved in a different manner than Bitcoin. Ether’s upside is guarded by the heavy resistance zone slightly below $1,300 as well as the $1,350 level. Its downside has smaller support levels, some of them being $1,211, $1,183.85, as well as the 21-hour and 50-hour EMAs.
ETH/USD 1-hour Chart
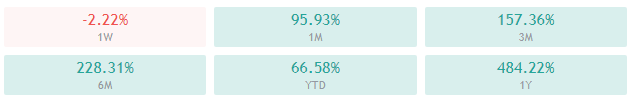
Ethereum’s technicals on the 4-hour and daily time-frames are overall bullish but have oscillators pointing to the sell-side. On the other hand, its weekly and monthly overviews are completely bullish.
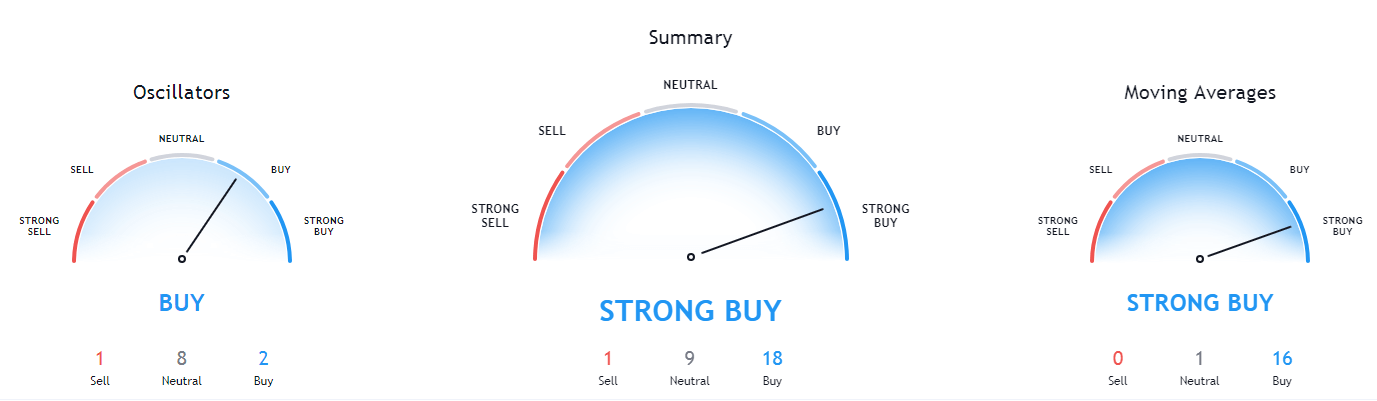
ETH/USD 1-day Technicals
Technical Factors (1-hour Chart):
- Price is above its 50-period and at its 21-period EMA
- Price is near its top Bollinger band
- RSI is neutral (61.37)
- Volume is slightly below average
Key levels to the upside: Key levels to the downside:
1: $1,255 1: $1,211
2: $1,350 2: $1,183.85
3: $1,419 3: $1,060.5
Litecoin
Litecoin continued trading within its range, bound by $142.1 to the downside and $161.5 to the upside. Its price is now also between the 21-hour and the 50-hour EMAs, which have proven to be strong support and resistance levels, especially when paired with low trading volume.
Litecoin is currently mirroring the direction of Bitcoin’s moves, but with much less intensity. This makes it a very unattractive trading pair at the moment.
LTC/USD 1-hour Chart
Litecoin’s technicals on all time-frames are completely bullish and without any signs of neutrality.
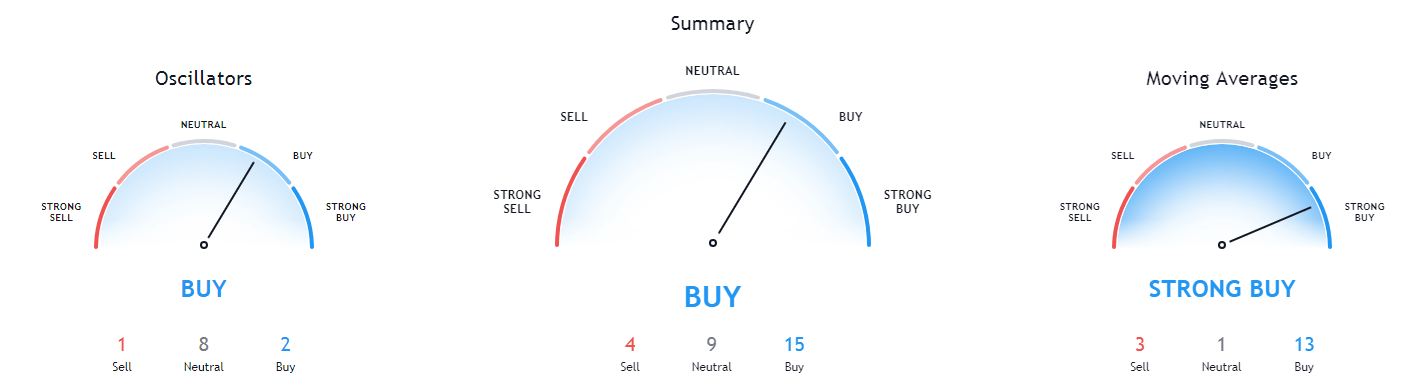
LTC/USD 1-day Technicals
Technical factors (1-hour Chart):
- Its price is slightly above its 50-period EMA and at its 21-period EMA
- Price at its middle Bollinger band
- RSI is neutral (53.10)
- Volume is descending
Key levels to the upside: Key levels to the downside:
1: $161.5 1: $142.1
2: $181.3 2: $128.42
3: $186.3 3: $114.75
Related posts
 Daily Crypto Review, Jan 14 – Bitcoin Records Double-Digit Gains as it Passes $38K; Crypto Market in the Green
 Daily Crypto Review, Jan 18 – Bitcoin Drops During the Weekend, ETH Remains Strong
 Daily Crypto Review, Jan 19 – Ether Breaks $1,300; Litecoin Skyrockets
 Daily Crypto Review, Jan 25 – Ethereum Reaches a new All-Time High: What’s Next?