
The crypto sector spent the weekend in a mostly descending fashion, with BTC continuing its short-term downtrend. Bitcoin is currently trading for $35,258, representing an increase of 0.14% compared to yesterday’s value. Meanwhile, Ethereum’s price has decreased by 0.39% on the day, while LTC lost 0.46% of its value.

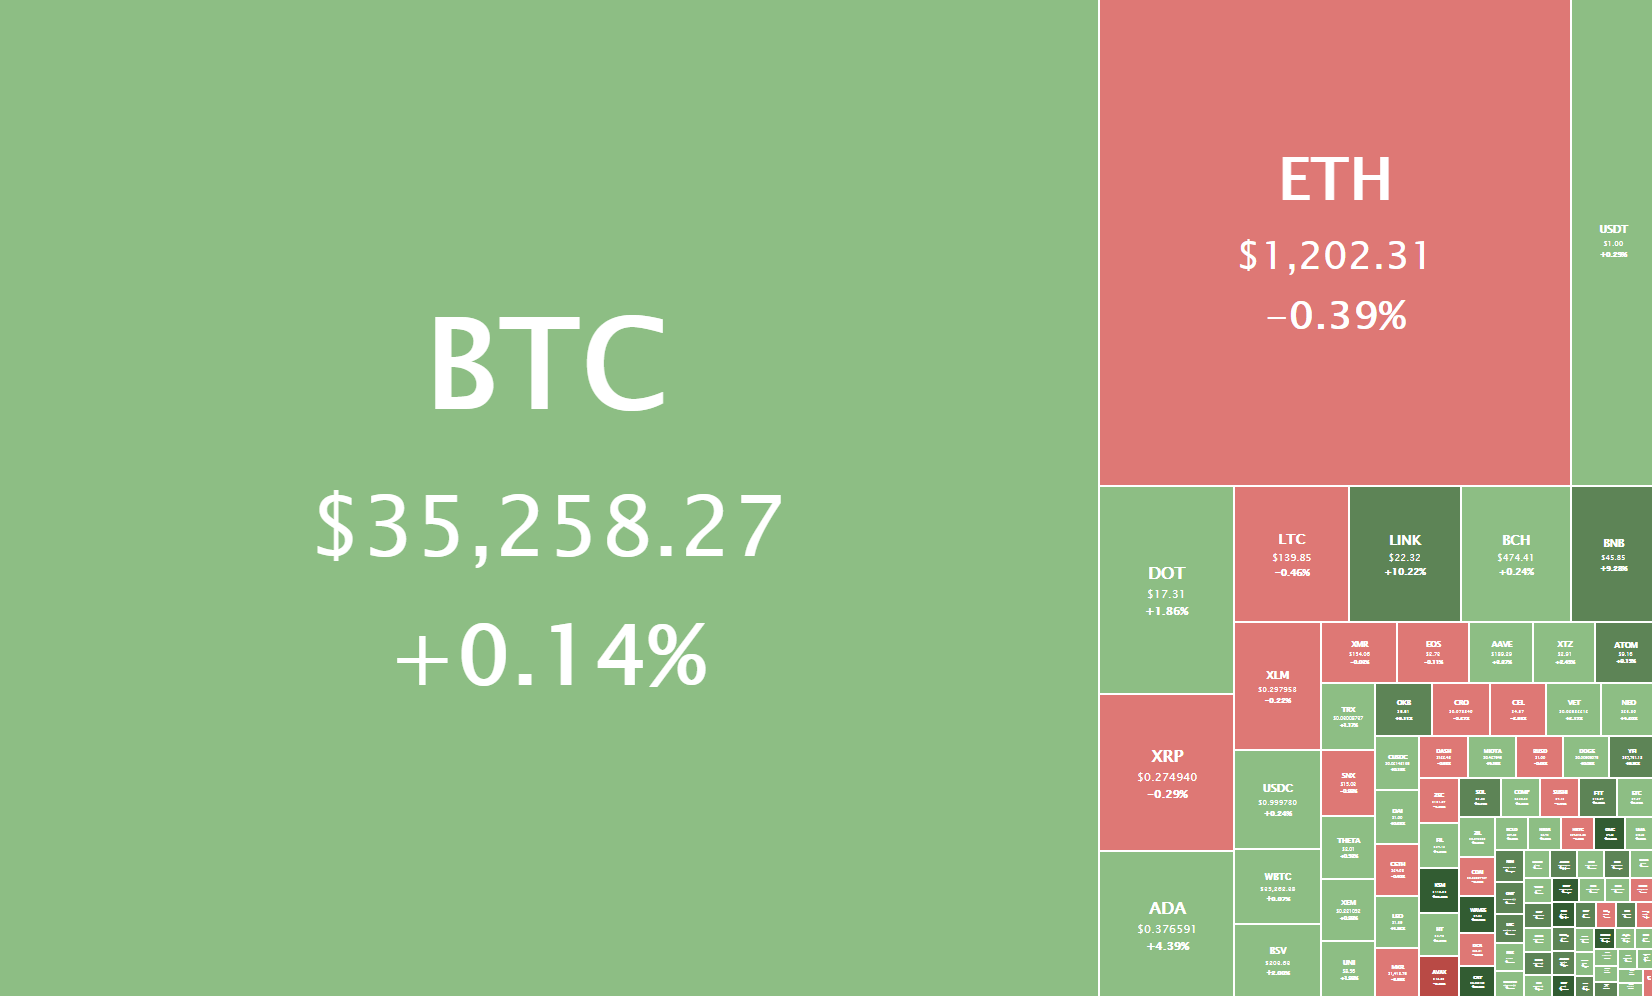
Daily Crypto Sector Heat Map
Astosch gained 285.95% in the past 24 hours, making it the most prominent daily crypto gainer by far. It is followed by ALL BEST ICO’s 273.67% and Yeld Finance’s 264.65% gain. On the other hand, Bestay lost 87%, making it the most prominent daily loser. It is followed by Zugacoin’s loss of 85.51% and VKF Platform’s loss of 77.77%.
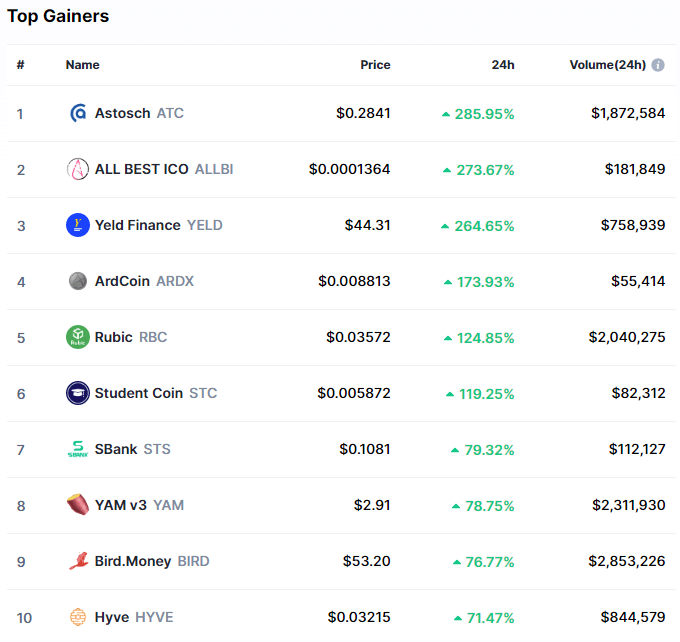
Top 10 24-hour Performers (Click to enlarge)
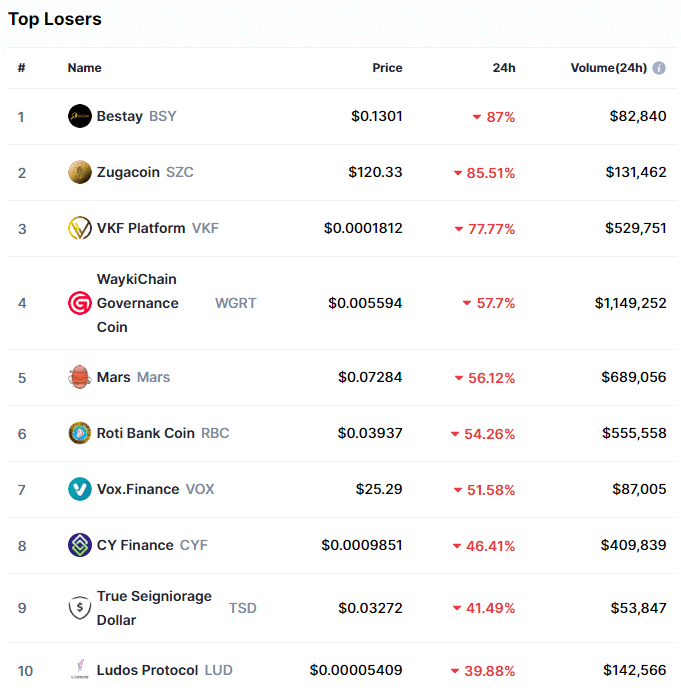
Bottom 10 24-hour Performers (Click to enlarge)
Bitcoin’s market dominance has moved down since our last report, with its value currently being 66.1%. This value represents a 2.3% difference to the downside when compared to the previously reported value.
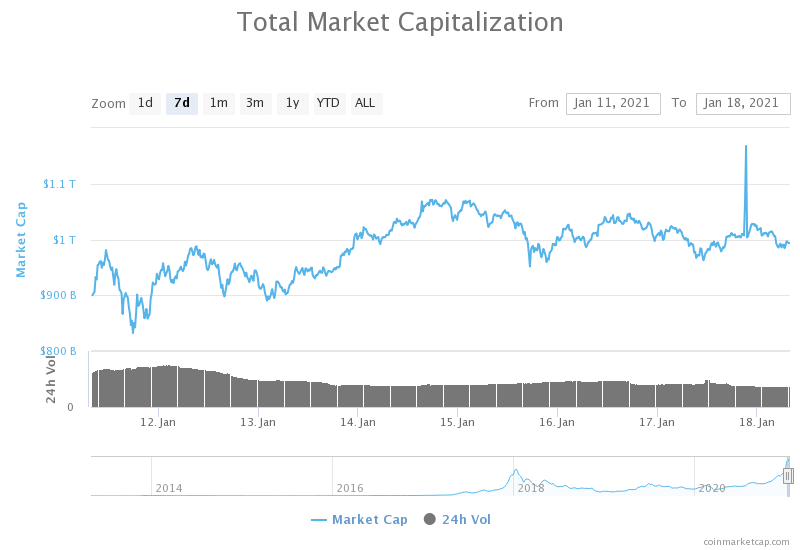
Weekly Crypto Market Cap Chart
The cryptocurrency sector’s market capitalization has dropped below the $1 trillion mark since we last reported, with its current value being $993.33 billion. This represents a $43.67 billion decrease when compared to our previous report.
_______________________________________________________________________
What happened in the past 24 hours?
_______________________________________________________________________
- January’s decentralized exchange volumes are on track to reach record highs (The Block)
- NYPD details its use of cryptocurrency transaction analysis in policy document (The Block)
- Kraken to halt XRP trading for US users starting Jan 29 (The Block)
- Optimism “Soft” Launches Layer-2 Solution Amid Ethereum Bull Run (Cryptobriefing)
- Cardano Enters New Bullish Cycle Towards All-Time Highs (Cryptobriefing)
- Ethereum Takes Center Stage as ETH Edges to New Highs (Cryptobriefing)
- Why Tether’s Reserves Probably Don’t Contain Bitcoin (Cryptobriefing)
- Analyst on why Bitcoin and crypto may be in the midst of a “mini bear market” (Cryptoslate)
- China’s Blockchain-Based Service Network to Integrate Central Bank Digital Currency (Coindesk)
- Former Canadian prime minister names Bitcoin as possible reserve currency (Cointelegraph)
_______________________________________________________________________
Technical analysis
_______________________________________________________________________
Bitcoin
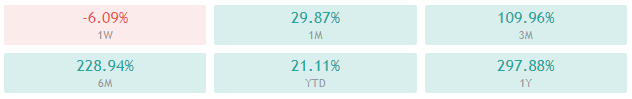
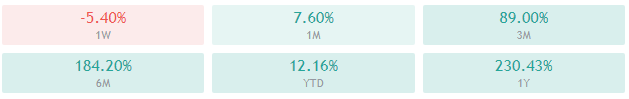
Bitcoin spent the weekend following the downtrend it started on Jan 14, with its price slowly declining from a high of $39,600 to a low of $33,833. During the downtrend, the price has contested and broken the $36,640 level to the downside and looks like it will contest the $33,200 level in the near future. BTC is currently trading at a little above $35,000, representing a weekly loss of 6.09% and a monthly gain of 29.87%.
Bitcoin’s price has responded well to the 21-day moving average and found very strong support there. Staying above this level will be crucial if BTC wants to turn to the upside.
BTC/USD 1-hour chart
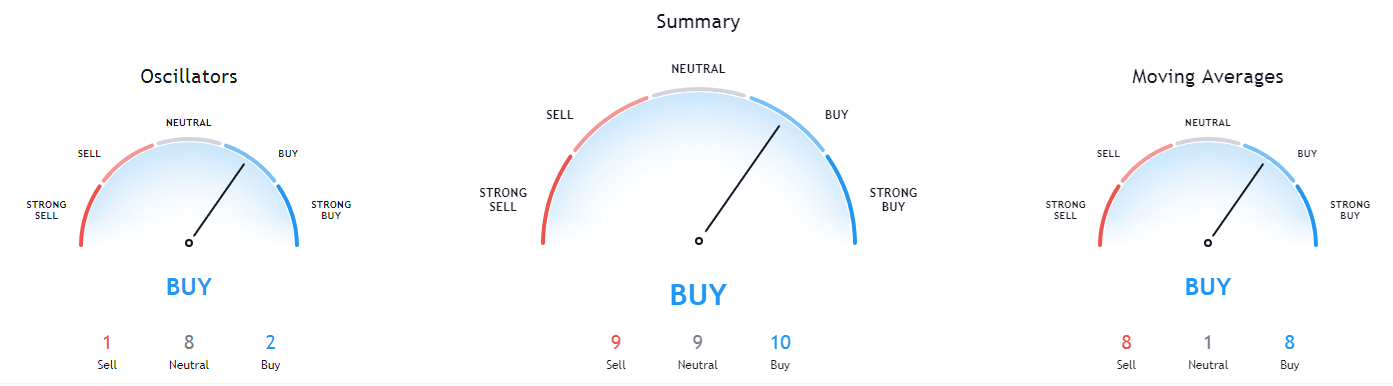
Bitcoin’s technicals on the daily, weekly, and monthly time-frame are completely bullish and show no neutral or bearish signs. On the other hand, its 4-hour overview is completely bearish.
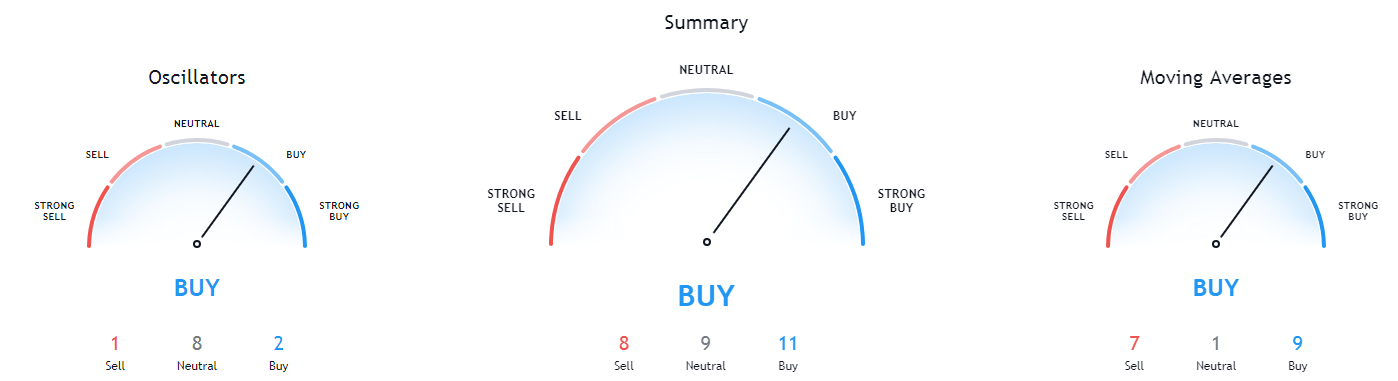
BTC/USD 1-day Technicals
Technical factors (1-hour Chart):
- Price is slightly below its 50-period EMA and its 21-period EMA
- Price is slightly below its middle Bollinger band
- RSI is neutral (43.00)
- Volume is descending
Key levels to the upside: Key levels to the downside:
1: $36,640 1: $33,200
2: $40,000 2: $30,640
3: $42,000 3: $27,960
Ethereum
Unlike Bitcoin, Ethereum’s weekend was not spent in a downfall. The second-largest cryptocurrency by market cap headed towards the $1,300 level but failed to break it, which prompted a weekend of sideways trading. While ETH did break the $1,211 level to the downside, the $1,183.85 level held up. Ether is currently trading in a very narrow range, bound by the aforementioned levels.
ETH’s short-term movement will greatly depend on two factors: Bitcoin’s volatility and Ether itself, breaking its immediate support or resistance levels.
ETH/USD 1-hour Chart
Ethereum’s technicals all time-frames are tilted towards the buy-side, with the 4-hour, daily, and weekly overviews fully pointing towards the buy-side. Its monthly overview, however, has oscillators pointing towards neutrality.
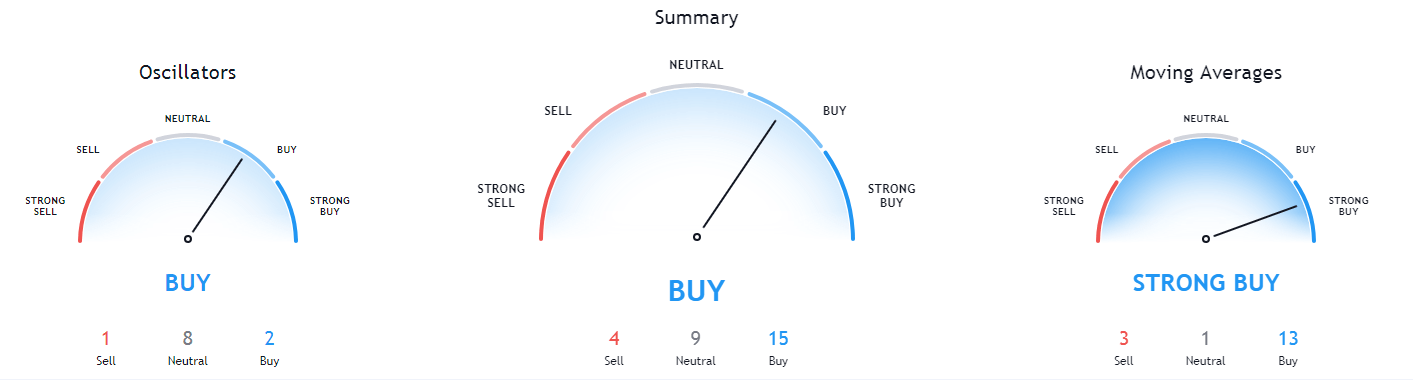
ETH/USD 1-day Technicals
Technical Factors (1-hour Chart):
- Price is slightly below its 50-period and its 21-period EMA
- Price is between its middle and bottom Bollinger band
- RSI is neutral (43.72)
- Volume is slightly below average
Key levels to the upside: Key levels to the downside:
1: $1,211 1: $1,183.85
2: $1,255 2: $1,060.5
3: $1,350 3: $1,047.5
Litecoin
Litecoin mirrored Bitcoin’s movements over the weekend, stepping into a downtrend that started on Jan 14, after Litecoin couldn’t push its price to $160. The price is currently fighting for the $142.1 level, which it has recently broken to the downside.
While Litecoin’s movements seem to mirror Bitcoin’s, its volume remains stable despite Bitcoin’s volume dropping. At the moment, LTC might be a better choice for people that want to be less affected by Bitcoin’s volatility.
LTC/USD 1-hour Chart
Litecoin’s technicals on the daily, weekly, and monthly time-frame are completely bullish and show no neutral or bearish signs (though they are slightly less bullish than Bitcoin’s overviews). On the other hand, its 4-hour overview is completely bearish.
LTC/USD 1-day Technicals
Technical factors (1-hour Chart):
- Its price is slightly below its 50-period EMA and its 21-period EMA
- Price close to its bottom Bollinger band
- RSI is neutral (42.47)
- Volume is average
Key levels to the upside: Key levels to the downside:
1: $142.1 1: $128.42
2: $161.5 2: $114.75
3: $181.3 3: $97.8
Related posts
 Daily Crypto Review, Jan 12 – XLM Back in the top10 Cryptos by Market Cap; Crypto Sector in the Green
 Daily Crypto Review, Jan 19 – Ether Breaks $1,300; Litecoin Skyrockets
 Daily Crypto Review, Jan 25 – Ethereum Reaches a new All-Time High: What’s Next?
 Daily Crypto Review, Jan 27 – Bitcoin (BTC), Ethereum (ETH), Litecoin (LTC) Price Analysis