Categories
Forex Assets

‘LTC/USD’ – Understanding The Crypto/Fiat Pair & Trading Costs Involved

Introduction

Cryptocurrencies are traded in pairs by pairing them with a fiat currency. Always, the cryptocurrency is written on the left and the fiat currency on the right. LTC/USD is a cryptocurrency, which is an abbreviation for the Litecoin versus the US Dollar. Like the Bitcoin and Ethereum, Litecoin is extensively traded in the exchange market.

Understanding LTC/USD

The market price of LTCUSD depicts the value of the US Dollar, which is equivalent to 1 Litecoin. It is quoted as 1 LTC per X USD. For example, if the value of LTCUSD is 41.69, then one Litecoin is worth 41.69 US Dollars.

LTC/USD specifications
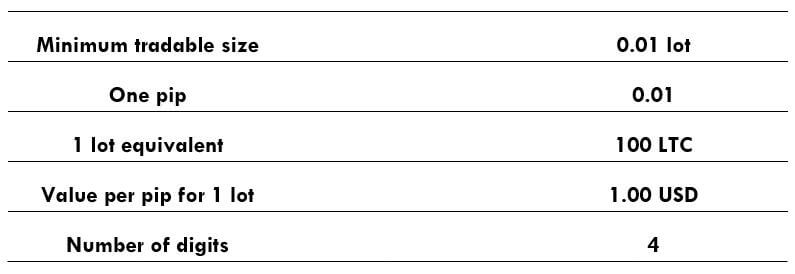
Spread

Spread is the difference between the bid and the ask price in the market, where bid price is given considered when shorting a pair and ask price when going long on a pair. The varies from broker to broker. It also differs based on the type of execution model used. Below are the spreads for the LTC/USD pair for both ECN & STP accounts.

  • Spread on ECN: 50 pips (0.5 USD)
  • Spread on STP: 60 pips (0.6 USD)

Fee

ECN brokers charge some commission on every position a trader opens and closes. The fee for ECN accounts is about $0.18 per standard lot, which corresponds to 18 pips.

Slippage

Slippage is the difference between the price asked by the user and the price given by the broker. There is this difference due to two reasons – High market volatility & broker’s execution speed.

Trading Range in LTC/USD

Below is the trading range table for the LTCUSD, which represents the minimum, average, and maximum volatilities of a pair for different timeframes using the ATR indicator. These values can prove to be helpful for assessing one’s profit/loss on a trade.

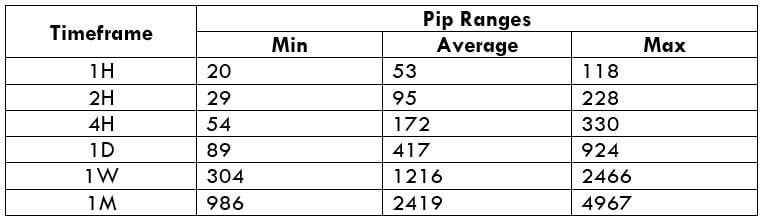
Procedure to assess Pip Ranges

  1. Add the ATR indicator to your chart
  2. Set the period to 1
  3. Add a 200-period SMA to this indicator
  4. Shrink the chart so you can assess a large time period
  5. Select your desired timeframe
  6. Measure the floor level and set this value as the min
  7. Measure the level of the 200-period SMA and set this as the average
  8. Measure the peak levels and set this as Max.

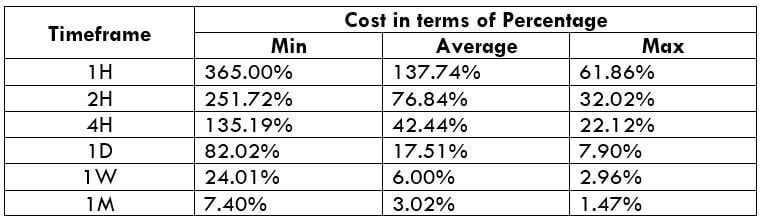
LTC/USD Cost as a Percent of the Trading Range

The cost as a percent of the trading range represents the variation of cost on a trade based on the change in the volatility of the market. And these variations are indicated as a percentage. Using the magnitude of the percentages, we shall determine the ideal times of the day to trade this coin.

ECN Model Account

Spread = 50 | Slippage = 5 |Trading fee = 18

Total cost = Slippage + Spread + Trading Fee = 18 + 50 + 5 = 73

STP Model Account

Spread = 60 | Slippage = 5 | Trading fee = 0Total cost = Slippage + Spread + Trading Fee = 5 + 60 + 0 = 65
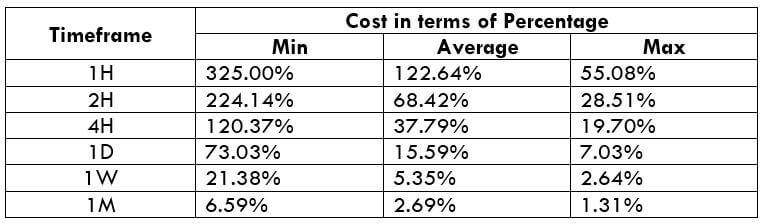
Trading the LTC/USD

LTCUSD is a crypto-fiat pair that has got enough volatility and liquidity to trade in the market. LTC is the fourth highest traded coin in terms of volume. However, it is not apt to trade anytime during the day. There are ways through which one reduces their costs for the same trade.

In the above table, if the percentages are high, then the costs are very high and vice versa. So, the cost is more for low volatile markets and less for high volatile markets. If you are a scalper or short-term trader, you may trade when the volatility is high as the profit margin is small, and you can avoid high costs.

Positional traders – these traders usually aim for large movements, and high costs become a little insignificant for their big pip movements. So, such traders may trade when the volatility is around the average values. Finally, it is not advisable to trade during low volatilities because the costs are high, and there is barely any movement in the market.

Slippage is a variable in total costs that can be eliminated by placing orders as ‘limit’ or ‘stop.’ We hope you found this analysis on LTCUSD useful. Stay tuned for more informative content. Cheers.

Categories
Crypto Market Analysis

Litecoin – Could It Reach The Median Line Again?


Litecoin (LTC)


Litecoin Market Cap: $5.67B

Circulating Supply: 56.96M LTC

Max Supply: 84M LTC

Volume (24h): $321.53M


Technical Analysis


Litecoin is trading in the red and seems too heavy to be stopped in the short term. Right now it is pressuring a dynamic support and could take it out as well. It should drop further if it will close below this downside obstacle.

The crypto market has started to drop aggressively and could resume the downward movement in the upcoming days, so, Litecoin is somehow expected to drop further as well.


Technically, it is expected to drop further after the breakdown from the major triangle pattern and below the 109 – 106 support zone. Right now it is pressuring the 150% Fibonacci line, so a breakdown will signal a drop at least until the upside 50% Fibonacci line of the descending pitchfork. The major downside target remains at the median line (ML) of the descending pitchfork.

We would have a great selling opportunity if the rate had retested the broken levels, but the rate moved down very quickly and I don’t know if we’ll have a retest.

It is somehow expected to drop after another failure to reach and retest the upper median line (UML) of the descending pitchfork. Litecoin also failed to stabilise above the sliding line (sl) of the descending pitchfork, so all the signs are bearish.


Conclusion


Technically, Litecoin market cap is expected to drop further even if we have a minor rebound and a retest. If you decide to sell it, then you should place a Stop Loss above the 129.870 former high and a Take Profit near the median line (ML), somewhere around $50.

Categories
Crypto Market Analysis

LTC/BTC – could we have another leg higher?

Litecoin (LTC)

Market Cap $8.23B

Circulating Supply: 56.34M LTC

Max Supply: 84M LTC

Volume (24h) $345.98M

LTC/USD = $144.06


The LTC/BTC moves sideways on the short term signaling an oversold.  It seems like that the corrective phase could be completed after the failure to approach and retest a dynamic support. It is trading at 0.016167 level, right above the 0.015669 crucial support level.

It remains to see if this will be an accumulation or a distribution movement. Price is narrowing, but I really hope that we’ll have a fresh trading opportunity soon.

The LTC/BTC could drop a little to test and retest the 0.015669 static support after another failure to close above the median line (ml) of the ascending pitchfork. Price has failed to drop towards the 50% Fibonacci line signaling that the bears could be exhausted. I’ve drawn a sliding parallel line (sl), the rate has failed to approach and retest this level so we could think of another bullish movement.

However, the rate could continue to move sideways in the upcoming days before will decide what will do next. We have a crucial support at the 0.015669, at the sliding line (sl) and at the 50% Fibonacci line of the ascending pitchfork. The rate could bounce back as long as it stays above these downside obstacles.

Personally, I believe that a valid breakout above the median line (ml) of the descending pitchfork it will signal another significant leg higher.

Conclusion

You can go long after a valid breakout above the median line (ml). You can place targets at the median line (ML) and higher at the upper median line (uml). Only a breakout above the second target will confirm an increase above the 0.025004 swing high.

A potential increase will be invalidated by a valid breakdown below the 50% line of the ascending pitchfork and below the sliding line (sl) of the descending pitchfork.

Categories
Crypto Market Analysis

Litcoin Further Increase Still Possible

Litcoin (LTC)

Market Cap. $8.53B

Circulating Supply: 56.22M LTC

Max Supply: 84M LTC

Volume (24H) $390.80M


Will Litecoin Recover April 2018

The Litcoin increased more than 19% in the last 7-day and is fighting hard to stay above some very important broken resistance levels. It is trading above the 150.000 psychological level, but unfortunately, it has shown a minor exhaustion in this weekend.

litecoin price analysis

Price has found temporary resistance right above the second warning line (wl2) of the former ascending pitchfork. Litcoin is almost to reach this line again after the retest of the 50% Fibonacci line of the descending pitchfork. Actually, the rate has made a false breakout above the warning line (wl2), so a retest will send the price down a little.

Maybe we’ll have a minor consolidation before the rate tries to break out from the descending pitchfork’s body. An accumulation above the 136.61 level could give us a great chance to go long on this major crypto again.

Personally, I believe that only a drop below the third warning line (wl3) and below the 50% Fibonacci line will invalidate a further increase in the upcoming period.

We’ll have a very important upside target somewhere at the first warning line (WL1) of the major descending pitchfork. Only a valid breakout above this line will confirm a further increase.

Will Litecoin recover - Litecoin chart analysis

Will Litecoin recover? You should stay away for now, because we don’t have a great buying opportunity. An accumulation above the 136.61 could bring more bullish energy. Technically, we have a very strong resistance line at the inside sliding line (SL) of the descending pitchfork.

The perspective will remain bullish as long as the rate stays above the 136.61 static support (resistance turned into support).