Categories
Beginners Forex Education Forex Assets

The Big Mac Index: How Much Does the USD Really Cost?

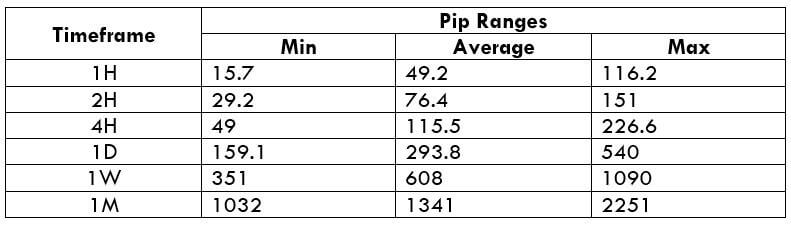
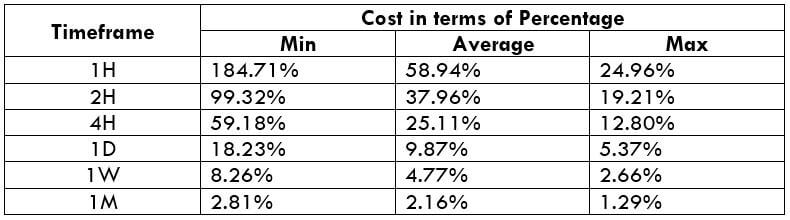
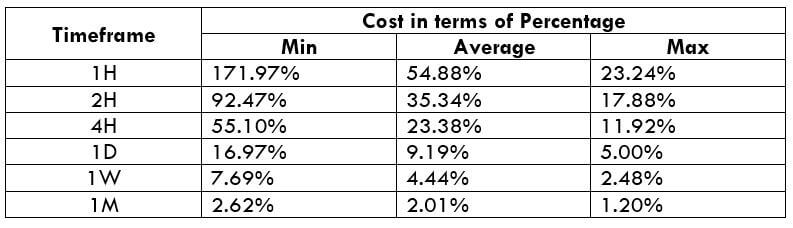
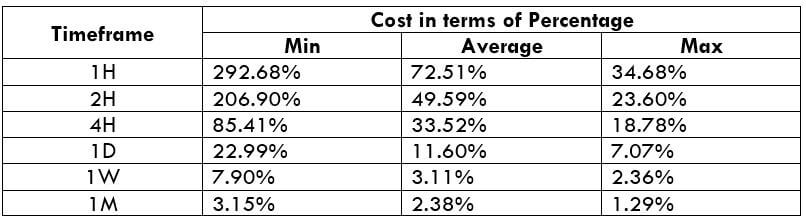
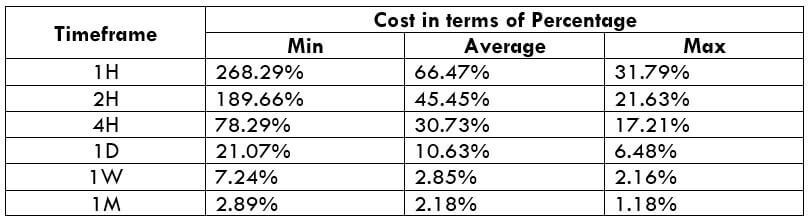
The real dollar rate can be defined using the cost of the Big Mac in a particular country. “Burgeconomics” is not an absolutely accurate indicator of monetary incoherence. But this index has been set as a global standard, is included in some economics manuals, and is the subject of academic research.

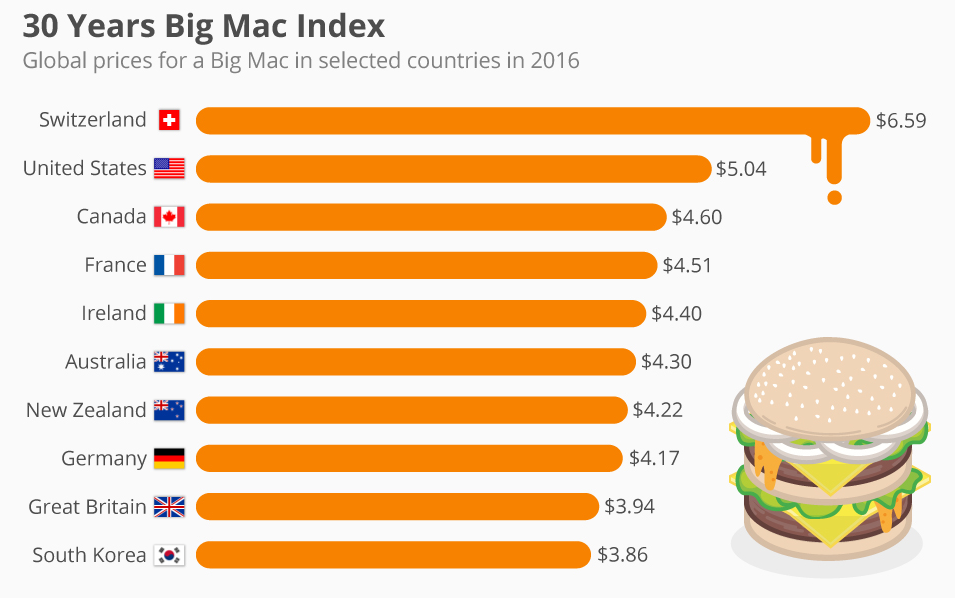
This Big Mac index was first considered by The Economist in 1967. So this burger cost 47 cents. After 20 years $1.60. Now a Big Mac costs $4.30. From here it follows that the dollar over 50 years has depreciated tenfold. Of course, this does not mean that in 50 years the dollar will depreciate another 10 times. Although, a certain trend is clearly visible.

How to know the real cost of the dollar using the Big Mac index?

The Big Mac index is normally used as means to informally determine purchasing power parity. With your help, I can calculate the real value of the dollar against the ruble. Why? McDonald’s uses a franchise with strict quality regulation of the production of the components of each of its dishes, for example, all the bread around the world are baked by the same company with the same ingredients and the same machinery, In addition, all the restaurants in the chain follow the same manufacturing process. In short, this means that the production of the Big Mac in each country uses a completely identical technology, respectively, the production/sales costs will be the same.

A Big Mac also contains enough food components (bread, cheese, meat, and vegetables) to be considered a universal prototype of the national economy. Well, Big Mac is the burger that’s on the menu at “McDonald’s” in every country. Well, don’t waste time looking for the prices of this burger on the official website, as the resources created and specialized will sweep away prices from around the world and be meticulously added to a table.

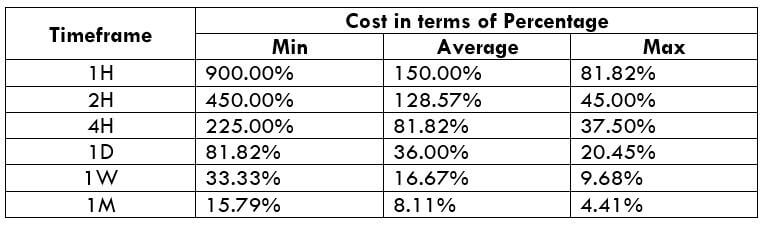
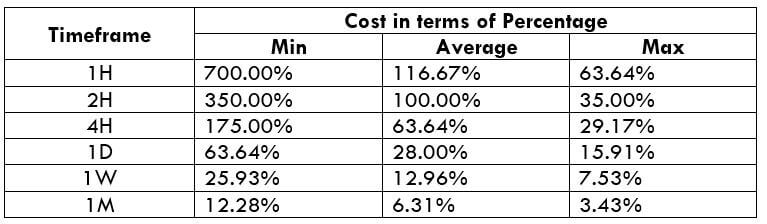
In 2018 in the US a Big Mac cost 5.51 dollars, and in Germany, it cost 3.99 euros. We divide 3.99 by 5.51, we get 0.72 euros, that is, how much a US dollar actually costs. Consequently, the real price in US dollars to euros is 0.72, based on the Big Mac index.

What does the dollar rate depend on?

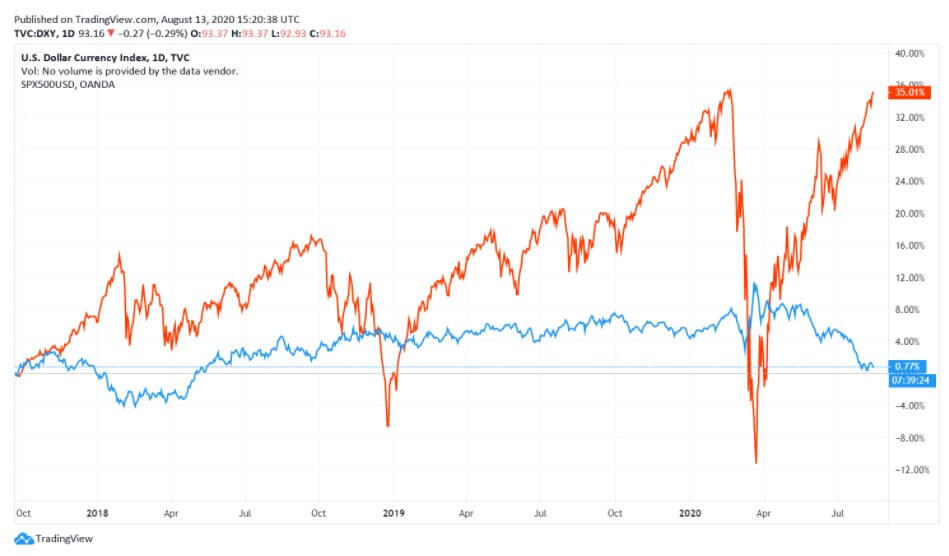
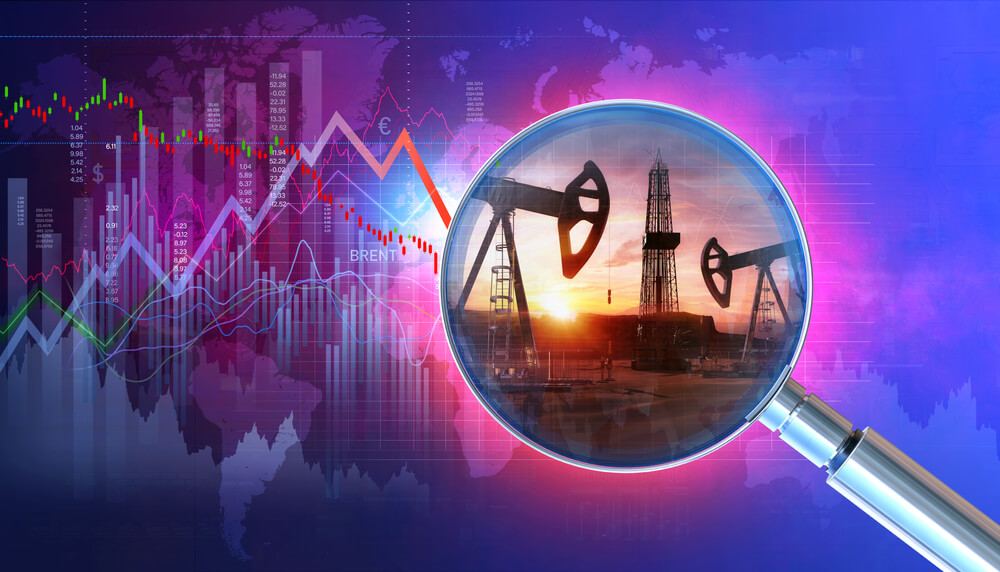
Let’s analyze in this chapter whether macroeconomic indicators, Fed outlook, international risks affect the US currency rate. What influences the cost of this currency? Not long ago, witty people joked that the price of oil may fluctuate depending on whether the prince of Saudi Arabia coughs or not, but few will argue that the figure of the US president is now much more important than Riyadh’s blue blood.

The US president is the most authoritative person on Forex, however, the sensitivity of the market to his words in the first years of the presidency was associated with the element of surprise. Before Trump, rarely did any head of state intervene in the life of Forex, influencing the monetary policy regulated by central banks. Little by little, the market got used to it and began to turn a blind eye to Trump’s words about the dangers of a strong dollar. In fact, there’s a significant difference between what you say and what you do. Trump’s policy is to strengthen the green note as if he does not want to weaken it with words. In this sense, the growing popularity of the US president leads to a revaluation of the dollar.

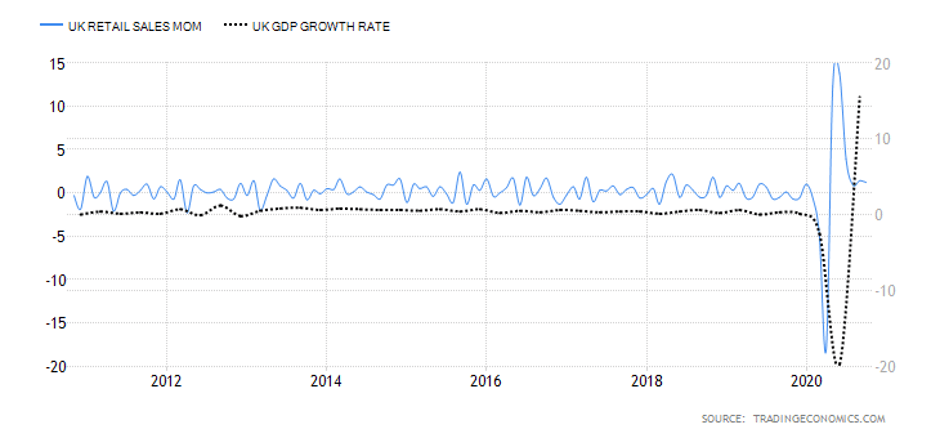
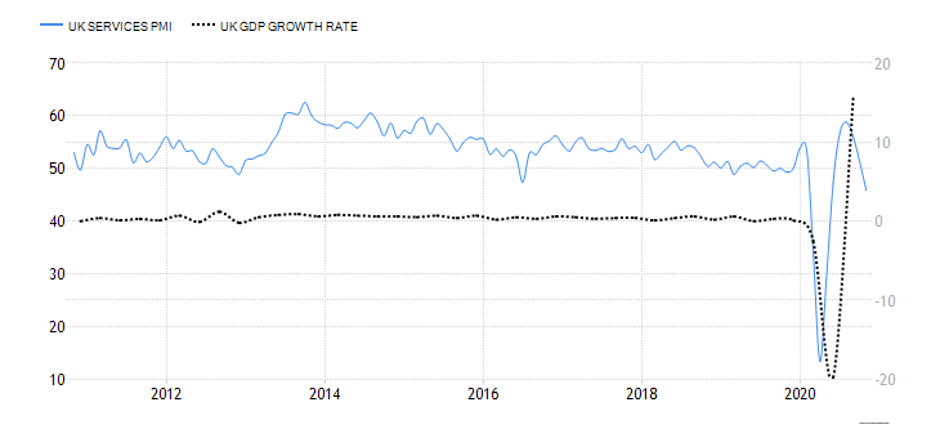
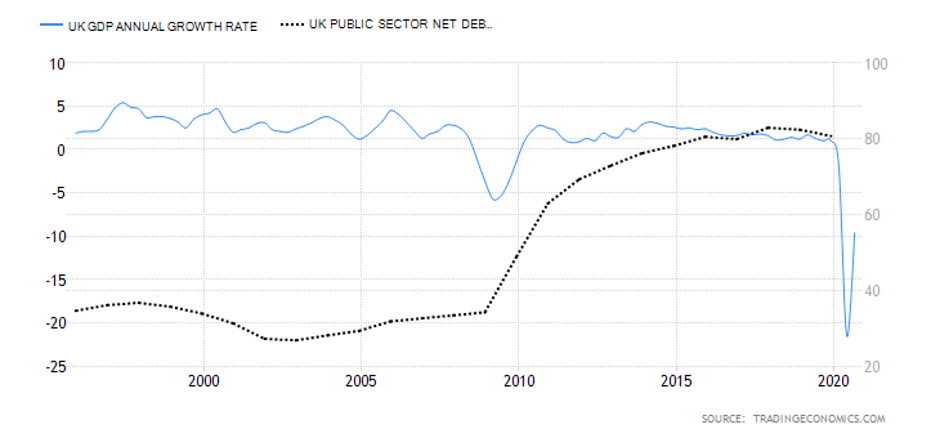
From a theoretical point of view, the rate of the currency is influenced by the financial flows of trade and investment. The demand for foreign currency has been determined by the interest in products manufactured in this country. However, as the economy and public debt grew, stock and bond markets also increased. New issuers of securities appeared, whose demand led to a change in the exchange rate. Including the USD. Normally, at present, investment flows are more mobile or larger, but foreign trade should not be discounted when studying exchange rates.

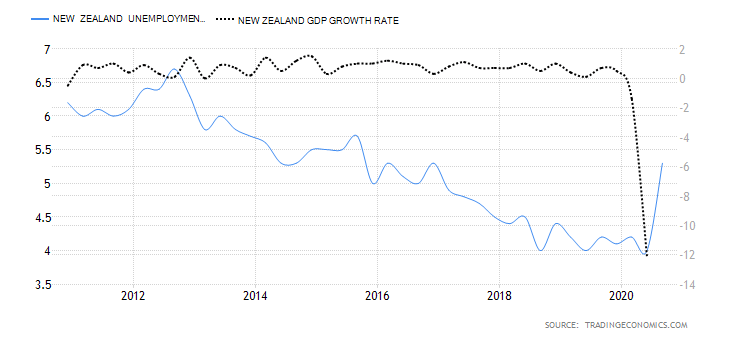
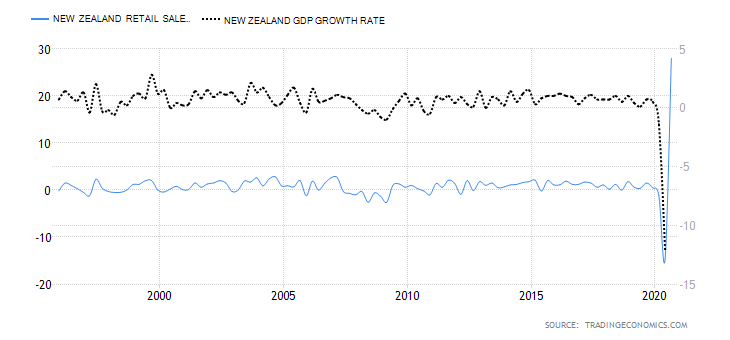
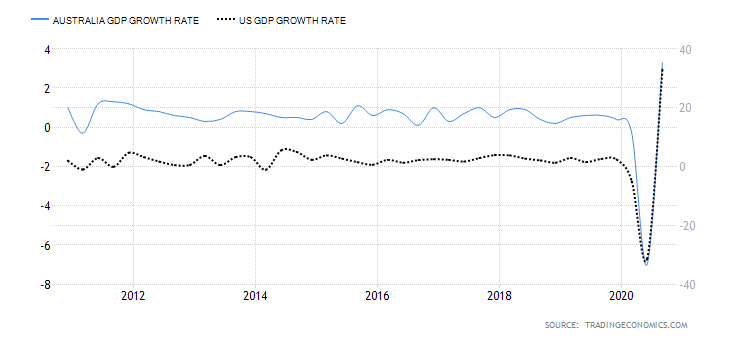
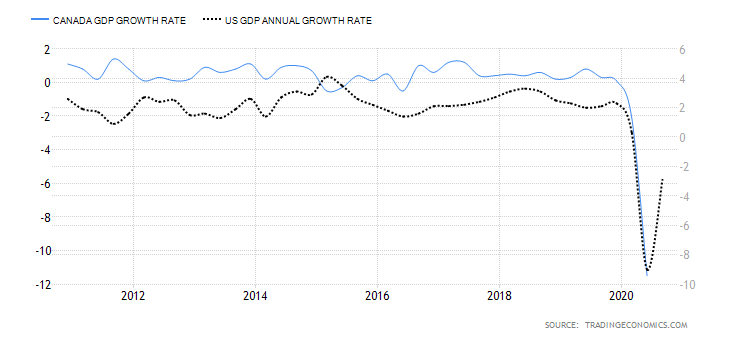
When an investor makes the decision where to invest, in US shares or other shares, he judges based on the state of the economy. Overall, world GDP is believed to be growing faster than US GDP, as the former includes developing countries and China. For China, a growth of 6% is normal, for the US growth of 3% is something incredible. As the world economy expands faster than the US economy, money flows to emerging international markets. On the contrary, the acceleration of US GDP under the influence of fiscal reform or the Fed’s monetary expansion is a great opportunity to buy US shares and the dollar.

In this sense, such external stimuli as trade wars or coronavirus should be considered in on the direction the world economy will take and that of the US. The latter remains stable, the former, under the influence of a slowdown in China’s GDP that is beginning to decelerate. As a result, the dollar is strengthened even in the context of a drop in the rate of federal funds.

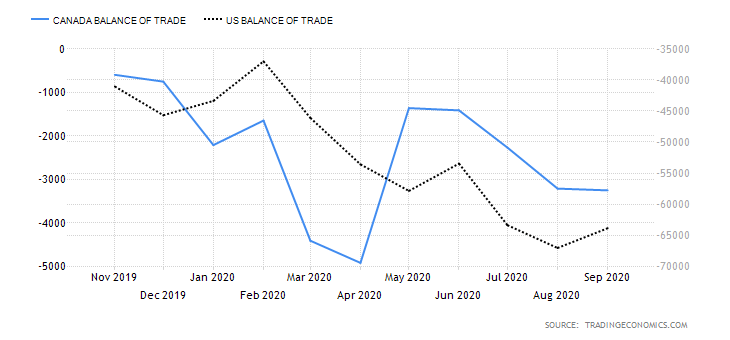
So, no matter how much Trump would like to weaken the dollar if his goal is to accelerate GDP to 3% and reach new historical highs of the S&P 500 or forget about devaluation. The excessive protectionism of the US president and his slogan “America first!” means achieving the goal at the expense of others. Trump is not satisfied with the US foreign trade deficit and is doing everything possible to reduce it. However, let us remember, improving trade flows is a direct path to the growth of the national currency rate!

Along with the stock market situation and the trade balance, Treasury bonds also influence the value of the dollar. Demand for them is driven by an interest in safe-haven assets, which increases in periods of confusion and uncertainty, and by the Fed’s monetary policy. It is no secret that the federal funding rate is now higher than its counterparts in other developed countries. Consequently, the return on US treasury bills is higher. They seem more preferable than European and Japanese values, and that helps transfer capital to the New World and strengthen the dollar.

Devaluation and Overvaluation at an Exchange Value

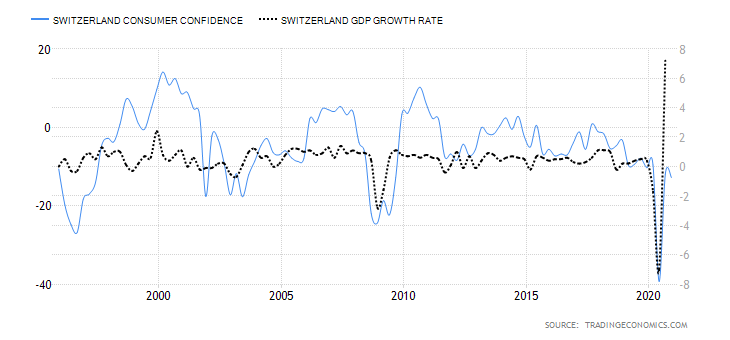
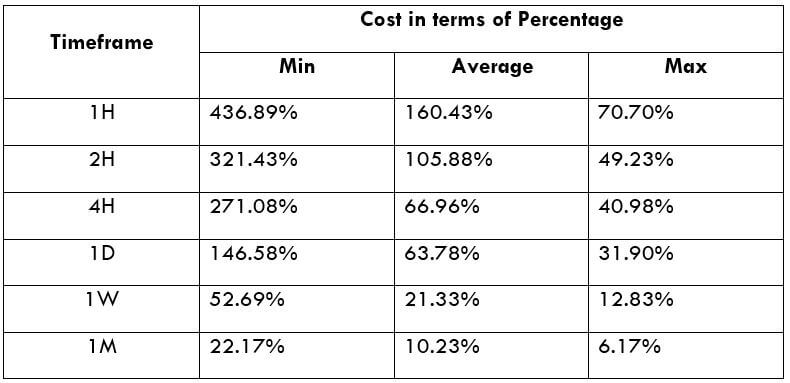
Currency volatility has a big influence on the economy, but most people don’t pay attention to it, as most transactions are done in the national currency. An ordinary person is interested in the exchange value during the trip, paying for goods, any purchased or financial transfers.

Small investors can be satisfied with the strength of the local currency as it reduces the costs of imported products and travel. But a substantially strong currency can sometimes hurt the financial sector in the long run. Industry becomes profitable, in the market, millions of people are left without work. Ordinary people may be dissatisfied with the local currency weakening, as tourism and imports become more expensive, but the devalued currency can give many benefits to the national economy.

The exchange value of a currency is the tool of a central bank, an important sign of monetary policy. So, directly or indirectly, a currency devaluation or overvaluation affects many variables. It will affect interest changes, returns on an investment portfolio, prices for goods and services, employee value. We will study the devaluation and overvaluation of some currencies in real examples.

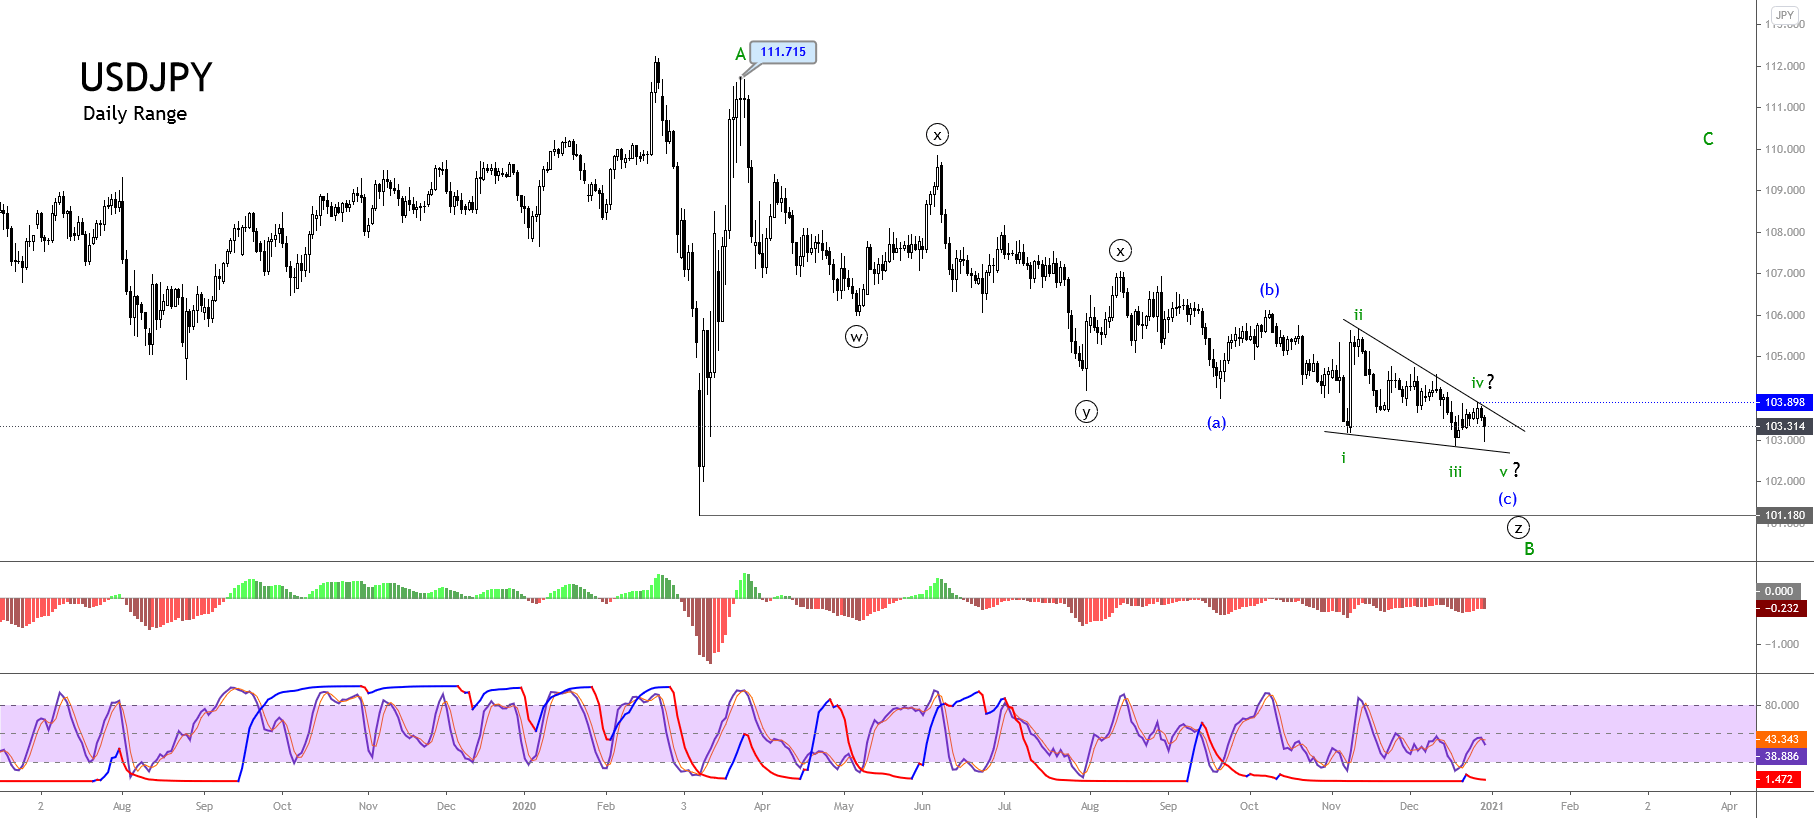
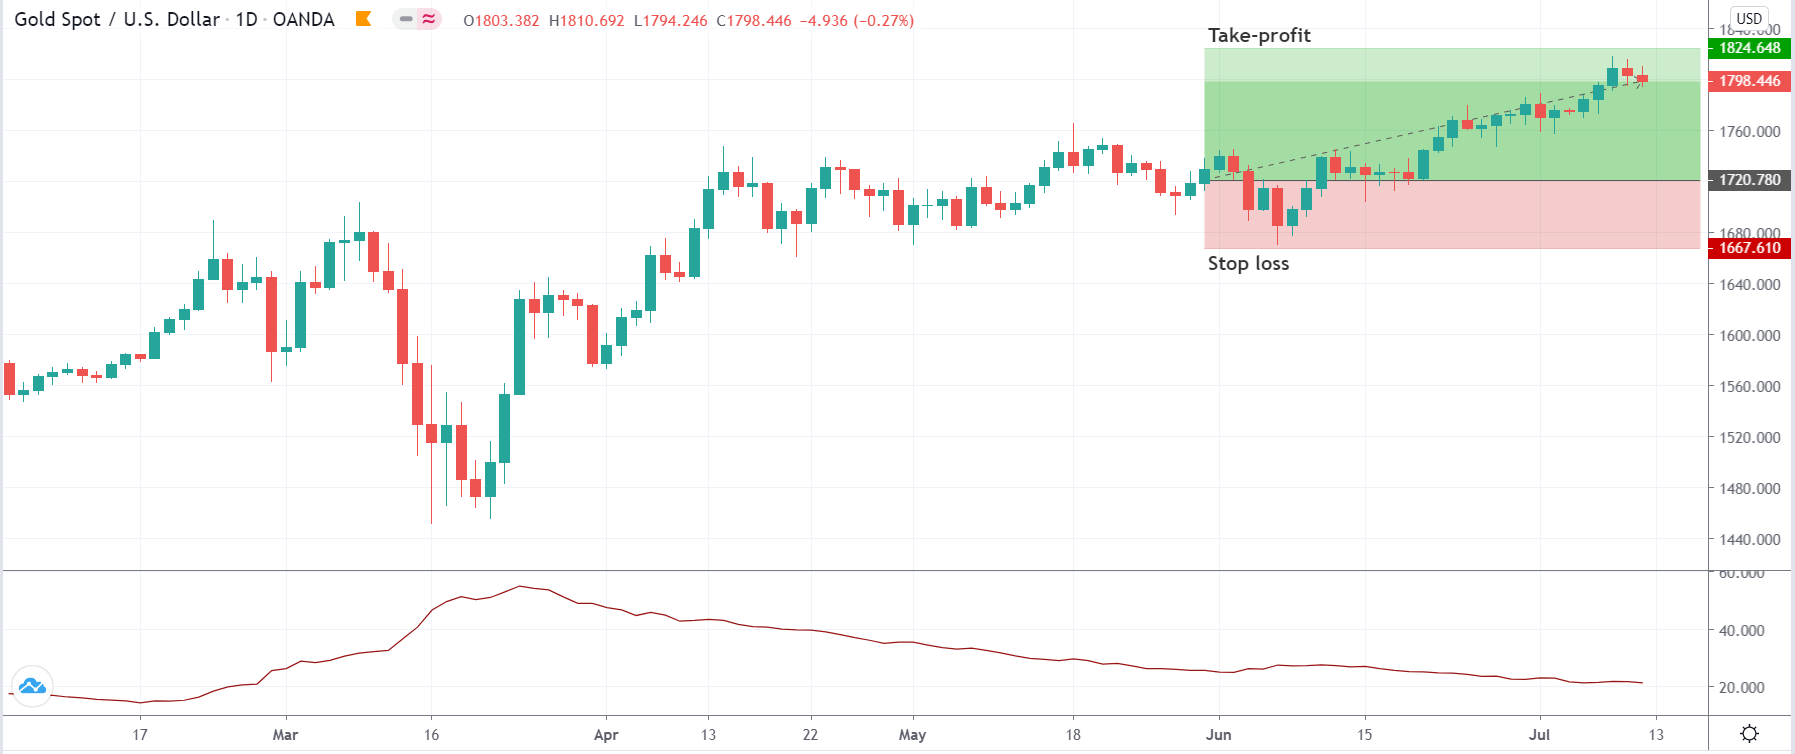
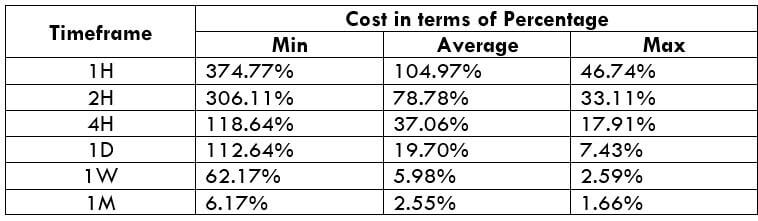
In the monthly USD/JPY chart, it is clear that the yen is growing stronger against the US dollar. This trend may continue because the Big Mac index indicates the devaluation of the yen against the dollar. Values continue to fall in the coming months. The yen devalues to the US dollar by 36.58%, which is significant. It can only affect the economy of the Japanese country. But the reality is that Japan may be interested in this imbalance. The Japanese obviously want to sell their products, and artificially devalue the national currency.

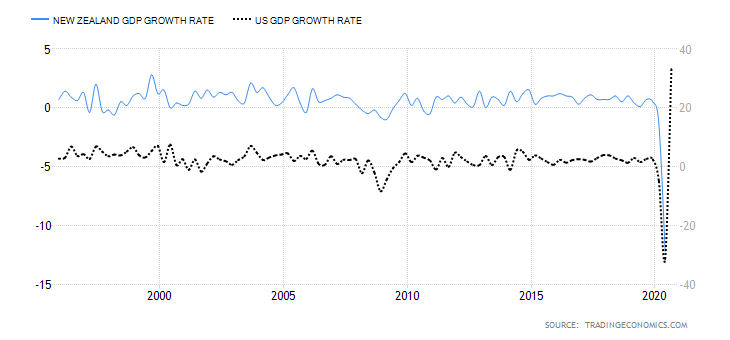
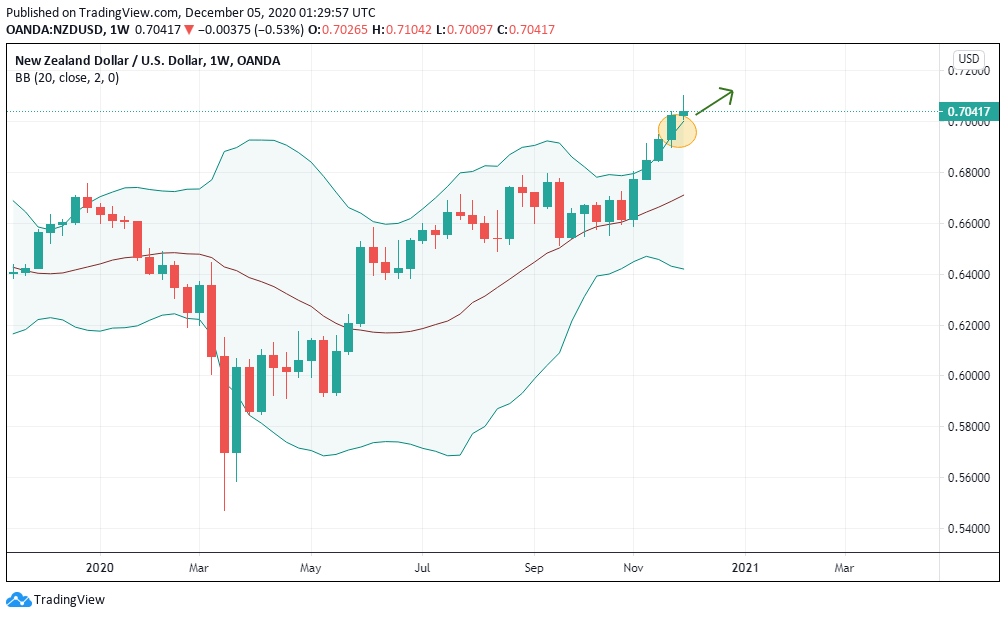
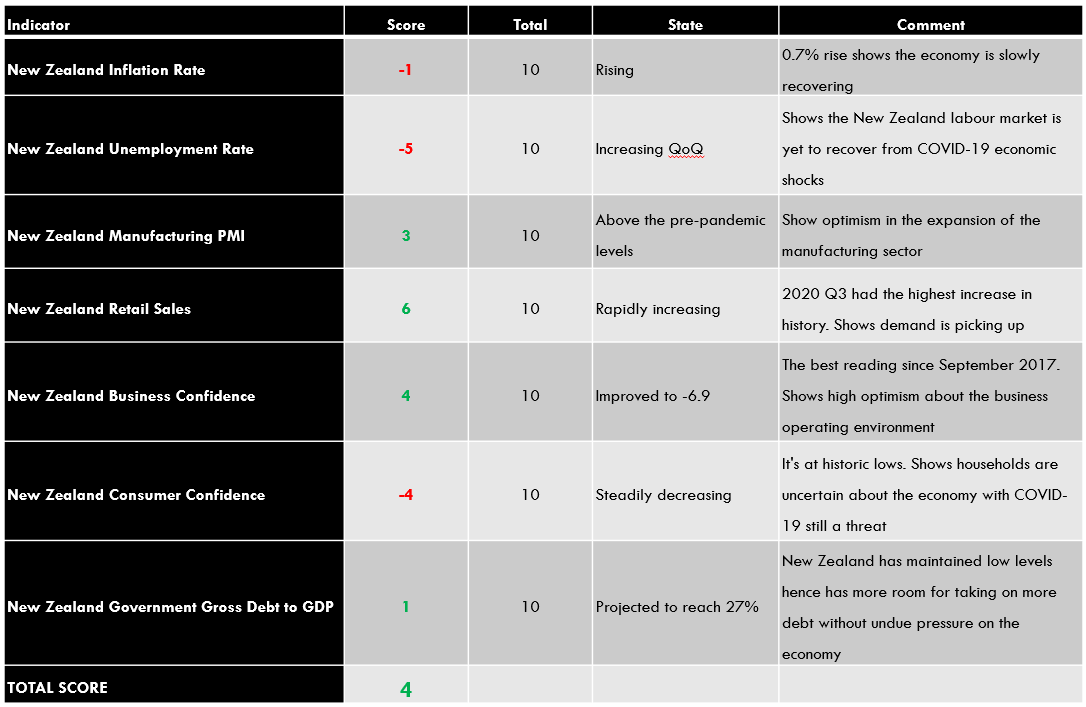
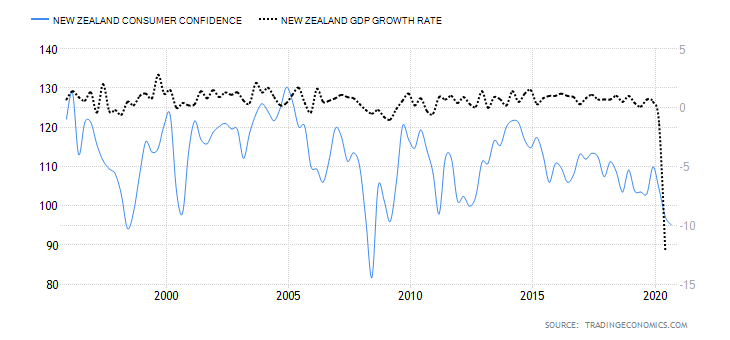
You must remember that the national currency is strictly in Japan. We have been alert about how the Japanese yen grows or falls in price for no reason. The value of the yen remains difficult to predict. Also for the New Zealand/US dollar pair, the kiwi devalues and can grow strong against the US dollar. According to the Big Mac Index, it was devalued by 16.37%.

The value of the kiwi depends heavily on the crop cut in New Zealand, in prices for certain products and food. So the price could go up. Also, the pair could operate in the same direction for a long time, up and down. Visually, you see that price moves in the middle of your trading range.

The Euro also devalues against the dollar by 16.37%, so it can continue to raise the price. However, EUR/USD could rise to 1.23 and fall to 1.035. A price of $1.23 may also suggest that the euro is suffering a devaluation. And as we always say, the Forex market is always unpredictable and surprising.

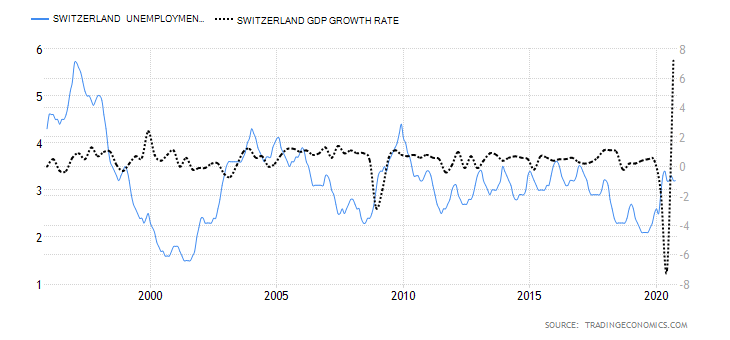
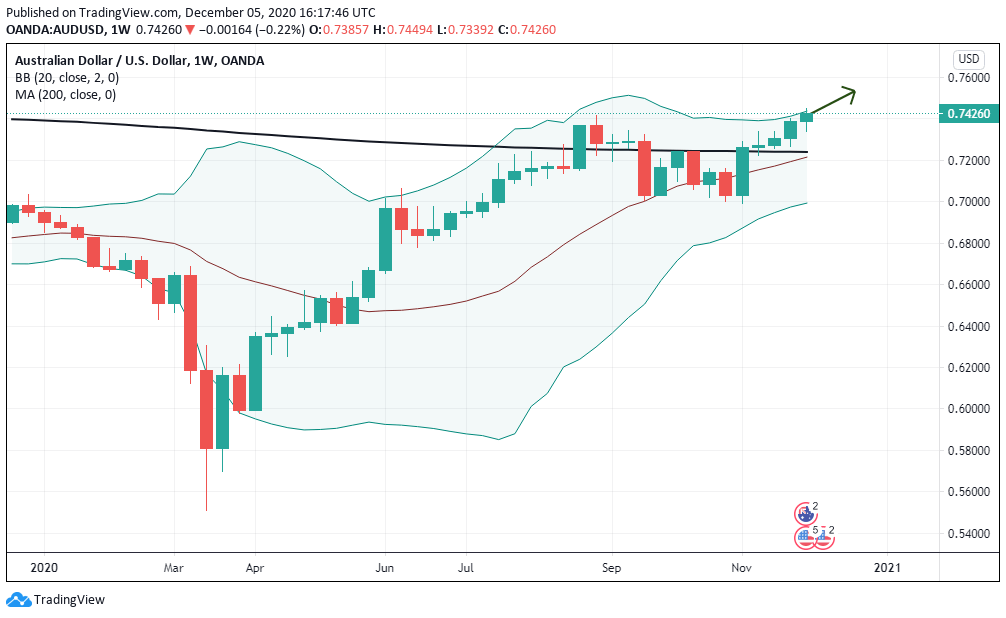
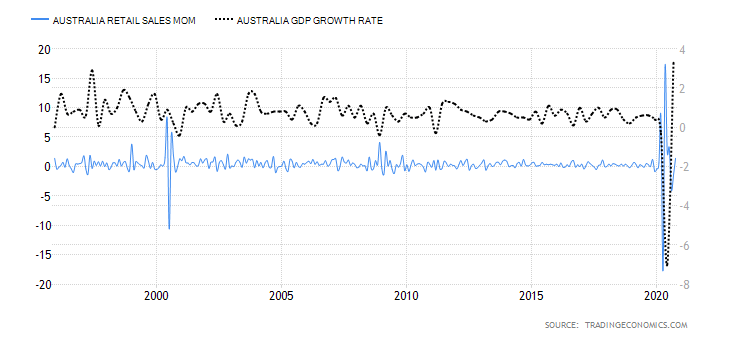
If we listen to the Big Mac Index, the Australian dollar is devalued by 14.57%. AUD is relatively cheap but can change soon. It is clear from the AUD/USD chart is close to your local minimum. The price chart used to raise to 1.10 USD for an “Aussie”. Indeed, you must not wait for the same thing soon; it looks like the hike will follow.

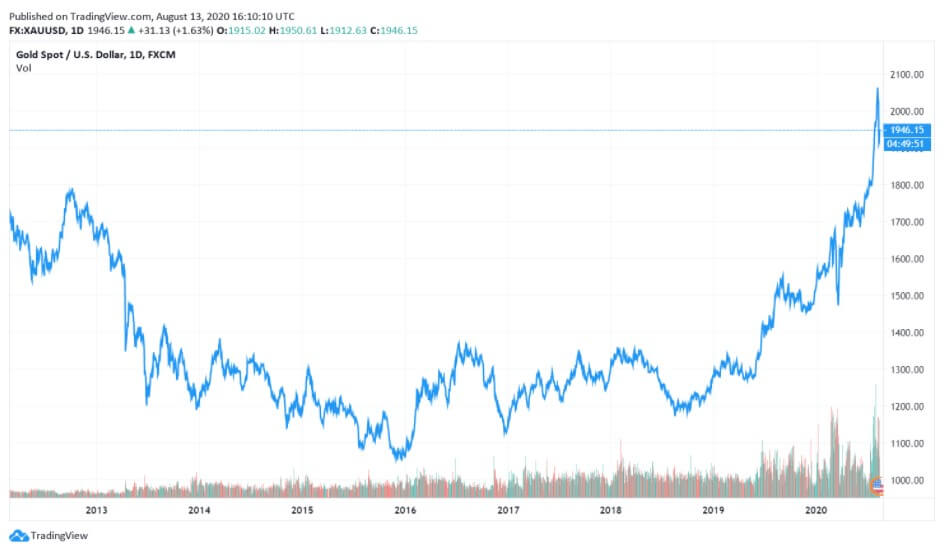
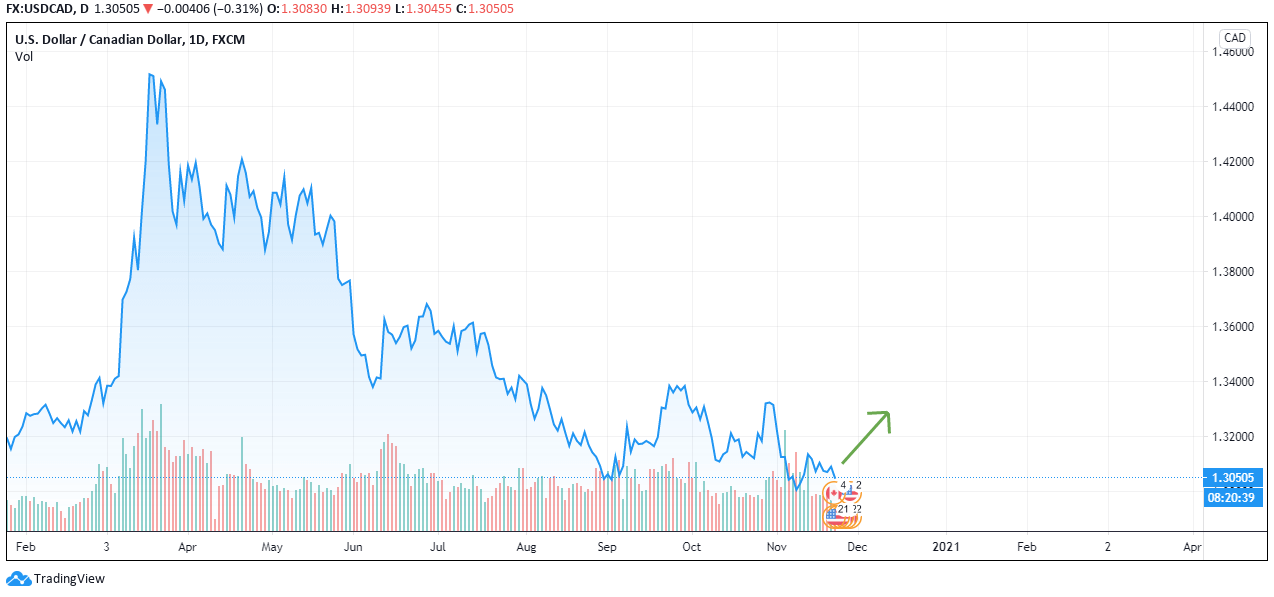
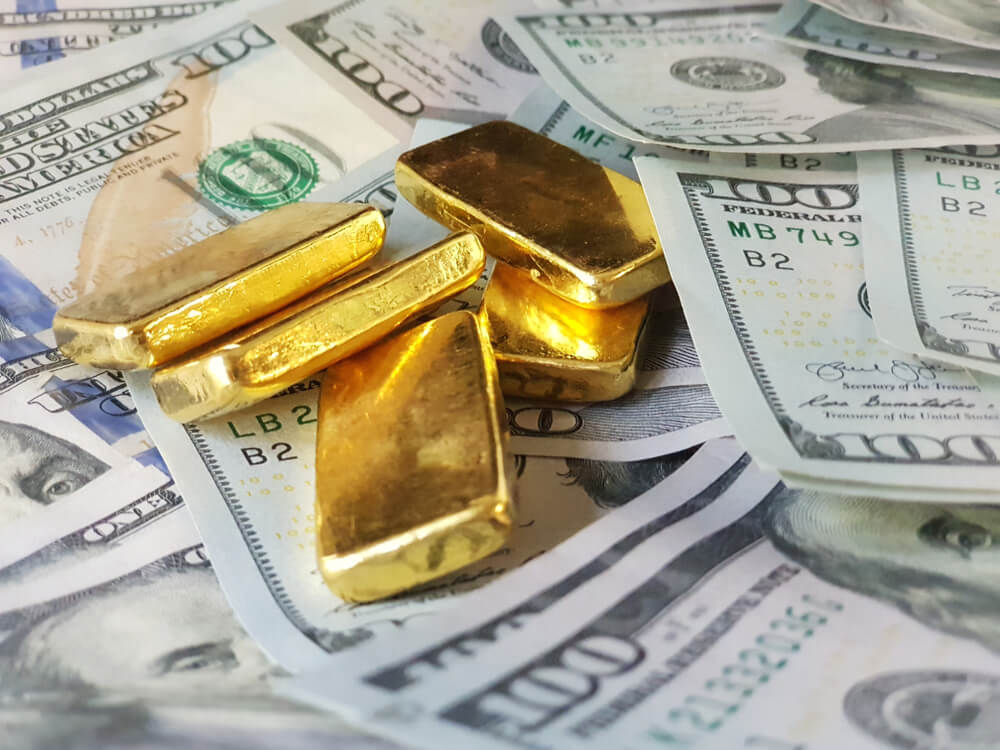
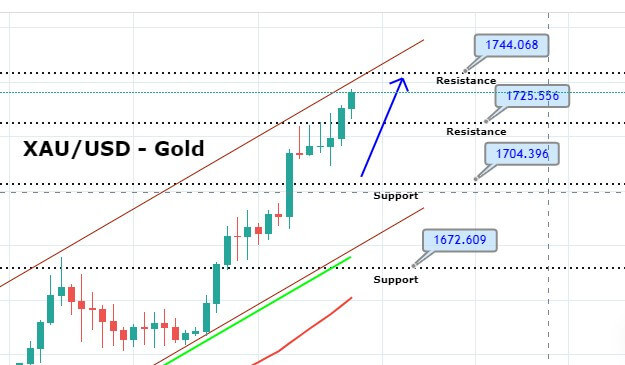
The Australian economy and economic sector depend on the price of gold. For example, If the price of precious metals falls, Australia’s financial sector suffers. But the graphics of gold and AUD/USD is not completely the same. Australia exports gold, but this country also exports a lot of iron, food… High prices for these products can withstand the “Aussie”. Australia can make the Australian dollar low in value. The Canadian dollar is also devalued. If you study the Big Mac cost table, you will see that the “loonie” is 12.16% devalued. USD/CAD was operated at 1.60 and 1:1.

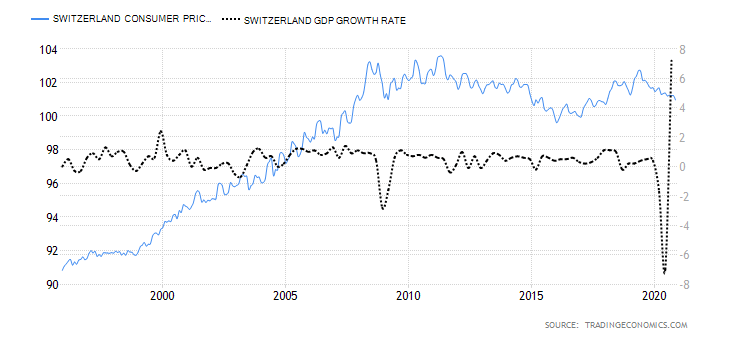
Will the Canadian dollar continue to rise? In reality, no person can safely claim, but the Big Mac index may be correct, indicating it. USD may fall against CAD. It is, of course, over the long term. The Swiss franc pair – the Japanese yen is the most demonstrative of the popular currency pair, characterized by its strength in one currency and the weakness of the other. The yen is falling (-36.58%), and the Swiss franc is the strongest (+27.2%) of all. Most likely, the yen will get stronger and the franc will go down. The value of the pair can go down. But at the very least, the Big Mac index suggests this.

The US dollar pair – the South African rand is illustrative. The Rand is clearly devalued (57.34%). However, it is actively on the rise in recent times. Rand could be even stronger, as this currency is difficult to predict. According to the monthly chart, it can be assumed that the current trend will continue. Necessarily, you require a lot of attention not only to the Big Mac index but to “how far” the price can go.

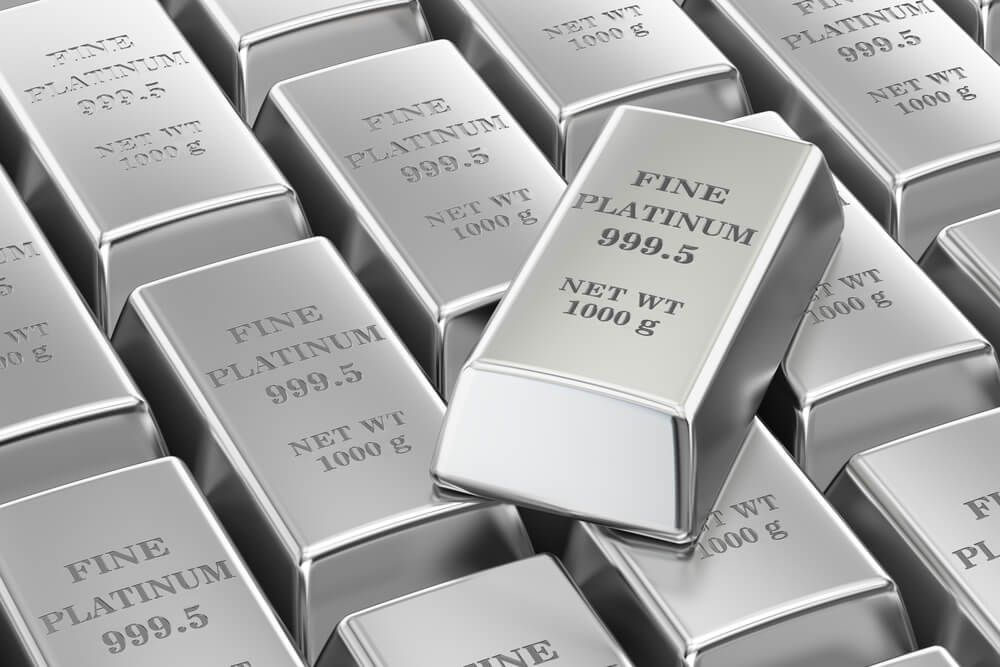
When the price goes too low, it grows more sharply. And the opposite way, when the price is too high, it could fall. Rand, like the “Aussie”, depends heavily on the price of gold. South Africa currently produces a lot of gold. The country’s financial sector and economy are heavily dependent on the price of gold. In addition to gold, South Africa produces a lot of platinum (the world’s largest producer), iron, cobalt… Certainly, we should take all this into account if trade this currency pair.

If you operate USD/ZAR you should also know that there can often be social unrest, attacks on the offices of gold-producing companies, and other setbacks. If there were any problems in South Africa, then the Big Mac Index will not be based on trading decisions. If investors withdraw their capital from the country, factories close, gold mines are blocked, then the national currency falls in value very quickly. The dollar can also devalue fast. It is not the gold standard. However, the price of gold also changes all the time.

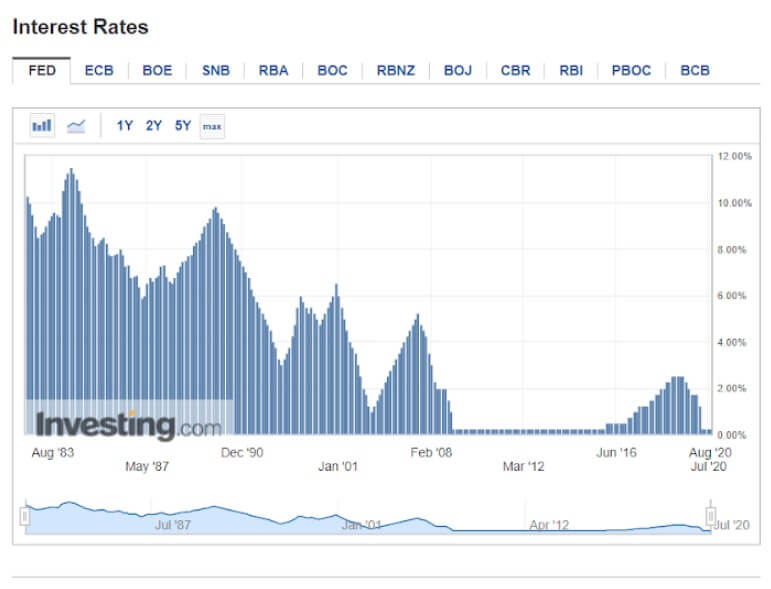
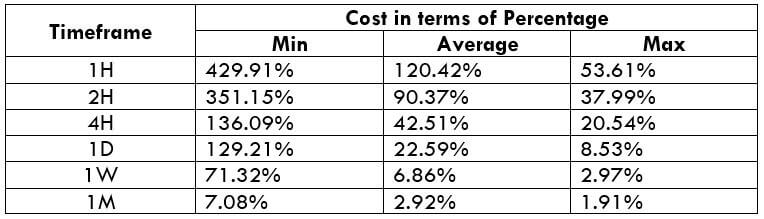
If the United States Federal Reserve changes the interest rate, this will be the most important. And then, it won’t be important how a Big Mac is. The price for the burger will not be significant. For example, in 2008, the dollar dropped sharply when the interest rate dropped to 0-0.25%. In addition to the Swiss franc, there is an overvalued Norwegian krone by 11% and Swedish krona by 9.79%. These currencies have traditionally been overvalued. But, this fact must also be taken into account in trading. Over-valued currencies can fall in price, especially against devalued ones.

Big Mac: Both cheap and expensive

Why is Big Mac so expensive in Switzerland? First, because it’s an expensive job. A Swiss worker earns tens of times more than a worker in Egypt. The Big Mac index is also affected by other factors such as time. In Switzerland, it’s very cold for six months of the year, you have to heat buildings…

Costs are also expensive in Sweden and Finland. The cold climate is considered a difficult factor in these countries. It’s no surprise that a hamburger there is much more expensive than in other countries. It depends a lot on changes in inflation. For example, in Argentina in 2001, where there was a very violent crisis, a Big Mac was cheap because labor was very cheap, and prices for many products fell drastically if they were converted into foreign free currency.

You cannot estimate the total economic performance of a certain country, based on the Big Mac index alone, which should be taken into account as well. For example, Japan and Thailand are very close to each other, and according to the Big Mac index. However, the income of Thais and Japanese cannot even be compared. Thailand has cheap labour in its favour, and Japan benefits from the automation of many processes and the efficient use of labour. For example, to do some tasks, there are few people needed in Thailand. But the same task can be completed by a simple operator in Japan.

Why is hamburger so expensive in Canada? In Canada, in fact, many legumes are produced, oil… But certainly, the weather conditions in the country are extreme. If, for example, in Russia, there are some regions where tropical plants can grow, it is completely impossible in Canada. Heating is expensive, especially during the extreme cold of winter. The Labrador Current cools the country, being expensive for payers and employees tax.

However, the Big Mac index is of interest to traders from Western countries with strong currencies, rather than those from underdeveloped countries.

Conclusion

What conclusion should you draw regarding the Big Mac index when trading currency pairs? This index cannot be entirely accurate or a reference for action. But, the Big Mac index very often suggests an appropriate judgment in a certain currency if it is devalued or overvalued.

Categories
Forex Elliott Wave Forex Market Analysis

USDJPY: Be Ready for this Flag Pattern Breakout

The USDJPY pair presents the breakout of a flag pattern corresponding to the third wave of Subminuette degree identified in green, triggered after the flag pattern breakout observed in Wednesday 26th session. Examine with us what’s next for the coming trading sessions.

Our Previous Analysis

Our previous Elliott wave analysis of the USDJPY pair commented on the complex corrective formation developed by USDJPY since the price topped at 111.715 in March 2020. Also, we recognized the internal structure as an incomplete triple-three pattern. 

As illustrated in the previous daily chart released in late December 2020, the USDJPY pair moved in an incomplete wave (c) of Minuette degree labeled in blue. Likewise, the lower degree sequence revealed the progress in an ending diagonal pattern, suggesting the corrective formation’s exhaustion, which belongs to wave B of Minor degree in green.

Likewise, the breakout of the trendline that connects the end of waves ii and iv of Subminuette degree labeled in green would confirm the end of wave B of Minor degree. In this context, once the USDJPY surpassed the upper-line of the ending diagonal pattern, the pair confirmed the end of wave B and the beginning of wave C of the same degree.

What’s Next?

The USDJPY surpassing the upper guideline of the ending diagonal pattern on January 07th confirmed the completion of wave B of Minor degree and the beginning of wave C of the same degree.

In this context, the first breakout the USDJPY formed in early January corresponds to wave i in green. Likewise, the consolidation sequence recognized as a flag pattern corresponds to wave ii. Both waves belong to wave C of Minor degree labeled in green.

The last breakout developed by the USDJPY activates wave iii that belongs to wave C in green. Its potential advance could strike the psychological barrier of level 106.

Summarizing, the mid-term Elliott wave view for the USDJPY pair suggests that the price action may advance in its wave iii of Subminuette degree, which belongs to the first segment of the internal structure of wave C of Minor degree identified in green. The upward wave iii in progress could exceed the psychological barrier of 106. It even could strike the supply zone between 106.561 and 107.050. Finally, the bullish scenario’s invalidation level is at the beginning of wave i in green, at 102.591.

Categories
Beginners Forex Education Forex Assets

Fundamentals of the United States Dollar (USD)

The safe-haven currency, the United States dollar, known under the ISO symbol of USD or nicknames such as dollar and greenback, has enjoyed a prestigious position as the leading global currency for many years now. Although now the most traded currency worldwide, the USD only took over the throne from the GBP in the late 1800s, that is the early 1900s, which compared with the country’s inception on July 4, 1776, is in fact a rather short period. The USD has experienced times of crisis in the past, and especially now, amid the COVID-19 pandemic, the questions regarding the currency’s strength arise. Surrounded by a plethora of news, which keeps coming out daily, and the US institutions issuing statements in lieu of the current state of affairs, the USD once again defends its long-held unique status among the world currencies.

History of USD 

Before the late 1800s, the British conquest of half of the world helped establish their dominance, rendering the GBP the strongest currency for a period spanning a couple of hundred years. The recognition of the new standard, that is the view of the USD as the new currency of value, resulted primarily from the country’s strong economy and functioning government. Consequently, this new market became also the biggest market in the world with the USD growing to be the most desired currency worldwide.

Now bearing the title of the world’s reserve currency, the USD is the currency of choice whenever foreign governments desire to hold onto their money. As they prefer not to keep these funds in their own currencies, they rely on such diversification mostly due to the need to increase the level of safety. The need for such an approach is most prominent in a small country with an unstable government experiencing numerous ups and downs. If a country keeps all the wealth in their own currency, they risk endangering their financial stability in times of instability or crises, which is why other countries’ safe currencies are employed.

History keeps records of such cases where a country put practically all their eggs into one basket, in a manner of speaking, leaving the country in utter chaos. The notorious example of Zimbabwe, which kept printing more money to the point where it became entirely worthless, should serve as a 30-year-old example of why countries prefer to keep their reserves in more stable currencies such as the USD. The United States’ currency is the standard nowadays which is why many countries across the globe prefer this currency over the others.

The many stories discussing, for example, China buying the US government’s debt are actually the stories of how foreign money is invested in the USD. Even the currency’s value decline due to China’s massive spending involving hundreds of billions of dollars upon their preparations for the Olympics could not shake the USD’s long-term stability. Amid the booming of the world economy, feeling afraid of how this prolonged decline of the USD could impact their reserves, other countries finally decided against keeping their wealth in this currency. The news started to circulate, the tension just kept building up, and the financial collapse hit in the middle of these speculations. Nonetheless, all other currencies except for the USD and JPY fell in value. The event proves the point that the USD is an exceptional currency with the best track record and a strong economy to back it up.

Each time other countries, aside from the United States, have some additional reserves, they often choose to buy the USD, which is generally bullish for this currency. However, whenever countries undergo challenging periods, they may typically decide to sell a portion of their USD holdings which has a negative impact on the currency. Generally looking at the connection between the USD and other currencies, most currencies have historically been pegged to the dollar at some point, especially around WWII and after.

Another important fact concerning the USD is that almost all commodities are generally traded in this currency. Should you, therefore, wish to purchase oil, you would have to do it in the USD. In case you have some other currency at your disposal, such as the EUR, you would then exchange it into the USD to proceed with the purchase. This connection is really significant which is why this topic will be thoroughly discussed later in the text.

With regard to US institutions governing the matters vis-à-vis the USD, the US Treasury Department, which is part of the US government, bears the responsibility for the supply of the money, while the Federal Open Market Committee (FOMC), a partly government agency, handles the related policies. These are two main bodies that control the money in the United States and whose responsibilities will be further discussed in another section below.

The Gold Standard

The US government was the first one to leave the gold standard back in the 1930s, which basically refers to the idea that a country had to have a hard asset to back up the money it wanted to print. Prior to the onset of the new dollar era, the United States would print the gold, silver, and bronze dollars. Back in the days where this monetary system was followed, the value of the dollar derived from the commodity, not the government. This further means that the same quantity of gold had an equal price across different countries, so the money had equal value worldwide regardless of the printing design.

With the shift toward the use of paper money in the late 1600s, the US government still followed the same principle of hard assets providing the money’s value, which gave birth to the above-mentioned gold and silver notes. While these old notes are still available for online purchase nowadays, we cannot now go into any bank and exchange such a gold note of 100 dollars for the equal worth of gold as was possible before. The price of the USD was, hence, entirely attached to the price of the hard assets, and this is how worthless paper actually acquired the value of real gold and silver.

The previously mentioned FOMC was formed in 1933 when some of the United States’ best bankers gathered in private at which point the country decided upon letting go of the rule that prohibited countries from printing as much money as they wanted. Although this country was the first to move towards another monetary policy, which caused great turmoil around the world, all other countries moved along with applying the same changes. By the late 60s, the entire world had already adopted the same strategy.

The new system implied that countries no longer had to store all the gold and the silver, i.e. the hard assets, in order for them to be able to print money, called the money supply. The money supply is basically the total amount of one country’s money in circulation. This however does not only refer to the printed money as only 6% of the entire USD has been printed on bills. The remainder actually pertains to digital numbers, such as the money in an individual’s bank account. The phenomenon is similar to that of cryptocurrencies, and some companies may even allow you to exchange these numbers in a ledger for the USD. As money is generally digital, if the bank does have enough money at the time of the desired withdrawal, you will not be able to take out the money, or the bills, that you requested.

The US Agencies 

As discussed before, the US Treasury is tasked with deciding on how much money is going to be printed, controlling the money supply. The FOMC, on the other hand, is responsible for monetary policy, which further implies that they control interest rates, bailouts, and other important segments related to the country’s finances.

The United States comprises 12 sections governed by 12 different bank presidents charged with submitting individual reports concerning their districts. The reports are shared and discussed upon meeting with other committee members going through the information prior to making a vote. The voting is conducted so that it allows only five regional bank presidents to get a vote, rotating the votes in a manner that prevents the past year’s vote from coming up again. Out of the 12 members, the 7 remaining ones actually come from the FOMC. They alternate meetings between six and eight weeks apart, and the head of the committee that is the Chair of the Federal Reserve (the Fed) has the tie-breaking vote. 

FOMC Procedures

The current Chair of the Federal Reserve of the United States is Jerome Powell, who spent most of his time in the Banking Industry. Due to his banking background, he differs from the previous scholars and economists who used to perform this function in the past. The current Chair’s aforementioned experiences make him appear to truly understand more about banks than the previously chosen individuals, who are appointed every four-six years. 

Every other meeting involves the Chair holding a press conference, where he reads a prepared statement and conducts the Q&A session. In these meetings, the Chairs would typically share a lot of important information, which has historically been likely to usurp the market’s stability. The market would suddenly become quite volatile and traders would react to these events. The former Chair of the Federal Reserve of the United States, Alan Greenspan, was famous for the statement about the market he gave in the 90s that resulted in quite a turmoil. The market went down by 10% the same day only to go up and double after that, making the market even more unstable. These figures appear to exercise more control in their public statements nowadays, although these events have been said to still have an effect on traders and the market.

Key US Reports

The key documents providing the greatest insight into the state of the USD and related matters include the following five reports: GDP, employment, producer and consumer price index, retail sales, and trade deficit reports. 

The GDP or the Gross Domestic Product report provides information on this important economic indicator that signals the condition of the overall economy of the United States. Providing insight into the country’s productivity, the quarterly report is said to have a particular impact on traders and their decision-making. The United States, in fact, issues three such GDP reports: the initial report that comes out approximately three weeks upon the end of the quarter (e.g. if the quarter ends toward the second part of the month, the initial report will probably come out around the 20th of the following month); the second report issued a month later that will contain some actual numbers based on the revision of the previous data; and, the final number that comes out three months upon the quarter ending. Among the three, the least attention will be directed towards the final reports, which appear to only hold relevance for the record books, whereas the first one will generate the most interest. As the initial report of the quarter, it gives important clues to traders, which is why, for example, every January 20, April 20, July 20, etc. will be important dates that should be part of the traders’ calendars. 

Non-farm Payroll measures employment or the number of people employed in the previous month and many traders rely on this information due to its relevance. The report typically comes out the first Friday each month and entails an extremely important indicator of consumer spending. Should the Friday fall on the first of the month, the issuance will be postponed to the following Friday of the month. When the results exceed expectations or predictions, they are considered to be positive (bullish) for the USD, while the opposite scenario is considered as negative (bearish) for the currency in question. Some currency traders claim that the Non-farm Payroll report is one of the best reports to trade.

The monthly producer and consumer price index (PPI and CPI) are important indicators measuring the economy’s performance. PPI is an important piece of data that signals future expected inflation, any positive change in this index entails the rise of prices as well as the possibility to save money and earn interest. The PPI is said to have little effect on the USD per se, but its correlation with the CPI is found to be extremely important by some astute forex traders. The CPI, unlike the PPI, provides insight into current growth and inflation levels. What traders can generate from this information is an understanding of the impact of inflation on the USD. For example, the first half of 2018 recorded a rise in inflation which correlated with the increase in the US Dollar Index (DXY).

The retail sales report notes the changes in sales as an important indicator of consumer spending, which is said to account for approximately 70% of economic growth in general. Traders keen on trading the news find this information important, especially in the light of the recent pandemic. Similar to the Non-farm Payroll report, a positive retail sales reading generally proves to be bullish for the USD, whereas a low reading is seen as bearish.

The trade deficit, the last report, is considered important due to the fact that during such deficits, the USD is generally noted to weaken. As currencies are susceptible to change because of a number of factors (e.g. economic growth, interest rates, inflation, and government policies), trade deficit should be perceived as one of the determinants. Generally, the trade deficit is considered to have a negative impact on the USD although the currency’s appreciation could stem from other reasons.

Major Currency Pairs

The following seven currency pairs are said to have the greatest volume: EUR/USD, USD/JPY, GBP/USD, USD/CHF, USD/CAD, AUD/USD, and NZD/USD. The EUR/USD pair is said to hold 37% of all trading volume in the world. While this number can oscillate up and down, this currency pair is in fact the most liquid pair among the seven major ones and is generally considered one of the safer pairs to trade. Traders who are invested in trading big news events are the ones that should be particularly drawn towards the most liquid currency pairs since these entail tighter spreads and less slippage. What is more, traders interested in trading the Non-farm Payrolls report are advised to give this currency pair a try because, while it cannot grant 100% success, it does alleviate some of the challenges concerning trading currencies. 

With a total of 10% of the entire trading volume, USD/JPY accompanies the previously discussed currency pair to hold almost half of the world’s trading, making these two a focus of many traders’ attention. As the USD is the most popular currency in the world, every trade involving this currency should entail great trading volume even with pairs such as NZD/USD.

USD/Gold Correlation

The negative correlation between the USD and gold is considered as one of the most important topics regarding this currency. These correlations can at times increase or decrease in strength, but from the perspective of history, the USD has an 80% negative correlation with the price of gold. This further implies that once the price of the USD appreciates, the gold’s price should plummet, and vice versa, which can be seen from the chart below (spot gold is red while DXY is blue). Although at one point both prices started moving in the same direction, these occurrences are very short-lived because the standard negative USD-gold correlation is of a long-term nature and eventually everything goes back to its place. The strongest correlation, and the most prominent one, is the one that the USD has with the price of gold. It is an indicator that as soon as the price of one goes up, the price of the other will start moving in the opposite direction. Naturally, traders can find exceptions and this cannot be perceived as a guarantee, but this correlation has been present for many years.

Trading USD

As one of the most liquid currencies worldwide, the USD allows for traders peace of mind when trading the related currency pairs. The only exception to this rule is when trading big news events or if traders are expecting some important move in the market. The USD is generally perceived as the safest currency to trend with the tightest spreads and the least amount of slippage, although some traders avoid it due to the big banks’ attention, involvement, and impact on this currency and, hence, traders.

Upon the economic crisis of 2008, the FOMC was the first central bank to raise interest rates, and years passed until others started to do the same. The USD is certainly not the currency with the highest interest rates in the world at the moment, but we have witnessed how they kept soaring at a dramatic pace at a few points in the past. The reason why this happens lies in the central bankers’ desire to keep inflation under control. Therefore, whenever the economy is improving, the interest rates are increasing.

The currency market implies the flight to safety on one hand and the flight to risk on the other, which is why we have money flowing either in or out of the country. Therefore we can conclude that the reason behind the FOMC’s aggressive rise in interest rates is the strength of the US economy. As it is the largest economy in the world, it does impact the rest of the world. Hence, when the US economy is doing well, so are the other countries.

Whenever money is on the lookout for investment, it will direct itself towards risk, which entails locations such as China, Vietnam, and South America, heading towards the places where the greatest return on money can be found. The FOMC kept increasing the interest rates, but this did not always entail a strong US dollar since the rest of the world was in fact doing better at the time. Inflation was kept under control since 2008 and the world seemed stable until the onset of the COVID-19 pandemic.

An important fact regarding the USD concerns trade deficits owing to the fact that the United States imports increasingly more than it exports, in particular with countries such as China and Japan. These trade deficits are a long-term negative for the currency because the individuals living in the United States and buying foreign goods keep seeding the money out of the country, and it is these other countries where this money is reinvested. The opposite scenario, where the United States could do more exports and the money would come into the country, as a result, would create a trade surplus. The country’s age-old tendency has been one of the popular topics highlighted by US politicians as a long-term negative on the currency.

Economic activities always affect the USD price, so if the United States is undergoing a challenging period unlike other countries, the US economy can be expected to keep struggling. On the contrary, should the rest of the world be experiencing economic struggles, the US economy would probably be doing well. Nevertheless, in order to trade the USD successfully, traders are always advised to do extensive research and monitor the external factors surrounding the currency market. 

Impact of COVID-19

The pandemic has taken the entire world by surprise, also shaking the United States economy, leaving 22 million Americans unemployed. The worldwide economic shock has revealed a silver lining for the USD as it has led to a number of investors selling riskier assets (e.g. stocks and bonds) and taking cash as a form of safety. The currencies which were highly exposed to global trade suffered depreciation as they typically sell-off in the face of economic deterioration, but the US dollar again emerged as the currency of choice in times of crisis. As investors always flee to safe-haven currencies in such unpredictable times and as the COVID-19 pandemic is driving the global economy into recession, the demand for the USD rose to the extent that the US Federal Reserve has to set up new swap lines in order to be able to lend money to the central banks of other currencies. The USD is currently seen as the strongest currency probably due to the country’s stable and safe economy. However, such strong demand can even exacerbate the current situation which pushed the Federal Reserve to protect the currency from shortages. 

Although the USD did not appreciate more than in 2007, the currency’s index value did approach near record highs. So far, the USD has slightly leveled, still maintaining an edge similar to many major currencies (e.g. EUR or JPY). Nonetheless, the current preference of the USD and its strength seem to be calling for an increase in international collaboration. Now, as the Federal Reserve is yet again pumping the currency into the world market, the trend may have serious implications for other economies. For example, after the 2008 crisis, the cost of export created by a soaring JPY left Japan worse off than some countries directly affected by the financial tumult, starting with the United States itself.

Business owners across the world understand that should the pandemic continue, they will require significant capital reserves to withstand the blows of the economic contraction. The spread of the virus certainly motivated some large currency moves as well and, although similar tendencies have been recorded in the past, the pandemic does make this situation one of a kind. The quick-paced forex dynamics and capital outflows from emerging markets appear to be much more prominent.

The state of equities at the moment is certainly interesting as we can see from the chart below. The same contrasting behavior between DXY and SPX500 was noticeable before as well as during the financial crash of 2007. March was another time in history when a significant drop in equities was quite prominent only to go up recently.

Interest rates in the United States of America have leveled after the brief increase in the past year and as of March equal 0.25%, unlike the values proposed by some other central banks of the world. The current interest rate is practically the same as it was in the post-crisis period of 2008, where it maintained the same 0.25% until the beginning of 2015. Interest rates across the world mimic the same decline as that of the FOMC. However, some other central banks, e.g. the Central Bank of the Russian Federation (CBR) and People’s Bank of China (PBOC) keep their interest rates above 4%.

China’s and Russia’s attitude towards the USD has kept economy-related media and various markets’ participants quite entertained in the past few years, especially in relation to gold and surrounding events. The so-called de-dollarization appears to be backed up by previous political altercations between China and Russia on one hand and the United States on the other. These long-term geopolitical rivals were found in the middle of a currency war where the two countries appear to be fighting against the global hegemony of the USD. 

Despite countries leaving the gold rule, this pre-pandemic gold spree appeared strange in this digital era. However, the central bank of Russia suspended buying of gold on the domestic market which has been explained by the attempt to strengthen the local currency aligning with lower oil prices and the spread of COVID-19. Quite interestingly, Russia is claimed to have exported more gold than gas in the second quarter of the current year for the first time in approximately the past 30 years. Analysts explain the entire situation as a mechanism that stops Russia’s purchases of foreign currency and gold when the prices of oil fall below $42 a barrel. With gold prices reaching all-time highs beginning of August 2020, many major Chinese banks have already taken measures to stop customers from purchasing gold and other precious metal-related products through them.

Gold prices have gone up and down in the past, so the increase from the beginning of 2020 can be attributed to the onset of the COVID-19 pandemic as well as part of its natural longer upward trend. The current price exceeds that of the financial crisis of 2007 by far and the precious metals appear to be moving even higher, supporting the expectations of the US inflation increase. 

The FOMC maintains a positive outlook on the future, assessing the May employment rise in a number of sectors, employees’ return to work, and the reopening of many businesses. Some analysts even look back at the times of the previous financial crisis where many feared inflation, highlighting the importance of preserving a more enthusiastic perspective of the future of the USD and the US market.

The USD has once again been proved to be the reserve currency of most countries across the world with more than $1.8 trillion of Federal Reserve notes in circulation. This de facto global currency appears to be positioned well for future trades despite the severity of the global viral threat. The United States’ official currency is currently largely outside the country’s borders, yet it may be difficult to foresee any other currency taking over the USD prominence in the near future.

Categories
Forex Course

201. The Relationship Between The US Dollar & Crude Oil

Introduction

There is a strong and rather undiscovered string that brings together currencies and crude oil. Price actions in one area, it forces opposing or sympathetic reactions in the other. Such a correlation persists for different reasons that include the balance of trade, resource distribution, market psychology, etc.

Additionally, crude oil makes a considerable contribution to deflationary and inflationary pressures that reinforces the inter-relationships amidst the trending periods, to downside and upside.

The Relationship Between The U.S. Dollar and Oil

Oil is quoted in U.S. dollars; therefore, each downtick, as well as an uptick in the currency or in the communities price, create a direct realignment between the numerous forex crosses and greenbacks. Such movements are not that correlated in countries without major crude oil reserve.

The Changing Scenario Of Oil Correlations

Many countries harnessed the crude oil reserved amidst the historical rise of the energy market between the 1990s and 2000s. Borrowings were made excessively to develop infrastructure, execute social programs, and expand military operations.

Post the economic collapse of 2008; the bills came to sue wherein some nations delivered whereas the others decided to double down by borrowing more against the reserved in order to rebuild the trust among their impacted economies.

The substantial burden of debt assisted in keeping high growth rates until the price of the global crude oil collapses in the year 2014. This also threw commodity-sensitive countries in a recession zone. Brazil, Canada, Russian, etc. experienced a struggling period for a couple of years while they adjusted to the plummeting values of their currencies. However, they did make a comeback between 2016 and 2017.

The pressure to sell more has spread across different groups of commodities, increasing concerns related to global deflation. Subsequently, it strengthened the correlation between commodities that were affected that include economic centres without major commodity reserves and crude oil.

Moreover, currencies in countries that have major mining reserves but inadequate energy reserves witness reduced currency value in comparison to oil-rich countries.

The U.S dollar has benefited from the decline of crude oil because the U.S economic growth is for some odd reasons compared to the trading partners, maintaining the right balance.

[wp_quiz id=”97491″]
Categories
Forex Course

200. The Correlation Between USD/CAD Pair & Crude Oil

Introduction

Crude oil, also known as black gold, is the major energy source that runs the economy. Canada is among the top oil producers in the world. It is one of the major oil exporters to the USA. Canada exports more than 3 million barrels of petroleum and oil products, a figure that is sufficient to impact USD/CAD’s movement.

USD/CAD and Crude Oil – The Correlation

The volume of crude oil that Canada exports to the US generate massive demand for the CAD. Moreover, Canada’s economy depends a lot on its exports, and approximately 85% of the country’s exports go to the US.

Therefore, the value of USD/CAD is significantly impacted by how the consumers in the United States reach oil prices. If the US’s demand increases, manufacturers have to order more oil to cater to the rising demand. This can result in rising oil prices, thereby resulting in reducing the value of USD/CAD.

Conversely, if the US’s demand falls, the manufacturer will not need to order in more oil to make goods. Subsequently, the oil prices might fall, which would be bad from the CAD value. So essentially, USD/CAD has a negative correlation.

It’s all about Supply and Demand

Supply and demand are the prominent influencers of the correlation between USD/CAD and crude oil, impacting the demand and supply of US dollars and Canadian dollars.

Export of cruise oil covers a significant percentage of the US currency acquired by Canada. This means that a shift in the price and volume of crude oil will have a considerable impact on the flow of the Greenback into the Canadian dollar.

Furthermore, high crude oil prices also imply a higher flow of USD into Canada due to its exports. This implies that there will be a strong supply of the USD into the Canadian dollar, thereby increasing the value of the Canadian dollar.

Similarly, when the crude price falls, the US dollar supply will be lowered as opposed to the Canadian dollar, leading to a decreasing value of the Canadian dollar.

[wp_quiz id=”97486″]
Categories
Forex Course

198. The ‘Dollar Smile Theory’

Introduction

The U.S. Dollar Smile Theory is a popular notion that illustrates that the U.S. Dollar stays positive in good as well as bad market conditions. This theory was created by a former economist and strategist Morgan Stanley, and it became popular in 2007.

This was the time when the U.S. dollar witnessed a significant boost amidst the global recession. Many times, looking at the market conditions, people would think the U.S. dollar would fall, but surprisingly it continues to grow.


Source: here.

Why does that happen?

The Dollar Smile Theory answers this question.

Following are the three scenarios that Morgan Stanley put forward to explain the positive growth of the U.S. Dollar.

  • The Strength Due To Risk Aversion

The first reason that the U.S. dollar rise is due to risk aversion. This is a situation where investors rely more on safe-haven currencies such as the dollar, yen, etc. During this period, investors consider the global economy in an unstable position. Hence, they are less likely to invest in the risky asset; instead, they put their cash on U.S. dollars.

  • The Dollar Weakens to New Low – Economic Recession and Slowdown

Under this scenario, the US dollar falls to a new low. The bottom of the smile indicates the dull performance of the currency as the economy struggles with weak fundamentals. Additionally, the possibility of falling interest rates also impacts the position of the U.S. Dollar. This results in the market participants steering clear from the dollar.

Subsequently, the primary motto of the U.S. Dollar becomes to Sell. Investors move from buying the currency to selling it and moving towards currencies that are providing higher yields.

  • The Strength Of The U.S. Economy Helps

The U.S. dollar continues to grow because of the strong economy of the country. After the low, a new smile emerges as the economy sees its light at the end of the tunnel. With the signs of the recovery of the economy, a sense of optimism spreads through the market.

This increases the sentiments towards the dollar again. With the US economy enjoying higher GDP growth, the greenback continues to appreciate. This increases the interest rate in the international market.

Though the theory is quite relevant and backed by some logic, the economy is extremely volatile. So only time will tell how definite the Dollar Smile theory is in the future.

[wp_quiz id=”97467″]
Categories
Forex Course

194. Introduction To The US Dollar Index (USDX)

Introduction

The U.S. dollar index is referred to as a measure of the value of the U.S. dollar, which is relative to the value of a series of currencies that are the most important trading partners of the country. The USDX is similar to other forms of trade-weighted indexes that also use the exchange rates from the leading currencies.

U.S. Dollar Index – A Brief History

In the year 1970, the U.S. Dollar Index switched between 80 and 110. This was the time when the U.S. economy was witnessing recession and rising inflation levels. With the Federal Reserve increasing interest rates to cut inflation, money flowed into the U.S. dollar, resulting in a rise in the USD index. In February 1985, the USD Index hit 164.720; this is the highest it has ever been.

However, this caused significant issues for the U.S. exporters whose goods were no longer competitive internationally. Subsequently, strong actions were taken by the U.S. government to make the currency more competitive, with five nations agreeing to manipulate the U.S. dollar in the forex markets.

This made the Dollar Index dropped by 51% over the course of four years. Since that time, the index has tracked the performance of the economy as well as liquidity flows.

Fundamentals of U.S. Dollar Index

This index is presently calculated by factoring in the exchange rates of six leading world currencies, including Euro (EUR), British Pounds (GBP), Canadian Dollar (CAD), Swiss Franc (CHF), Swedish Krona (SEK), and Japanese Yen (JPY). The biggest component of this index is the EUR, which accounts for approximately 58% of the basket. The weights of the rest of the currencies in the index include –

  • GBP (11.9%)
  • JPY (13.6%)
  • SEK (4.2%)
  • CAD (9.1%)
  • CHF (3.6%)

What Impact The Price Of The USD Index?

The USD Index is primarily impacted by the demand for and the supply of the U.S. Dollar. Related currencies of the baskets are also an important factor. These factors impact the price of each pair of currency in the formula that is being used to calculate the value of the U.S. Dollar’s value. The demand and supply of currencies are determined by monetary policies.

In the upcoming course lessons, we will be learning more about the US Dollar index. So, stay tuned. Please take the quiz below before you go. Cheers.

[wp_quiz id=”97429″]
Categories
Forex Fundamental Analysis

NZD/USD Global Macro Analysis – Part 3

NZD/USD Exogenous Analysis

To effectively compare the US and the New Zealand economies, we will conduct exogenous analysis using the following fundamental aspects;

  • The US and New Zealand balance of trade difference
  • GDP growth differential in the US and New Zealand
  • The US and New Zealand interest rate differential

The US and New Zealand balance of trade difference

A country’s participation in international trade tends to determine the demand for its domestic currency. If a country is a net exporter, its currency will be in high demand in the forex market, increasing its value against other currencies.

In October 2020, New Zealand’s trade deficit was NZD 500 million compared to the US trade deficit of $63.1 billion. Although New Zealand’s trade deficit is improving, it is still lower than the balance of trade in January. On the other hand, the US trade deficit has been widening throughout the year. The difference between the two countries’ balance of trade is the trade deficit differential. Based on its correlation with the price of the NZD/USD pair, we assign a score of 4.

GDP growth differential in the US and New Zealand

GDP growth differential is the difference between the rate at which the US and New Zealand economies are expanding. It will help to show which economy is growing at a faster pace hence impacting the exchange rate between the two countries. A country whose GDP is expanding faster will enjoy favorable domestic macroeconomic conditions. Hence its currency will appreciate.

In Q3 of 2020, the New Zealand GDP contracted by 12.2% while that of the US expanded by 33.1%. That represents a GDP growth rate differential of 45.3%. If this trend continues, we should expect that the USD will strengthen against the NZD hence a bearish NZD/USD pair.

Based on our correlation analysis, we assign the GDP growth differential between the US and New Zealand a score of -4.

The US and New Zealand interest rate differential

The interest rate differential is the difference between the prevailing interest rates in New Zealand and the US. The country with a higher interest rate tends to attract more capital, inceasing the value of its currency.

At the onset of the coronavirus pandemic, the Reserve Bank of New Zealand cut its official cash rate from 1% to 0.25%. During the same period, the US Federal Reserve cut the interest rate from 1.75% to 0.25%. Presently, the interest rate differential in NZD/USD is 0%.

Based on the correlation with the price of the NZD/USD pair, we assign a score of 1.

Conclusion

The NZD/USD pair has an exogenous score of 1. That means we should expect that the pair will continue on a mild bullish trend in the short-term. Note that this trend is also supported by technical analysis.

As seen in the above 1-week chart, the NZD/USD has successfully breached the upper Bollinger band indicating bullish momentum. This supports our fundamental analysis, as well. All the best.

Categories
Forex Fundamental Analysis

NZD/USD Global Macro Analysis – Part 1 & 2

Introduction

The global macro analysis of the NZD/USD pair will involve the endogenous and exogenous analyses of the US and New Zealand economies. The endogenous analysis will focus on domestic macroeconomic factors that drive the economy. The exogenous analysis will focus on economic indicators that comprehensively compare both the US and New Zealand economies.

Ranking Scale

Both the endogenous and exogenous factors will be ranked on a scale of -10 to +10. A negative ranking for the endogenous means that the factor had a negative impact on either the currency, while a positive ranking had a bullish impact on the currency.

Similarly, when the exogenous factor is negative, it has a bearish impact on the currency pair, while a positive ranking means it had a bullish impact.

Summary – USD Endogenous Analysis

From the above table, a clear deflationary effect can be seen on the USD currency and implies that USD has depreciated in its value since the beginning of 2020. For the complete USD Endogenous Analysis, please check here.

Summary – NZD Endogenous Analysis

The NZD endogenous analysis has a total score of 4. This shows that the NZD appreciated in 2020.

  • New Zealand Inflation Rate

The CPI is the most commonly used measure of inflation in New Zealand. Here are the top categories included in the CPI: Housing with a weight of 24.2%; food and non-alcoholic drinks 18.8%; transportation 15%; recreation 9.4%; alcoholic drinks 7%; clothing, household goods and services, health, and education all have a combined weight of 18.2%.

In September 2020, New Zealand CPI increased by 0.7%. Based on the correlation with the GDP, we assign a score of -1.

  • New Zealand Unemployment Rate

This rate shows the number of New Zealand’s working population out of work and actively looking for gainful employment. As an economic indicator, it can be used to show the economy’s ability to add new jobs to the market.

In Q3 of 2020, the New Zealand unemployment rate increased to 5.3% from 4% in Q2. This shows that the labor market is yet to recover from the economic shocks of the coronavirus pandemic. Based on correlation analysis, we assign a score of -5.

  • New Zealand Manufacturing PMI

This is an index that measures the growth in the manufacturing sector in New Zealand. It is a composite of new orders, employment, inventories, and orders delivered from the manufacturing sector. When the index is above 50, it means that the manufacturing sector in New Zealand is expanding. The sector is seen to be contracting when the index is below 50.

In October 2020, the index declined to 51.7 from 54. However, the index is above the pre-coronavirus levels. That implies the manufacturing sector is recovering swiftly. Based on the correlation analysis with GDP, we assign it a score of 3.

  • New Zealand Business Confidence

In any economy, business confidence goes hand-in-hand with business confidence. In New Zealand, the business confidence index is based on a survey of about 700 businesses. The index is the difference between the number of businesses that anticipate economic improvements and those that expect the economic conditions will decline. The index covers export intentions, profit expectations, employment intentions, activity outlook, and capacity utilization.

In November 2020, the ANZ Business Confidence was -6.9 compared to -15.7 in October. Although in the negative territory, the November reading is the highest since September 2017. This shows that more businesses are becoming optimistic about the future operating environment, mostly thanks to the aggressive expansionary monetary and fiscal policies.

Based on correlation analysis with the GDP, we assign ANZ business confidence a score of 4.

  • New Zealand Retail Sales

In New Zealand, retail sales data is aggregated quarterly. It measures the change in the value of goods and services purchased by households. Remember that consumer expenditure is the main driver of economic growth, which makes the retail sales data a leading indicator of GDP growth.

In Q3 of 2020, the New Zealand retail sales increased by 28% from a drop of 14.6% and 1.2% in Q2 and Q1, respectively. The 28% increase is the largest quarterly increase in 25 years. The YoY retail sales increased by 8.3% in Q3 compared to a 14.2% drop in Q2. Based on our correlation analysis, we assign the New Zealand retail sales a score of 6.

  • New Zealand Consumer Confidence

In New Zealand, consumer confidence tends to correlate with households’ willingness to spend in the economy. The Westpac McDermott Miller Consumer Confidence Index gauges the optimist of New Zealand households regarding the economy. The index covers households’ views on their finances, purchases in the economy, and the overall economy.

A score of above 100 shows an increasing level of optimism, while below 100 shows increasing pessimism.

In Q3 of 2020, the New Zealand consumer confidence index dropped to 95.1 from 97.2 in Q2 and 104.2 in Q1. Q3 reading is the lowest in New Zealand since 2008. Based on its correlation with GDP, we assign a score of -4.

  • New Zealand Government Net Debt to GDP

Gross national Debt to GDP helps both local and foreign creditors gauge a country’s ability to service its debt. This indicator shows the level at which the domestic economy is leveraged. A lower ratio is preferable since it means that the country has a higher GDP compared to its debt. This means that it can be able to access cheap debt in the future.

In the 2018/2019 fiscal year, the New Zealand government debt to GDP dropped to 19% from 19.6% in the 2017/2018 fiscal year. In 2020, the New Zealand government debt to GDP is projected to increase to 27% on account of the government’s aggressive spending to ease the economic pressure from the coronavirus pandemic. Based on correlation analysis with GDP, we assign New Zealand government debt to GDP a score of 1.

In the very next article, let’s analyze the exogenous indicators and forecast if this currency pair seems to be bullish or bearish in the near future.

Categories
Forex Fundamental Analysis

USD/CHF Global Macro Analysis – Part 1 & 2

Introduction

When conducting the global macroeconomic analysis, endogenous and exogenous factors are considered. These analyses can be used to explain the price dynamic of a currency pair. In this case, we will analyze the endogenous factors that drive the economy in the US and Switzerland. We will also analyze the exogenous factors that primarily drives the price of the USD/CHF pair.

Ranking Scale

A sliding scale from -10 to +10 will be sued to ranks the impact of the individual endogenous and exogenous factors on the currency. A negative ranking for the endogenous factors means that they had a depreciating impact on the individual currencies, while a positive ranking means they resulted in currency appreciating.

Similarly, a negative ranking for the exogenous factors implies that they’ve had a bearish impact on the currency pair, while a positive ranking means they’ve had a bullish impact.

Summary of USD Endogenous Analysis

From the above table, we can see a clear deflationary effect on the USD currency and implies that it has depreciated in its value since the beginning of the year. You can find the complete USD Endogenous Analysis here.

Summary of CHF Endogenous Analysis

Overall, the endogenous analysis of CHF has a score of -5. That implies that the CHF is expected to have depreciated marginally in 2020.

  • Switzerland Inflation Rate

The rate of inflation is used to measure the changes in the price of consumer goods in Switzerland over a specified period – usually monthly or yearly. Here are the components of the CPI in Switzerland: Housing and energy, which accounts for 25% of the total CPI weight; 16% for healthcare; Transport accounts for 11%; Food and non-alcoholic drinks 11%; hotel and restaurant services 8%; 4% for Household goods and services; and clothing 3%. Education, communication services, and alcoholic beverages cumulatively account for 7% of the total CPI weight.

In November 2020, the YoY CPI in Switzerland dropped by 0.7%, while the MoM CPI dropped by 0.2%. The fall in prices of the hotel and holiday packages contributed to the drop in the inflation rate. The Switzerland CPI is at the lowest point since January 2018.

Based on our correlation analysis, we assign the Switzerland rate of inflation a score of -3.

  • Switzerland Unemployment Rate

This economic indicator shows the percentage of the total Swiss labor force that is actively seeking a job. Note that not all unemployed portion of the working-age population are seeking employment; so, they are not captured by the unemployment rate.

The unemployment rate can also be used to show the rate at which the economy is adding or cutting job opportunities. This can be used to show economic growth.

In October 2020, the Swiss unemployment rate was 3.2%, down from highs of 3.4% in May, while the employment rate in Q3 2020 was 79.7%. Although it is higher than the 79.1% registered in Q2, it is still significantly lower than the pre-pandemic rate of 80.4%.

The Swiss unemployment rate has a high correlation with the GDP, but since it only increased marginally, we assign it a score of -2.

  • Switzerland Manufacturing PMI

The Swiss procure.ch Manufacturing Purchasing Managers’ Index surveys the executives in the manufacturing sector. The index is a measure of the Swiss manufacturing sector’s performance and serves as a leading indicator for business expectations.

The Manufacturing PMI is an aggregate of five components: new orders, which a weight of  30%, output 25%, employment 20%, supplies 15%, and inventory 10%. The manufacturing sector is expected to expand when the index is above 50 and contract when the index is below 50.

In November 2020, the Swiss procure.ch Manufacturing PMI increased to 55.2, the highest since December 2018. Based on the correlation analysis with the GDP, we assign a score of 7 since it shows a robust expansion.

The Swiss services industry employs over 60% of the working population and accounts for 73% of Switzerland’s GDP. This makes the services PMI a crucial indicator of the overall economy. The Services PMI is obtained through a comprehensive survey of 300 purchasing managers in the services sector to evaluate the changes in business activities.

The survey covers areas such as customer new orders, purchasing, and sales prices, and changes in the employment level.

In November 2020, the Swiss services PMI dropped to 48 from 50.4 in October, primarily attributed to new orders’ contraction. Although it is almost double the 21.4 recorded in April, it is still lower than the 57.3 recorded in January 2020. We, therefore, assign it a score of -4.

  • Switzerland Consumer Confidence

In Switzerland, consumer confidence is used to evaluate households’ opinion on the overall economy and their financial position. Typically, consumer confidence is higher when there is high GDP growth, and the unemployment rate is low.

In the fourth quarter of 2020, the Swiss consumer confidence was -12.8, better than Q2 -39.3. Consumer confidence is used to show the likelihood of how much households will spend in the economy. Hence we assign it a score of -2.

  • Switzerland Government Gross Debt to GDP

The Swiss government debt is the totality of the government’s amount owed to both domestic and foreign lenders. This debt is expressed as a percentage of the GDP o help determine the indebtedness of the economy. Lenders also use this metric to determine if there is a possibility of default by the government. Typically, government debt that is less than 60% of the economy is considered ideal.

In 2019, Switzerland’s government gross debt to GDP was 41%, and it’s projected to hit 49% in 2020 due to increased government expenditure to curb the economic slowdown brought about by the coronavirus pandemic. However, the Swiss government’s gross debt to GDP has been steadily declining since 2004, averaging at around 37%. Based on our correlation analysis and the fact that it has marginally increased in 2020, we assign a score of -1.

Now we know that both USD and CHF have depreciated according to their respective endogenous indicators. Please check our next article to know if this pair is expected to be bullish or bearish in the near future according to their exogenous indicators. Cheers.

Categories
Forex Fundamental Analysis

AUD/USD Global Macro Analysis – Part 3

AUD/USD Exogenous Analysis

In the exogenous analysis, we will compare the differentials in the US and the Australian economies at an international level. We will use:

  • The differential in GDP growth in the US and Australia
  • The US and Australian interest rate differential
  • The differential in the US and Australian balance of trade

The differential in GDP growth in the US and Australia

Domestically, the value of USD and AUD are pushed by the changes in the macroeconomic factors that drive GDP growth. The dynamic of the AUD/USD exchange rate is affected by the difference in the GDP growth rate. The country with a faster GDP growth will see its currency appreciate more than the one with slower growth.

In Q3 of 2020, the Australian GDP increased by 3.3% compared to the 7% drop in Q2. The US economy expanded by 33.1% in Q3 2020 compared to a 31.4% drop in Q2. In the first three quarters, the US economy has contracted by 3.3% while the Australian economy has contracted by 4%. Therefore, the GDP growth differential between Australia and the US is -0.7%. Based on the correlation analysis with the AUD/USD pair, we assign a score of -2.

The US and Australian interest rate differential

This measures the difference between the interest rate set by the Reserve Bank of Australia (RBA) and the US Federal Reserve. In the forex market, carry traders tend to be bullish when a currency pair has a positive interest rate differential and bearish when it is negative. That is because more investor funds flow towards the country with a higher interest rate.

At the onset of the COVID-19 pandemic, the RBA cut interest rates from 0.75% to 0.1%, while the Federal Reserve cut interest rates from 1.75% to 0.25%. That makes the interest rate differential for the AUD/USD pair -0.15%. Based on correlation analysis with the exchange rate for the AUD/USD pair, we assign a score of -2.

The differential in the US and Australian balance of trade

The difference between the balance of trade for Australia and the US will help determine which currency is in higher demand in international trade. Note that increased demand in the forex market also increases the value of that currency.

In October 2020, Australia’s trade surplus increased to AUD 7.46 billion compared to 5.82 billion in September. However, it is still lower than the highest recorded AUD 9.62 billion surpluses in March. The US had a trade deficit of $63.1 billion in October, which has been expanding since January. The balance of trade differential is $68.633 billion between Australia and the US. Based on the correlation with the AUD/USD exchange rate, we assign a score of 6.

Conclusion

The exogenous score for the AUD/USD pair is 2. It means that we can expect that the pair will be on a bullish trend in the short-term.

In technical analysis, the short-term bullish trend is supported by the fact that the pair is trading above the 200-period MA and breaching the upper Bollinger Band. Cheers!

Categories
Forex Fundamental Analysis

AUD/USD Global Macro Analysis – Part 1 & 2

Introduction

In the global macro analysis of the AUD/USD pair, we will look at the endogenous economic factors that drive GDP growth in both Australia and the US. We’ll also analyze the exogenous factors that affect the exchange rate dynamic between the AUD and the USD.

Ranking Scale

We will use a sliding scale from -10 to +10 to rank the impact of the endogenous and exogenous factors. When the endogenous factors are negative, it means that they resulted in the depreciation of either the USD or the AUD. When positive, it implies they resulted in the appreciation of the individual currencies. Similarly, negative endogenous factors result in a bearish trend for the AUD/USD and a bullish trend for when they are positive.

USD Endogenous Analysis – Summary

A -19.1 score on Endogenous analysis on USD implies a deflationary effect on this currency. It means that the US Dollar has lost its value since the starting of 2020.

You can find the complete USD Endogenous Analysis here.

AUD Endogenous Analysis – Summary

The endogenous factors have an overall score of 3, implying that the AUD has appreciated in 2020.

  1. Australia Inflation Rate

The consumer price index in Australia is calculated quarterly. Housing accounts for 22.3% of the total CPI weight, food and non–alcoholic drinks 16.8%, recreation 12.6%, transportation 11.6%, household goods and services 9.1%, alcohol and tobacco 7.1%, healthcare 5.3%, financial service 5.1%, clothing, education and communication 10.2%.

In Q3 of 2020, the YoY Australian CPI increased by 0.7% from a drop of 0.3% in Q2. The QoQ CPI rose by 1.6% compared to 1.9$ in Q2. Note that the Q3 CPI is marginally lower than in the pre-pandemic levels in Q1. Based on inflation’s correlation with GDP growth, we assign a score of -1.

  1. Australia Unemployment Rate

The unemployment rate is the percentage of the labor force that is actively looking for employment opportunities. The unemployment rate can be used to show the state of the economy. When high, it means that the economy is shedding jobs faster and can be said to be contracting.

In October 2020, the Australian unemployment rate was 7% up from 6.9% in September. The increase in the Australian unemployment rate can be attributed to the prolonged COVID-19 crisis. Note that during the period, the employment rate increased to 61.2% from 60.4% in September. This was mainly driven by the surge in full-time, part-time job numbers coupled with a drop in the underemployment rate to 10.4% from 11.4% in September.

From January to date, the unemployment rate has increased by 1.7% while the employment rate has dropped by 1.4%. Based on its correlation with GDP, we assign a score of -5.

  1. Australia Mining Production

The Australian economy significantly relies on mining, which accounts for up to 11% of the GDP. Australia is among the top producers of precious metals in the world. Therefore, a significant portion of the labor market is dependent on the mining sector.

The YoY mining production increased by 1.2% in the second quarter of 2020, down from a 5.1% increase in Q1. In Q3, it is projected to increase by at least 2.5% and 5% by the end of 2020. This would mean that the end of year levels would be equivalent to the pre-pandemic levels.

Based on our correlation analysis, we assign Australia mining production a score of -3.

  1. Australia Business Confidence

The National Australia Bank (NAB) surveys about 350 leading companies in Australia to establish the prevailing business conditions. Typically, the present business sentiment can be used as a leading indicator of future business activities such as hiring, spending, and investments. We can say that business confidence is a leading indicator of GDP change.

Reading above 0 shows that business conditions are improving, while below 0 shows that business conditions are worsening.

In October 2020, Australian business conditions improved to 5 from -4 in September. The October reading is the highest since August 2019. The increase was primarily driven by improvement in sentiment profitability and employment in the mining and transportation sectors.

Based on correlation with GDP, we assign a score of 8.

  1. Australia Consumer Confidence

The Melbourne Institute and Westpac Bank aggregate consumer confidence in Australia. The survey 1200 households representative of the entire households in Australia. The index is based on the five year average of these components: anticipated economic conditions, personal finances, and purchase of essential household goods. Consumer confidence is a leading indicator of consumer expenditure, which is a significant driver of the GDP.

In November 2020, the Australian consumer confidence increased to 107.7 from 105 in October. This is the highest level in 7 years, indicating that consumers are highly optimistic about the future despite the COVID-19 challenges.

Based on correlation analysis with the Australian GDP, we assign it a score of 5.

  1. Australia Government Debt to GDP

This measures the levels of indebtedness of the Australian government. Domestic and foreign lenders use this ratio to estimate the ability of the government to service its debts without straining the growth of the economy. Generally, a ratio of below 60% is considered to be ideal.

In 2019, the government debt to GDP in Australia jumped to 45.1% from 41.5% in 2018. In 2020, it is projected to reach 50%. Therefore, we assign a score of -3.

  1. Australia Retail Sales

The change in retail sales shows the trend in household expenditure on final goods and services in the economy. An increased expenditure corresponds to an increase in GDP levels.

In October 2020, the MoM retail sales increased by 1.4% compared to a 1.1% drop in September. Based on the correlation with the GDP growth rate, we assign a score of 2.

Now we know that USD has depreciated and AUD has appreciated according to their respective endogenous indicators. In the very next article, let’s see if this pair is bullish or bearish according to the exogenous indicators.

Categories
Forex Fundamental Analysis

GBP/USD Global Macro Analysis – Part 3

Introduction

The exogenous analysis will cover international aspects that impact both the UK and the US and how they influence the GBP/USD price. These factors include:

  • Good trade balance
  • Interest rate differential
  • GDP growth differential

GBP/USD Exogenous Analysis – Summary 

The score for the exogenous analysis of the GBP/USD pair is -3. This deflationary score implies that we should expect that the pair will adopt a bearish trend in the near term.

Goods trade balance

The goods trade balance is the difference between the value of goods a country imports and its exports. When the balance is negative, it means that the country is importing more than it exports. If the goods trade balance is a surplus, it means that a country’s value of exports is more than its imports.

In September 2020, the UK’s goods trade deficit increased to £9.35 billion while that of the US increased to $80.29 billion. Based on the correlation between t goods trade balance and the price of GBP/USD, we assign it an inflationary score of 2. It means if the goods trade balance keeps widening between the two countries, we can expect that the GBP/USD pair will continue being bullish.

The UK and the US Interest rate differential

This is the difference between the interest rate set by the Bank of England and the interest rate fixed by the US Federal Reserve. Capital tends to flow towards the economy with a higher interest rate since investors are bound to earn higher returns.

The BOE has set the interest rate at 0.1%, while the FED has it at 0.25%. therefore, the interest rate differential for the GBP/USD pair is 0.1% – 0.25% = -0.15%. Based on the interest rate differential, the GBP/USD pair should have a bearish trend. Therefore, we assign it a score of -3.

GDP growth differential

The actual size of the GDP varies from country to country. However, we can compare the rate at which they grow and analyse the impact of this growth rate on the exchange rate.

In the third quarter of September 2020, the UK GDP expanded by 15.5% while that of the US expanded by 33.1%. Over the years, we can observe that the US GDP growth has been at a faster rate than that of the UK. In this case, we assign a deflationary score of -2 on the UK and the US GDP growth rate differential. That means if the US economy keeps expanding at a faster rate, we can expect a bearish GBP/USD in the near term.

Our technical analysis also supports the forecasted bearish trend in the near term. Note that the GBP/USD pair has failed to breach the upper Bollinger band forming a resistance level for the past two years.

We hope you found this analysis useful and informative. Let us know if you have any questions by commenting below. All the best.

Categories
Forex Fundamental Analysis

GBP/USD Global Macro Analysis – Part 1 & 2

Introduction

To properly understand the dynamics of the price of the GBP/USD pair, we’ll conduct endogenous and exogenous analyses of the UK and the US economies.

The endogenous analysis will focus on the significant fundamental economic indicators that drive economic growth in either country. The exogenous analysis will dig deeper into how both the US and the UK economies interact with each other in terms of international trade that impact the currency exchange.

Ranking Scale

Both the endogenous and the exogenous factors that we will analyse will be ranked on a sliding scale from -10 to +10. A negative score means that the indicator resulted in currency depreciation, while a positive score implies that it led to currency appreciation.

USD Endogenous Analysis – Summary

The USD endogenous factors recorded a score of -19.1, implying a deflationary effect on the USD. This essentially means that according to these indicators, the USD has lost its value since the beginning of this year.

You can find the complete USD Endogenous Analysis here.

GBP Endogenous Analysis – Summary

The endogenous analysis of the UK economy results in an expansionary score of 2. Therefore, we could expect the GBP increased in 2020.

Markit Manufacturing PMI

This is a survey done on about 600 purchasing managers in the manufacturing industry, who rate the level of the business environment such as prices, new orders, inventories, supply deliveries, labour conditions, and production levels.

This is a leading indicator for the economy because businesses react almost instantly to the changing operating environment, and the purchasing managers have the most relevant insight. In November 202, the UK Manufacturing PMI was 55.2, showing that the economy is undergoing a sustained recovery. Due to its low correlation with the GDP, we assign an inflationary score of 3.

UK inflation

The CPI is based on a monthly survey done by the Office for National Statistics. This is done by comparing the current average of sample consumer items by the previous month’s prices. The BOE uses the data to adjust interest rates and QE levels to set inflation targets for the economy.

Rising inflation levels lead to higher interest rates, which makes CPI a vital currency valuation indicator. The UK inflation rate increased by 0.7% in October 2020 but is still lower than the rate in the pre-pandemic period. Based on our correlation analysis. We assign it a score of -4.

Manufacturing Production

It measures the change in the total value of inflation-adjusted output by the manufacturers in the whole economy. It is a leading indicator of the economy’s performance since production levels adjust quickly to the business cycles and heavily dependent on consumer conditions like employment changes and earning levels.

Manufacturing contributes about 80% of the UK’s industrial output and accounts for up to 42.4% of GDP changes. The year-on-year manufacturing production change in September 2020 was -7.9%. This marks the smallest decline since the onset of the coronavirus pandemic. Due to its high correlation with GDP, we assign it an inflationary score of 6.

Claimant count change

It measures the change in the number of people who are seeking unemployment benefits. Hence, it is the primary indicator of unemployment levels, which makes it a vital signal of consumer expenditure levels and labour market conditions. In the UK, claimant count change is considered the best measure of the employment situation, and it accounts for 30% of changes in the GDP.

In September 2020, the number of people in the UK who claimed unemployment benefits dropped by 29800. However, the unemployment rate remains at yearly highs of 4.8%. For this reason, we assign a score of -5.

Industrial Production

It measures the change in output from the mines, manufacturers, and utilities, adjusted for inflation. While manufacturing makes up 80% of the industrial production, mines and utilities make up 20%, and their effects on the real economy are thus overshadowed.

It is a significant leading indicator of the economy’s health since industrial activities correspond to labour market conditions and sensitive to business cycles. In September 2020, the UK industrial MoM production increased by 0.5%. However, on a YoY basis, it is down 6.3% from September 2019. In this case, we assign industrial production a score of -3.

Retail Sales

It measures the change in the inflation-adjusted value of all sales at the retail level in the whole economy. It is the primary measure of how much consumer expenditure accounts for most of the country’s economic activity.

In October 2020, the UK MoM retail sales increased by 1.2%, which is the 6th consecutive increase in retail sales from the slump recorded at the height of the coronavirus pandemic. Based on its correlation with GDP, we assign retail sales an inflationary score of 4.

Markit Services PMI

This is a survey on about 400 purchasing managers in the services industry, who rate the business environment using factors such as employment, new orders, pricing, inventories, and supplier deliveries. A score of above 50 signifies an expansion, while below 50 indicates a contraction in the services industry.

In November 2020, the Marking UK Services PMI was 45.8 – a significant drop from 51.4 in October. Although the Services PMI has increased from the April lows, it is still lower than in January 2020. Combined with its low correlation with the UK GDP, we assign a deflationary score of -3.

United Kingdom Public Sector Net Debt to GDP

This is also called Government Debt to GDP Ratio. Most investors, bilateral and multilateral lenders use this ratio to determine a country’s ability to service any debt they take on. Naturally, when the ratio is higher, it means that the government is piling on more debt, but the GDP is not increasing at the same rate. Since higher GDP would mean higher sources of revenue, if the GDP is not increasing at the same pace as the amount of debt, it implies that the government might struggle with debt repayment.

In 2020, the UK Public Sector Net Debt to GDP is projected to reach historic highs of 96.6%. This increase is mainly attributed to governments’ efforts to prop up the economy through aggressive expansionary policies during the pandemic. Based on our correlation analysis, the increase in the United Kingdom Public Sector Net Debt to GDP in 2020 served its purpose to avoid irreversible recessions. We, therefore, assign an inflationary score of 4.

In our next article, we will analyze the Exogenous factors of both USD and GBP to come to an appropriate conclusion.

Categories
Forex Fundamental Analysis

USD/CAD Global Macro Analysis – Part 3

Introduction

The exogenous analysis for the USD/CAD pair will involve analyzing factors that significantly contribute to these two currencies’ interaction. Remember, when trading forex, you are trading a currency pair, which means you buy one currency and sell the other. With exogenous analysis, you get the bigger picture regarding the currency pair as a whole. In a sense, the exogenous analysis compares how the endogenous factors between the US and Canadian economies net against each other.

For the exogenous analysis, we’ll focus on:

US and Canadian Interest rate differential

Interest rate differential is the difference between the interest rates in the US and Canadian. When the interest rate in one country s higher than the other, investors will pull their funds from the country with the lower interest rate to invest in high yielding securities in the country with the higher interest rate.

Canada’s interest rate has for most of the year been higher than that in the US. We, therefore, expect that from March 2020, the USD weakened against the CAD. However, since the current interest rate differential is 0%, going forward, we do not expect that it will play a significant role in determining the value of the USD/CAD pair. Hence, we assign it a neutral score of 0.

GDP Growth Differential

A country’s GDP growth is mainly propelled by growth in international trade. Therefore, when the GDP expands, we can expect that the country is becoming a net exporter. That means the demand for its currency increases in the international market, which also increases its value.

Over the years, the Canadian GDP growth rate has outpaced that of the US. However, in the third quarter of 2020, the US GDP growth rate outpaced Canada by 23.1%. Based on our correlation analysis between the GDP differential and the USD/CAD pair, we assign an inflationary score of 2. If this trend continues, we expect a future strengthening of the USD against CAD.

Differences in Trade Balance

The balance of trade helps to show the trade deficits that a country operates in the international market. The trade deficit widens as the country consistently becomes a net importer. Furthermore, the trade deficit can also widen if the value of the goods exported by a country drops while the value of imports increases.

From April 2020, the Canadian trade deficit has been widening as compared to that of the US. In October 2020 data release, the Canadian trade deficit widened by CAD 3.25 billion while the US trade deficit widened by $3.1 billion. Due to its high correlation with the USD/CAD pair, we assign the difference in trade deficit an inflationary score of 3. If this trend persists, we expect it to result in bullish USD/CAD.

Conclusion

Based on the exogenous analysis, the USD/CAD gets an inflationary score of 5. It implies that if the current trend of the exogenous factors persists, we can expect a bullish trend for the USD/CAD pair in the near term.  Now that we know the trend, we can use technical analysis to find accurate entries and exits in this currency pair while keeping the bullish trend in mind.

From the exogenous analysis of the USD/CAD pair, we have observed that the pair is expected to adopt a bullish trend in the near term. Let’s see if this is supported by technical analysis. In the below weekly chart, we can see the pair bouncing off a 2-year support line and from the oversold territory of the Bollinger Bands. This indicates a clear bullish trend in the near future. 

We hope you found this analysis informative. Please let us know if you have any questions in the comments below, and we would love to address them. Cheers.

Categories
Forex Fundamental Analysis

USD/CAD Global Macro Analysis – Part 2

CAD Endogenous Analysis – Summary

The Canadian endogenous factors recorded a score of -11.5, implying a deflationary effect in the CAD as well. This means that according to the Fundamental indicators, the CAD has also lost its value since the year began, but not as much as the USD.

Unemployment Rate

The unemployment rate measures the number of people who do not have jobs and are actively seeking gainful employment. The unemployment rate is used to show business cycles and economic growth because when businesses expand, the demand for labor is higher when the economy is undergoing a contraction, the demand for labor decreases, and the unemployment rate increases.

In October 2020, the Canadian unemployment rate was 8.9% down from the historic highs of 13.7% registered in May 2020. The rate is still higher than the 5.6% average before the onset of the coronavirus pandemic.

Based on our correlation analyses, the Canadian unemployment rate gets a score of -6. It means that in 2020 the unemployment rate has a deflationary impact on the CAD.

Canadian Rate of Inflation

The Canadian CPI is a weighted average of the following categories: Shelter 27.5%, Transportation 9.3%, Food 16.1%, household operations 11.8%, education and recreation 11.8%, clothing 5.7%, health and personal care 5%, and alcohol and tobacco 3%.

The CPI target in Canada is 2%. The Bank of Canada uses monetary policy to maintain inflation within the target range of 2%. An increasing rate of inflation is positive for the CAD.

In October 2020, the annual inflation rate in Canada rose to 0.7 from lows of -0.4 in May 2020, but still below the 2.4 recorded in January.

We assign the Canadian rate of inflation a score of -7, meaning it had a negative impact on the CAD.

Canada Industrial production

Industrial production is used to measure the output from manufacturing, mining, and the utility sectors in Canada.

In August 2020, the industrial production in Canada declined by 9.04%. Based on our correlation analysis of the Canadian industrial production and GDP, we assign it a deflationary score of -5.

Manufacturing sales

The Canadian manufacturing sales measure the value changes in the output from the manufacturing goods in the economy. It can be used to measure the short-term health of the manufacturing sector and, by extension, the health of the overall economy.

In September 2020, the manufacturing sales were worth CAD 53.8 billion, representing a 1.4% increase from August. However, manufacturing sales are still 3.6% below the pre-coronavirus period.

Based on the correlation analysis with the Canadian GDP, we assign an inflationary score of 3 to the manufacturing sales.

Retail sales

The Canadian retail sales data measures the total value that households spend on purchasing goods and services for direct consumption. This value is adjusted for inflation.

Consumption by households accounts for up to 78% of the Canadian GDP. Changes in the retail sales data can be used as a leading indicator of the welfare of households. Higher retail sales imply increased demand in the economy hence higher manufacturing and lower unemployment rates.

The retail sales in September 2020 steadily increased by 1.1% from lows of -26.4% in April. Based on the correlation analysis with the GDP, we assign retail sales a score of 6.

Government debt to GDP ratio

In 2019, Canada’s public debt to GDP was 88.6, representing a 1.26% decline from 89.7 registered in 2018.

In 2020 the government debt to GDP in Canada is expected to rise due to the various stimulus packages necessitated by the coronavirus pandemic. However, based on the past correlation analysis with GDP, we assign a marginal deflationary score of -2 on Canada’s government debt to GDP ratio.

Canada housing starts

The housing starts indicators track the number of new residential buildings that begin construction. It is used as a leading indicator of the demand in the real estate market and demand in the housing market.

In October 2020, the housing starts in Canada were 214,875 units. Based on the correlation analysis with the GDP, we assign Canadian housing starts an inflationary score of 2.5.

Canada Government Budget Value

This indicator measures the value of the Canadian budget in terms of surplus or deficit. It takes into account the difference between revenues collected and the expenditures by the government. The government budget value doesn’t include public debt.

As of August 2020, the Canadian budget deficit was CAD 21.94 billion. Revenue collected by the government during the month dropped by CAD 1.3 billion, while expenditures increased by CAD 42.92 billion due to COVID-19 response measures.

Based on its high correlation with the GDP, we assign a deflationary score of -6.

Business confidence

In Canada, business confidence is measured by the Ivey Purchasing Managers’ Index (PMI). It measures the business expectations and operating environment from the perspective of an operating panel of purchasing managers from both private and public sectors across Canada.

The Ivey PMI focuses on supplier deliveries, purchases, employment, inventories, and prices. Values over 50 imply expansion while below 50 implies contraction.

The Ivey PMI reading for October 2020 was 54.5, indicating expansion. From our correlation analysis, we assign Canadian business confidence an inflationary score of 3.

In our next article, we will analyze the Exogenous factors of both USD and CAD to come to an appropriate conclusion.

Categories
Forex Assets

The Role of the United States Dollar Index in Forex Trading

The US Dollar Index is something that you often see mentioned around the trading world, if you haven’t seen it mentioned then it probably won’t be long until you do. If you haven’t, then it would be a good idea to get to know a little more about it, the US Dollar Index is a great tool that can help you to confirm if there is a directional bias for the currency pair that you are currently trading, it can also help to warn you of awesome potential barriers to your trade before you decide to place the trade.

The Federal Bank in the US is one of the more important central banks in the world, the US dollar is also one of the most traded currencies in the world making up to 70% of all transactions each day, so being able to have an idea of what the Dollar is doing on any day will give you a huge advantage for your trading and you as a trader, and that is exactly what he US Dollar Index will help us do.

So what exactly the US Dollar Index? It started back in 973 for the value of 100.000. In 1985 the USDX (US Dollar Index) traded for as high as 164.7200 and then on March 16 2008, it dropped as low as 70.698. So the USDX can range quite a bit moving both up and down, the ranges are often quite large having large trends. However, this is not always a guarantee and so this is why it should be used as an indicator only instead of as an actual trading tool to make trades.

The USDX is basically a measure of the US dollar in relation to a basket that will contain a number of the most important trading partners for the US. The basket has six different foreign currencies within it, with each currency having a different weighting due to the size of the country or countries using the currency, for example, the Euro has 23 different countries within it and so it is weighted slightly higher than a smaller one such as the Swiss Franc. The largest part of the USDX is made up of the Euro which currently weighted at 57.6%. The following currencies are included in the USDX:

  1. The Euro (EUR), 57.6% weight
  2. The Japanese Yen (JPY), 13.6% weight
  3. The Great British Pound (GBP), 11.9% weight
  4. The Canadian Dollar (CAD), 9.1% weight
  5. The Swedish Krona (SEK), 4.2% weight
  6. The Swiss Franc (CHF) 3.6% weight

So it is clear that the value of the USDX is influenced quite heavily by the Euro, this is one of the clues as to why the USDX will be useful for us as traders when it comes to making trading decisions.

The USDX can actually be seen as a kind of anti-euro indicator, due to the Euro having such a high weighting on the USDX, it means that there is a kind of negative correlation between the two. When the Euro falls the USD will generally rise, and when the Euro rises the USDX will generally fall. Knowing this can mean that we are able to use the USDX as an indicator for the potential movement of the EUR/USD pair. 

The USDX can also be seen as a guide for the direction of the USD traded against pretty much any pair. When you trade a currency pair that has the USD in it, it will be guided by the USDX. If the USD is the base currency within a trading pair, then the USDX and the currency pair will typically move in the same direction. If the USD is the quote currency (second currency) then the USDX and the currency peri will often move in the opposite direction.

There is something known as the smile theory, this is basically a good way of mentally remembering the three different ways that the dollar responds to different situations. It is called the smile theory because the three different situations create the shape of a smile. On the left of the smile at the top, we have the USD strength that is formed when the global economy is starting to struggle. The bottom part of his smile is where the USD depreciated on something known as a dovish feed. The right side of the smile, the right upper part, is when the USD gains value on something known as a hawkish feed and risk on the environment. This then creates a smile like a graph. The smile theory allows you to get an overall picture of understanding where the dollar is at present and what is likely to happen next.

If you manage to get into the habit of looking at the US Dollar Index prior to making any trades, it gives you another indication of what could happen and could also be used as an additional confirmation for your trades. As with anything in trading, nothing is a guarantee, you cannot rely on the USDXto show you the exact direction or exactly what any currency or currency pair will do, simply use it as an indicator and nothing more. It can be quite a powerful tool and can really give you a little edge when trying to work out the potential direction and bias of the markets, so it is a good idea to get to grips with how it moves and how it works in order to implement it into your own trading analysis.

Categories
Forex Course Forex Daily Topic

160. What are Currency Crosses and Why Should You Trade Them?

Introduction

Currency crosses are currency pairs from major and commodity currencies eliminating the US Dollar. Trading cross currency pairs require knowledge of the two countries’ economic conditions, which is not related to the USA.

Major Vs. Cross Currencies

More than 80% of the forex market transactions happen through the US Dollar as it is the reserve currency in the world. Most of the commodities and agricultural products are valued in US dollars.

Therefore, if we want to buy something from a country, we should exchange the currency into the US Dollar to make the transaction. As a result, most of the countries keep the US Dollar as the reserve currency. In particular, China, Japan, and Australia are the largest importer of oil; therefore, they keep a vast number of US Dollars in their central banks.

Because of the massive demand for the US dollar, major currency pairs have a higher trading volume, allowing it to have a decent movement. On the other hand, if we eliminate the US dollar from the major currencies, we will find cross pairs, which is also profitable.

Why Trade Currency Crosses?

Instead of trading at major Dollar based currency pairs, we can profit from trading cross pairs. The most significant features of cross currency pairs are that they are not bound to US Dollars and can make a decent move without any intervention of the US economy.

As a result, many traders trade in currency crosses to diversify their portfolio. Cross pairs can make a decent movement, while dollar-based pairs remain corrective. At that time, it is better to go with the moving market than sit back and watch the corrective price.

Moreover, trading cross pairs might be profitable if the trading session is favorable. For example, we can profit from the GBPJPY pair at Asian and London sessions rather than trading in the US session.

Summary

Based on the above discussion, let’s point the core parts of cross-currency trading:

  • Cross currency trading is similar to major currency trading.
  • There is no US dollar in cross currency pairs.
  • Cross currencies are from major and commodity currencies.
  • Cross currency pair can make a decent move without US session.
[wp_quiz id=”86453″]
Categories
Forex Assets

The FX Problems with the USD: Yesterday, Today & Tomorrow

As one of the major currencies on the globe and a currency that holds such importance for the rest of the world, the USD has always posed as a topic everyone is interested in. Due to these reasons, it is crucial that we understand the economic situation worldwide and grasp which role the official currency of the United States of America has to play. Currently, we are seeing many changes in various aspects of existence as we know it and, despite the vastness of the media sources, many are still vague or unsure about what is going to happen down the road. Naturally, it is essential for these reasons to delve into the knowledge we have accumulated so far both on the USD and its connections to other spheres of life, discuss its relevance outside the realm of forex, and, last but not least, list some of the most thought-provoking predictions proposed by prominent prop traders in the market.

From the perspective of technical analysis, we are safe to state that the USD is one of the most difficult currencies to trade. Generally, the currency is often portrayed as such owing to the involvement of the big banks that have a tendency to flock towards the greatest concentration of money. As the USD is the currency of preference among traders across the globe, the big banks, understandably, desire to maintain more control over the USD-based currency pairs. What is more, since currencies are always traded one against the other, the USD as the currency encumbered with more news events is often going to bear the responsibility of whether the currency pair goes up or down.

In the past, we have seen how the USD frequently acted as a determinant of which direction the pair it is part of is going to take and both news and banks play a major role in how this typically plays out. In addition, history has shown how any event taking place in the United States appears to have an impact on the rest of the planet and, as such, they assign more importance to the USD over any other currency. The USD is also known as a safe-haven currency towards which people of various backgrounds are naturally driven. This currency is additionally the world’s reserved currency and countries all over the world tend to hold the dollar as a hedge to protect their systems.

Trading the USD is a particularly important topic due to the vigilance of the big banks and increased risk for the traders. Forex experts generally advise traders to apply the same strategies as with any other currency but also insist on exercising caution especially early on. Should traders with more experience show interest in trading a USD-based pair, they are advised to proceed with the use of their tested systems and combinations, whereas forex beginners are warned about the possibility of facing some unfavorable circumstances dissimilar to any other currencies. It appears that most traders face challenges with the USD. In addition, as it appears, many end up losing everything because of a deadly combination of negative factors: highly risky currency, poor money management, and lack of knowledge on trading psychology. Therefore, when trading the USD, it is important to involve a variety of skills and maintain awareness of other factors that can potentially affect the trade.

When trading the USD, or any other currency for that matter, most traders focus all of their energy and attention on the offense in the attempt to extract the greatest possible amount of money from the market. However, on the other end of the spectrum, there is defense as an equally important determinant of the success a trader can experience. Many assume that the acquisition of skills, tools, and systems will render them the most accomplishments in this world, but even the best technical traders can experience a great loss if they fail to grasp the need to see both sides of the coin. The defensive part of the strategy is, at times, probably less exciting, yet it is at the same time the necessary addition to the offense, complementing and rounding out the comprehensive approach every trader needs to be take in trading currencies. 

Upon learning about money management, trading psychology, and technical analysis, as the three pillars of offense, traders are left with the additional task of figuring out how to hold the fort on the other end of the continuum. Long-term defense strategies that any forex enthusiast should list as a top priority include the diversification of money and protection from a major economic downturn. If a trader manages to assemble the two constituent parts and put effort into satisfying both criteria, success is guaranteed no matter what events are taking place in the market. By following these pieces of advice, challenges can be successfully mitigated with even difficult currencies such as the USD.

The next level of trading involves the questions of what happens to any trader’s money once a trade is completed, what is in the cards with regard to the future of investment, and which plan of action a trader has developed to further conquer new goals and/or challenges. Some forex experts greatly criticize the financial news sources, despite their popularity and presence, in relation to their ability to give information on world economics. Sources such as CNBC and Bloomberg are some of the most prominent sources of financial-related information, yet forex connoisseurs claim that these companies always seem to be bullish on the economy because they are paid to maintain this positive flair by various sponsors. Banks, companies selling financial products, and brokerage firms are some examples of sponsors who have an interest in maintaining and preserving a positive outlook on the market regardless of what is currently happening.

While these sources do provide correct facts or numbers, traders still need to consult with some other sources to obtain additional information and get the full picture, as some theories or pieces of information can never be found in the mainstream media. The sources providing information on gold, for example, provide an excellent sample of how detailed and useful the media can be, as they are both bearish on the economy but they still give out real and relevant data. In order for traders to have a good defense, they need to see beyond biased media and get as much information as possible to see the whole picture.

In order for any trader to play defense in trading the USD, the information on the status of this currency as a safe-haven, the reserved currency of the world is extremely important. US citizens, for example, rarely diversify their money, which can be particularly dangerous in times of recession that are simply unavoidable. Recessions are a recurring theme in any market that preserve the overall health of the economy. As we can see from the table below, recessions always happen, sooner or later, lasting for a minimum of one year and usually a few years apart (see the number within brackets). Now, more than a decade after the last recession, we are witnessing the major impact the COVID-19 pandemic had on the world economy, putting more stress on the importance of learning how to protect one’s finances thoroughly.

Recessions in the United States
1953—1954 (4) 1980 (5)
1957—1958 (3) 1981—1982 (1)
1960—1961 (2) 1990—1991 (7)
1969—1970 (8) 2001 (10)
1973—1975 (3) 2007—2009 (6)


While the results of any recession can be truly devastating, it is important to note how the forex market is practically impervious to their damaging effects owing to the fact that fiat currencies simply have no intrinsic value. As traders in the spot forex market trade one currency against the other, what they can expect is for the market conditions to potentially dictate whether a currency pair goes up or down. The profit, however, is not something traders need to be concerned with in these cases, as the negative state of the market does not affect trading in this manner, especially if the ones doing the trade are knowledgeable and experienced in terms of trading currencies. While this is a trait unique to the forex market, it is vital that traders understand that as long as the trade is shielded from the damaging effects of a recession, they are not. 

Many traders are quite diligent and well informed with regard to the variety of methods of earning money and their financial endeavors may often range between stock, bonds, IRAs, real estate, and businesses to trading currencies. With the increased number of sources of money, traders understand that even if stocks decrease in value, bonds may go up, which understandably brings them a heightened level of security. Therefore, from a financial standpoint, traders feel fully covered because they have secured financial income from multiple sources that can bring them profit. Nonetheless, this plethora of revenue streams may still not be an indication that traders are sufficiently diversified, and the lack of understanding of what proper diversification means can potentially endanger all trader’s efforts.

When we compare all sources of income listed above (e.g. stocks, forex, etc.), there is one shared characteristic, or one common trait, that makes the difference in terms of diversifications – the means of payment. When a trader receives compensation for all his/her business endeavors in one single currency, they are likely to suffer from any external factor that affects the currency in question. This is a particularly important topic for the United States, whose currency has never truly depreciated to the extent of the question of its stability to arise. While the currency fluctuated up and down as part of its natural tendency, it thus never raised concerns that would propel the US citizens to truly think of the need to diversify the list of currencies they rely on. 

While the USD is still perceived as a safe-haven or reserved currency, the period of its glory may be slowly (or not so slowly) coming to an end as the hierarchy in terms of production and finances is changing on a global scale. Although the USD has not lost its position as the strongest currency, we have seen how risky certain situations concerning the US economy and currency were in the past 10 to 15 years, when the US government took extreme measures in order to preserve the stability. In each of such difficult stances in history, the US would typically decide to print more money, making it the only country on the planet to rely on quantitative easing as much.

As an extreme method of boosting the economy, the time may come when all dues may have to be paid eventually in this respect, which will in effect have quite terrible effects on anyone who has ever put his/her hopes in the USD alone. Coupled with the past moves of the US against other world countries in the attempt to dominate or maintain its strength, we can expect them to use every opportunity to get themselves out of the inferior position. While from the perspective of history many such wars were carried out through the involvement of the military, we are starting to see a new form of battles taking place on the financial plane.

Whether any decision the US has made in the past can ricochet right back and affect anyone involved or not, we can all agree that taking necessary precautions is very much a need today. While extending your portfolio to other business deals and endeavors is most definitely a favorable decision, long-term your finances do depend on the diversification of the currencies you depend on in the sense of remuneration. As the US is known for its tendency to hold one currency and traders are very much accustomed to enjoying the stability of the currency, the best choice to be made in this case is to include other currencies as well. Traders should, then, discover another currency on which they are long-term bullish and use them to half the risk that comes with putting all eggs into one basket. Some forex experts for example state that gold, as well as silver, is another extremely useful way to protect oneself from limiting options a single currency brings.

Generally, the precious metals market has proved to bring more benefits and one can compare them to stable coins from the crypto market, while the downside is quite small. The crypto market too is said to have an amazing upside and can help a trader stop depending on the USD, or any other currency alone for that matter. Therefore, if traders rely on other currencies as well, hold metals, and invest in cryptocurrencies as well, they both protect themselves and reduce the downside of trading/holding one currency alone.

With regard to where a trader should invest his/her finances, we can compare some events currently taking place with some of the forex experts’ views. The EUR, for example, may not be a good option because many countries are now making decisions to leave the European Union and, interestingly enough, EUR/USD may be one of the worst pairs to trade out of all 28 combinations with 8 major currencies. Moving towards another European country, the United Kingdom also proves to inspire little confidence in forex traders, as many believe that the downside of investing long-term in the GBP is too great at the time.

The AUD is another currency with a poor long-term outlook for investment due to the reduced exchange between Australia and China, poor housing market conditions, and the expectation of the economy to enter recession soon, supported by the facts and numbers given in some alternative sources other than mainstream media. In terms of economy, the NZD successfully withstood the last elections, which only confirms the health of the currency and the country’s economy, yet experts still are still doubtful with regard to investing in the currency, alike in the JPY. The Canadian political climate seems not to be pro-money at the moment, which is the last of the currencies that traders should not consider in terms of long-term investment. 

One of the most prominent forex personalities shared that he used to hold the following three currencies: the USD as his homeland currency, the CHF due to the unique neutrality and banking system in Switzerland, and the CNY because of the country’s continuous efforts to improve their economy. He also shared that he decided to invest his finances into other currencies as well, so he kept asking the question of which currencies he is bullish on. While making the decision where to put his money, the question of which countries represent the values that are reflected in their official currencies arose. At the same time, he started to notice how both rich people and big companies all shared the same inclinations to move from the West and turn to countries that have fewer taxes, serve as a nice place to live, offer a great business climate, and avoid liber politics that are believed to be damaging for the world of finance. This forex expert also shared how he eventually decided to split the amount of money invested in the CNY and allocate the second half in the RUB, since he strongly feels that Russia is on a good path, in addition to some smaller countries’ currencies due to their budding markets.

Forex experts are slowly revealing their beliefs that the world power is shifting to the East, supporting their view with the facts regarding some events that are already taking place. We are seeing a strong determination of many countries in the East to purchase precious metals, reflecting a significant gold-buying program that may reveal more than a desire to grow a country’s capital. Russia, China, Iran, and Azerbaijan significantly increased their gold reserves, while India showed a greater interest in silver for its central reserves. As quite a pricy move, the purchase of precious metals is rather interesting, especially on such a large scale involving so many countries. What is more, we know that precious metals are indeed precious for their intrinsic value and are unlikely to depreciate in value, especially since their supplies are limited. In the case of a currency war, currencies would be the first in line to drop in value as a result of a poor economic downturn, whereas any country with heavy reserves of precious metals would not only be safe but could easily move the center of power in its direction.

With such a massive move towards precious metals that is noticeable in several countries, the lessons are there for the taking. If wealthy people and countries having more money than any forex trader can ever imagine are deciding to start buying gold to this extent, why should forex traders refrain from making the same move themselves? What is more, precious metals are always a good commodity to have regardless of exterior factors and current circumstances. Nevertheless, especially now, at these uncertain times, holding precious metals can be perceived as a smart business investment that can provide you with added security.

Investing in the crypto market also appears to be a tremendous opportunity for sustainable financial growth and security. However, even the most immersed crypto enthusiasts do not actually know where this market is going to go and how it is going to develop. In addition, while the downside of trading cryptocurrencies can be quite dramatic, taking you right down to zero, the upside is very likely to be extremely good. Nonetheless, despite the danger it involves, the crypto market still offers much value as a form of diversification, protecting you even if all of your other business ventures fall apart.  

 If traders secure themselves by entrusting their finances in different markets, i.e. forex, crypto, and metals, it will provide a great source of security and prove to be an extremely wise decision, especially in times such as the ones we are currently living. The return on such investments can double in the sense that once any recession is over, which often last approximately one to two years, a trader can buy any stock ties for example for a much cheaper price and thus increase his/her finance increasingly fast. That way, these individuals will easily find themselves on top, as most people are unable to do the same due to the effect the recession had on them. What is more, with such a vast variety of instruments for making money, traders can feel comfortable in case any one of them goes down because, as it often goes, another source of income will start to increase in value to substitute for the loss experienced in some other market.

In conclusion, although the USD is still seen as one of the strongest currencies worldwide and a currency of choice in terms of country reserves across the globe, traders need to think of diversification outside the forex market. Invest in techniques, methods, and systems that you use in trading currencies and, by all means, combine these experiences with other instruments that will provide you with security and stability should the USD or the US market start to depreciate in the future. And, lastly, even if you are just a beginner, or even more so, choose to invest your money no matter how small the amount is elsewhere because defense is equally important to offense.

Categories
Crypto Guides

Could Bitcoin Ever Beat Gold & Get The Safe-Haven Status?

Introduction

The traditional investors from the last few months are trying to understand the unprecedented financial system. The world is suffering from economic uncertainties, where 20% of the US workforce lost their jobs due to the COVID pandemic situation. At the same time, the precious metal “gold” hit an all-time high in this 2020 summer and stayed on a hike for a long time ever since.

The gold rush in the market might be due to various reasons – US dollar fall, US-China deteriorating relations, and general global economic crisis. Also, cryptocurrency investors advocated that Bitcoin perhaps can beat gold as the safe-haven, but researchers pointed out the fact that BTC is not so performing. As with the stock market fall, the market worth of Bitcoin was also down – which means that BTC can’t be classed as a safe-haven asset.

Bitcoin and Gold Market Risk

Bitcoin and gold have emerged as a leading investment unit to stabilize the economic downfall. In the finance industry, there is no guarantee for returns on investment, so there is always high risk. It’s not true that the value of gold will always rise because, in 2012-2015, it was dropped by $20,000 per ounce. Similarly, BTC value bounces up and down. Gold is not so volatile as Bitcoin currency. Gold is acting as a safe-haven from the last 100 years, and bitcoin is in the market from the last decade.

Can Bitcoin be called a Safe-Haven Asset?

Amid all economic crises, bitcoin price hardly reached $9,011, and that too, with a high risk. So, it can’t be considered as a safe-haven asset due to the following two reasons:

Reason 1

The Bitcoin volume in the market is so small to validate the concept of the safe-haven asset. A safe-haven in the traditional market is the asset whose price rises typically. When there is any risk, the investors simply shift their money from risky assets to a safe one to avoid the loss and to retain their investment value.

In the traditional market, Bitcoin’s share is less than $200 billion US dollar, which is not enough to perform as a safe-haven asset. It lacks federal regulations for transactions, and there is a high risk of scams in the Bitcoin cryptocurrency industry. That’s why the Securities and Exchange Commission also rejected the Bitcoin ETF proposal.

Reason 2

Bitcoin can’t be accessed or used in the environment, having no internet connection. In extreme places, you may be cut-off from the cryptocurrency exchange and Bitcoin traders due to limited internet connectivity. For example, due to any major strikes, most of the time, the government shut down the internet accessibility to slow down the protests and all.

In the meantime, due to no internet connection bitcoin wallet and exchange system get hampered instantly. Therefore, bitcoin can’t be used in the emergency situation, so it can’t be considered as an alternative currency or safe-haven asset.

Conclusion

Gold is a risky asset because of sharp falls, and bitcoin, too, has speculative risk factors. In the case of the safe-haven concept, gold is already declared as a safe-haven asset in the traditional market, while Bitcoin is battling for the title. A wide range of economic forces across the world doesn’t impact its value, as BTC trade executes independently. Despite the global recession and high unemployment, BTC is doing great in the market. But for now, we believe that this is not enough to qualify as a safe-haven asset.

Categories
Forex Basic Strategies

Forex Trading Using ‘Commodity Correlation Strategy – 2’

Introduction

A correlation coefficient is a number that describes the extent to which two instruments are correlated to each other. The number ranges between -1 and +1. This number moves from periods of positive correlation to periods of negative correlation. Located on one end of the scale, +1 is considered a state of the positive correlation between two instruments.

If the number is anywhere between 0 and +1, the two assets are said to move in the same direction, with a certain degree of positive correlation. On the other end of the scale, -1 is considered a state of negative correlation between two instruments. If the number is anywhere between 0 and -1, the two instruments are said to move in the opposite direction, with a certain degree of negative correlation.

The strategy we will be discussing today seeks to exploit the inverse correlation between the dollar index and Gold’s price. According to the World Gold Council, Gold tends to rise when the U.S. dollar falls. It is observed in the past that the correlation coefficient for Gold and the dollar index was between -0.6 and -0.8. This means if the dollar index is up, there is a 60% to 80% chance that gold prices would come down. In contrast, if the dollar index is down, there is a 60% to 80% chance that gold prices would come down. Let us see how the strategy works.

Time Frame

The commodity correlation strategy works well in the Daily (D) time frame. This implies that each candlestick on the chart represents the price movement of one day.

Indicators

We will be using the ATR indicator in the strategy. No other indicators are required for the strategy.

Currency Pairs

There are two charts we need to focus on in this strategy. The first one is the spot Gold or XAU/USD, and the second one is the chart of the dollar index.

Strategy Concept

The dollar index’s price action is used as a reference to initiate a trade on the XAU/USD. Technical levels of support and resistance on the dollar index chart are used to spot long and short trades on XAU/USD. If the price closes below the support on the dollar index chart, a long trade is initiated on the XAU/USD the following day. Similarly, if price closes above resistance on the dollar index chart, a short trade is initiated on the XAU/USD the following day. The risk-to-reward of this trade is 1:2. A bigger target can be achieved by allowing the trade to run its course.

The strategy is very simple for those who have a basic understanding of support and resistance. Another reason behind its popularity is that it does not involve the usage of complex indicators. The trade setups are not formed too often as we are using the daily time frame charts. Hence, a lot of patience is required for the application of the strategy.

Trade Setup

Here are the steps to implement the commodity correlation strategy. In both the instruments, we will be using the daily time frame chart only.

Step 1

The first step of the strategy is to open the dollar index’s daily time frame and mark key areas of support and resistance on the chart. If one is looking for ‘long’ trades, the identification of the support area is crucial. And if one is looking for ‘short’ trades, identification of ‘resistance’ trade is crucial. After marking out of the lines, wait for the price to breakout or breakdown. In case of a breakout, we will look for ‘short’ trades in ‘gold,’ and in case of a breakdown, we will look for ‘long’ trades in ‘gold.’

We have taken an example of a ‘long’ trade where we will be executing the steps of the strategy. In the below image, one can see that the price has broken below the long term support.

Step 2

Next, we open the chart of XAU/USD, where we look for ‘long’ or ‘short’ entry. We enter for a ‘long’ in ‘gold’ on the following day of the dollar index’s break of support. Similarly, we enter for a ‘short’ in ‘gold’ on the following day of the break of resistance in the dollar index. The entry is taken right at the opening candle on the next day.

In our case, we are entering for a ‘long’ in ‘gold’ on the following day since the price had broken the dollar index’s support on the previous day.

Step 3

In this step, we determine the take-profit and stop-loss for the strategy. The stop loss is mathematically calculated where it is placed at the amount obtained after multiplying 2 to the value of the ATR indicator on the previous day. This means if the ATR value is 30, then stop loss will be set 60 points away from the current market price (CMP). The take-profit is extended up to a point where the trade results in a risk to reward ratio of 1:2. As mentioned earlier, since this is a long-term chart, the trade has the potential to give higher returns.

We can see in the below image that trade has almost reached our ‘take-profit’ where this is the current state of the market.

Strategy Roundup

Part II of the commodity correlation strategy seeks to take advantage of the negative correlation between the dollar index and gold prices. Using the dollar index as a reference, we are activating trades on the XAU/USD pair, which is nothing but the price of spot gold.

However, the interest rates announcement by the Federal Reserve will try to keep the inverse relationship between the U.S. dollar and Gold. This strategy is ideal for traders around the world who do not have time to watch the markets on a daily basis. The strategy can also be used to look for investment opportunities in Gold.

Categories
Forex Assets

XPT/USD – How Expensive Is It To Trade This Commodity Asset Class?

Introduction

Platinum is one of the rarest precious metal found in the Earth’s crust. Only a few hundred tons are produced annually. The name Platinum is derived from a Spanish word platina (little silver).

Similar to how other precious metals like Gold and Silver are traded in the exchange market, Platinum is also actively traded in the market. Its ISO code is XPT and is highly traded against the US Dollar with the ticker XPT/USD.

Understanding XPT/USD

Platinum is a precious metal that is measured in troy ounces (Oz). The market price of XPT/USD represents the value of the US Dollar for one troy oz of Platinum. It is quoted as 1 XPT per X USD. For instance, if the current market price of XPT/USD is 814.50, then it means that each oz of Pl is worth 814.50 USD.

XPT/USD Specification

Spread

It is the difference between the bid and the ask prices. The typical spread in Platinum is usually around 700 pips.

Fee

Unlike currency pairs, Platinum is traded as a Contract for difference (CFD). There are three different types of the fee charged for such trades:

  • Commission charge
  • Overnight fee

Thus, the total fee will be,

Total fee = Spread + commission + overnight

For our example, we shall ignore the overnight fee as it completely depends on how long aa trader is willing to hold his positions. So, the revised fee will be,

Total fee = Spread + commission = 700 + 200 = 900 pips

Trading Range in XPT/USD

The trading range is a representation of volatility in the pair for different time frames in a tabular format. It gives the minimum, average, and maximum volatility in the pair for various time frames.

Procedure to assess Pip Ranges

  1. Add the ATR indicator to your chart
  2. Set the period to 1
  3. Add a 200-period SMA to this indicator
  4. Shrink the chart so you can assess a large time period
  5. Select your desired timeframe
  6. Measure the floor level and set this value as the min
  7. Measure the level of the 200-period SMA and set this as the average
  8. Measure the peak levels and set this as Max.

XPT/USD Cost as a Percent of the Trading Range

Cost as a % of the trading range illustrates the variation in the cost of trade by considering the time frame and volatility of the instrument. Mathematically, it is the ratio of the volatility value and the total cost represented in terms of a percentage.

Total fee = Spread + commission = 700 + 200 = 900 pips

Trading the XPT/USD

Platinum is one of the highly traded commodities in the exchange market. But its trading volume is lesser than Gold Spot and Silver Spot. Nonetheless, it has enough volatility and liquidity for retail traders to participate in the market.

Platinum is primarily driven by supply and demand that comes from fundamental factors. These factors are different from that of Gold and Silver, yet some do apply on Pl. When it comes to technical analysis, all the techniques apply that is used in other markets.

As mentioned, Platinum is traded as CFD, and each trade has a commission, overnight, and spread involved in it. This fee is fixed irrespective of the volatility of the market and the time frame traded. But there is a catch here. Even though the fee is fixed, the fee varies relatively. Meaning, a trader aiming high profit must pay the same fee as a trader aiming for small profits. The former is typically a large time frame trader, while the latter is a trader trading relatively smaller time frame.

Since the timeframe is something that cannot be fixed, one can relatively reduce costs by considering the volatility of the market. As the above table evidently depicts, as the volatility increases, the relative fee on the trade decreases. Thus, one must consider trading when the volatility of the pair is at or above the average volatility.

Categories
Forex Assets

Costs Involved While Trading The XBR/USD Asset Class

Introduction

BCO is an acronym for Brent Crude Oil, which is one of the two types of crude oil and is a benchmark for determining the price of oil, along with West Texas Intermediate (WTI) crude oil. BCO is also known by Brent Blend, Brent Oil, and London Brent. It is the benchmark for the majority of the crude oil from the Atlantic basin, which marks for two-thirds of the crude oil price traded internationally. In the market, it is traded with the ticker XBR/USD.

Understanding XBR/USD

Brent Crude is a commodity traded in barrels. The price of XBR/USD depicts the value of the US Dollar for 1 barrel of crude oil. It is quoted as 1 XBR per X USD. For example, if the market price of XBR/USD is 41.42, then it means that each barrel of crude oil is worth $41.42.

XBR/USD Specification

Spread

It is the basic difference between the bid price and the ask price. The spread on ECN and STP account model is as follows:

ECN: 11 | STP: 15

Fee

There is a fee (commission) for every position a trader opens. However, this fee is only on the ECN account, not the STP account.

Slippage

Slippage is the difference between the price intended by the trader and the price given by the broker. It occurs due to two factors:

  • Broker’s execution price
  • The volatility of the market

 Trading Range in XBR/USD

It is the representation of the volatility of the market in different time frames. The table values represent the minimum, average, and maximum pip movements in various time frames. 

Procedure to assess Pip Ranges

  1. Add the ATR indicator to your chart
  2. Set the period to 1
  3. Add a 200-period SMA to this indicator
  4. Shrink the chart so you can assess a large time period
  5. Select your desired timeframe
  6. Measure the floor level and set this value as the min
  7. Measure the level of the 200-period SMA and set this as the average
  8. Measure the peak levels and set this as Max.

XBR/USD Cost as a Percent of the Trading Range

The following are two tables that represent the variation in the fee in terms of a percentage for different time frames. The percentage values are calculated by finding the ratio between the total cost and the volatility values.

ECN Model Account

Spread = 11 | Slippage = 5 | Trading fee = 5

Total fee = Spread + Slippage + Trading fee

Total fee = 11 + 5 + 5 = 21 (pips)

STP Model Account

Spread = 15 | Slippage = 5 | Trading fee = 0

Total fee = Spread + Slippage + Trading fee

Total fee = 15 + 5 + 0 = 20 (pips)

Trading the XBR/USD

Crude oil is a commodity that is rigorously traded in the market. Its volatility and liquidity are comparable to major and minor currency pairs, providing good opportunities for traders to participate in the market. The crude oil prices are driven by various fundamental factors and its Demand and Supply. The reflection of the same is seen on the charts. Thus, traders can apply technical analysis as well to forecast the price movements.

There is a fee on every trade you take with a forex broker. This fee is the same irrespective of the time frame you trade on. So, traders must place themselves in a position that will have a reasonable cost for a sufficient P/L. The trading range and the cost percentage table are the tools for it.

The larger the percentage value, the higher is the relative fee on the trade and vice versa. For example, let’s there are two traders – 1D and 4H trading with the same lot size. The 1D trader places a take profit to 200 pips, while the 4H trader places it at 100 pips. But the fee paid by both the traders is the same. But, seeing the relative fee, the 4H trader pays a higher fee than the 1D trader because his take profit is only 100 pips. Thus, the percentage values are higher in the 1D time frame than the 4H time frame.

There is another scenario where the relative cost changes based on the volatility of the market. In simple terms, the relative fee can vary even if a trader trades in the same time frame. Precisely, the relative fee is higher when the volatility of the market is around the minimum values. Therefore, to balance between the total fee and the P/L, one must trade when the market volatility is above the average volatility, irrespective of the time frame traded.

Categories
Forex Signals

Gold: Moving South Below the 50-Period SMA

XAUUSD had a bounce off its lows that began on Jun 15 at 13:00 the bounce re3ached the $1730 level and began to move sideways, making lower lows. The last interaction made an evening star with a large bearish candlestick. We think this is a good short setup to scalp with a target at the current 200-hour SMA for a nice and fast reward. The R/r factor is just 1 but the odds of the pair going south are very high, which makes the trade appealing. We see also that the Stochastics made a crossover to near the middle of the range, suggesting an increased bearish momentum.

Trade Setup:

Entry: 1,724.64

Stop-loss: 1,734.64

Take profit: 1,714.64

Reward/Risk: 1

Risk: 100 pips which is $1000 per XAUUSD Lot, or $10 on a micro-lot. The reward is identical as the R/r =1


Categories
Forex Assets

Asset Analysis – Analyzing The XAG/USD Asset Class

Introduction

Silver is a precious metal standing after Gold. It is a vital asset to understand and forecast the potential movements in the commodity market. This is because buyers and sellers trade the silver market based on global macro trends. Moreover, Silver highly correlates with the Gold Spot prices. XAG/USD is the ticker for Silver against the US Dollar. XAG can be traded against other fiat currencies as well.

Understanding XAG/USD

Silver is a commodity that is traded in troy ounces (Oz), just like any other precious metal. The market price of XAG/USD represents the value of the US Dollar for 1 ounce (Oz) of Silver. It is quoted as 1 XAG per X USD. For example, if the market price of XAG/USD is 17.432, it signifies that each ounce of Gold is worth $17.432.

XAG/USD Specification

Spread

Spread is essentially the difference between the buying price and the selling price. The spread varies on the based account-model used.

ECN: 15 | STP: 21

Fee

A fee is basically the commission on the trade. It applies only to ECN accounts, not STP accounts.

Slippage

The arithmetic difference between the price asked by the trader and the price given by the Broker is referred to as slippage. It occurs due to two reasons: High market volatility & Broker’s execution speed

Trading Range in XAG/USD

The minimum, average, and maximum pip movement in different time frames is represented in the following table. It can be used to assess your risk on the trade.

Procedure to assess Pip Ranges

  1. Add the ATR indicator to your chart
  2. Set the period to 1
  3. Add a 200-period SMA to this indicator
  4. Shrink the chart so you can assess a large time period
  5. Select your desired timeframe
  6. Measure the floor level and set this value as the min
  7. Measure the level of the 200-period SMA and set this as the average
  8. Measure the peak levels and set this as Max.

XAG/USD Cost as a Percent of the Trading Range

Cost a percent of the trading range is the representation of the variation in fees on the trade-in different time frames for varying volatility.

ECN Model Account

Spread = 15 | Slippage = 5 | Trading fee = 5

Total fee = Spread + Slippage + Trading fee

Total fee = 15 + 5 + 5 = 25 (pips)

STP Model Account

Spread = 21 | Slippage = 5 | Trading fee = 0

Total fee = Spread + Slippage + Trading fee

Total fee = 21 + 5 + 0 = 26 (pips)

Trading the XAG/USD

Silver Spot is extensively traded in the commodity market, after Gold Spot. It offers enough volatility and liquidity for traders to participate in the market. Silver highly correlates to Gold. Traders can use it as a proxy to place their bets on Silver prices. The technical analysis can be used on Silver as applied to any other market. Even though there is enough volatility in this pair, it is not ideal for entering any time into the market. The reason for it can be accounted for through the cost percentage table.

The cost percentage table represents how expensive a trade is going to be based on the time frame and volatility. Note that, the absolute total cost will remain the same irrespective of the two factors but will vary relatively. For instance, a 1H trader must pay the same fee a 4H trader pays for their trade. But, there a catch; the 4H trader generates more P/L than a 1H trader.

Thus, to have a balance between the P/L and fee on the trade, one must trade when the market volatility at or above the average values. Trading in low volatility markets will cause hurdles in the market to reach your target. Hence, we will have to pay the same costs, even for a small P/L.

Categories
Forex Assets

Analyzing The ‘XAU/USD’ Financial Instrument & Determining The Trading Costs Involved

Introduction

Gold is a precious metal and one of the most valuable assets in the market. It is considered to be a safe haven instrument and a popular asset class for hedging positions during market uncertainty. XAU/USD is the abbreviation for the pair Gold Spot against the US Dollar. XAU is the ticker for Gold Spot. It can be traded against other fiat currencies like EUR and GBP as well.

Understanding XAU/USD

Gold Spot is an asset that is traded in troy ounces (Oz). The XAU/USD market price represents the value of the US Dollar for 1 ounce (Oz) of Gold. It is quoted as 1 XAU per X USD. For example, if the current market price of XAU/USD is 1730.50, it signifies that each ounce of Gold is worth the US $1730.5.

XAU/USD Specification

Spread

Spread is the difference between the bid price and the ask price. The spread usually varies based on the account type used for execution. The approximate spread on the gold spot on ECN account and STP account is as follows:

ECN: 100 | STP: 130

Fee

Typically, brokers do not charge any type of fee. But, on ECN accounts, there is some commission you must pay the broker for opening and closing a position. However, the fee is not significantly high.

Slippage

Due to the high market liquidity and slower broker’s execution speed, slippage occurs. It is the difference between the trader’s demanded price and the price at which the broker executed the trade. Slippage can occur both in favor and against the trader.

Trading Range in XAU/USD

The trading range is a tabular representation of the volatility in the market for several different time frames. It gives the minimum, average, and maximum volatility in the pair for different time frames.

Procedure to assess Pip Ranges

  1. Add the ATR indicator to your chart
  2. Set the period to 1
  3. Add a 200-period SMA to this indicator
  4. Shrink the chart so you can assess a large time period
  5. Select your desired timeframe
  6. Measure the floor level and set this value as the min
  7. Measure the level of the 200-period SMA and set this as the average
  8. Measure the peak levels and set this as Max.

XAU/USD Cost as a Percent of the Trading Range

Cost as a percent of the trading range represents variation in the trade cost by considering the market’s time frame and volatility. Mathematically, it is the ratio of the volatility value and the total cost of the trade.

ECN Model Account

Spread = 100 | Slippage = 30 | Trading fee = 20

Total fee = Spread + Slippage + Trading fee

Total fee = 100 + 30 + 20 = 150 (pips)

STP Model Account

Spread = 130 | Slippage = 30 | Trading fee = 0

Total fee = Spread + Slippage + Trading fee

Total fee = 130 + 30 + 0 = 160 (pips)

The Ideal Timeframe to Trade XAU/USD

Gold is one of the oldest asset classes and one of the most reliable instruments as well. It is extensively traded in the market as most forex broker has XAU/USD available for trading. Its volatility and liquidity are no less than major currency pairs.

XAU/USD can be traded like any other foreign exchange pair. It, in fact, correlates with commodity currencies like AUD and NZD. Thus, traders use these two currencies in addition to USD, in order to analyze the pair. The same technical analysis applied to other markets can be used on the gold spot as well. However, the fundamentals do differ a little.

Coming to the costs, it technically remains the same for any time frame you trade. However, it relatively changes based on volatility and time frame. For example, a 1D trader who makes 2000 pips P/L on an average pays the same a 1H trader who makes 500 pips P/L on a trade. This is the reason the percentage values are higher in the 1H time frame than the 1D time frame.

Irrespective of the time frame you trade, you need to make sure that the market’s current volatility is above the average volatility. If you end trading when the volatility is at the minimum values, then you will have to pay the same costs for a trade that could not reach the target in your expected time.

Categories
Forex Assets

Trading The ‘LINK/USD’ Crypto Fiat Pair & Analyzing The Costs Involved

Introduction

Chainlink is a decentralized oracle network whose purpose is to connect smart contracts with the real world. LINK is its native digital currency, which is used to node operators on the Chainlink decentralized oracle network. LINK has a market capitalization of $1.5 billion and stands 14th on CoinMarketCap. LINK can be bought using fiat currency as well as traded against other cryptocurrencies like BTC and ETH.

Understanding LINK/USD

The price of LINK/USD depicts the value of the US Dollar equivalent to one Chainlink. It is quoted as 1 LINK per X USD. For example, if the market price of LINK/USD is 4.36166, then each LINK will be worth so many dollars.

LINK/USD specifications

Spread

Spread is nothing but the arithmetic difference between the buying and selling price of the cryptocurrency. Unlike forex brokers, these prices are decided by the traders and not the exchange. Hence, the spread constantly varies in exchange as well as across exchanges.

Fee

Typically, there are three types of the fee charged by exchanges including

  • Execution fee (Taker or Maker) – twice, for opening and closing the trade
  • 30-day trading volume fee
  • Margin opening fee, if applicable

Example

  • Long 1,000 LINK/USD at $4.45509
  • 30-day volume fee is $0
  • Order is executed as Taker
  • With Leverage

Total cost of the order = 1,000 x $4.45509 = $4455.09

Assuming the taker fee to be 0.26%, the opening fee will be – $4455.09 x 0.26% = $11.58

The margin opening fee of 0.02% is charged for opening the position using leverage – $4455.09 x 0.02% = $0.89

If the order is closed at $4.50000, the total cost of closing will be – 1,000 x $4.50000 = $4500.00. And the fee for closing will turn to be – $4500.00 x 0.26% = $11.70

Thus, the total fee will be the sum of all the fees – $11.58 + $0.89 + $11.70 = $24.17

Trading Range in LINK/USD

Chainlink is traded in cryptocurrency exchanges and not forex brokers. So, there is no concept of pip and pip value. Instead, the value of the crypto is directly taken into account.

A trading range is the tabular representation of the approximate value movement of the pair, which is obtained through the Average True Range (ATR) indicator. In layman terms, the numbers in the table depict the amount of US dollars a trader will gain or lose in a given time frame. The following table shows the value of the price movement for 1,000 quantities LINK/USD.

Note: the above values are for trading 1,000 units of LINK/USD. If X units of the pair are traded, then the ATR values will be,

(ATR value from the table / 1,000) x X units

Procedure to assess ATR values

  1. Add the ATR indicator to your chart.
  2. Set the period to 1
  3. Add a 200-period SMA to this indicator.
  4. Shrink the chart so you can assess an extensive period
  5. Select your desired timeframe
  6. Measure the floor level and set this value as the min
  7. Measure the level of the 200-period SMA and set this as the average
  8. Measure the peak levels and set this as Max.

LINK/USD Cost as a Percent of the Trading Range

Below are two tables representing cost variations for different time frames in terms of a percentage for taker execution and maker execution.

Taker Execution Model

Opening = $11.58 | Margin fee = $0.89 | Closing = $11.70 | 30-day volume = $0

Total fee = Opening + Margin fee + Closing + 30-day volume = $11.58 + $0.89 + $11.70 + $0 = $24.17

Maker Execution Model

Opening = $7.12 | Margin fee = $0.89 | Closing = $7.2 | 30-day volume = $0

Total fee = Opening + Margin fee + Closing + 30-day volume = $7.12 + $0.89 + $7.2 + $0 = $15.21

*Assuming maker fee to be 0.16% the trade value.

Interpretation of Cost as a Percent of the Trading Range

Let us directly understand the table with an example.

1H time frame

ATR value = 41.92

Cost percentage = 57.66%

4H time frame

ATR value = 92.32

Cost percentage = 26.18%

Comparing ATR values, we infer that more profit can be generated in the 4H time frame ($92.32) than in the 1H time frame ($41.92). But, a critical point to note is that the cost is the same for both the trades. A fee that is paid to gain $92.32, the equal fee must be paid to gain $41.92. This difference is represented using the cost percentage. Thus, the percentage in the 1H time frame is higher than that in the 4H time frame, indicating that the relative costs are higher.

Trading the LINK/USD

LINK can be traded against USD and few cryptocurrencies as well. However, LINK/USD is seen to have the highest trading volume. Comparing the liquidity with other cryptocurrency pairs like BTC/USD, ETH/USD, and XRP/USD, LINK/USD is less liquid.

From the above comprehension of the cost percentage, we understood that the costs remain the same irrespective of the time frame you trade. Thus, to relatively reduce the costs, we must focus on the columns of the table. The effective way to trade this pair is to enter the market when the volatility is at or above the average values. For example, if you are a day trader who trades the 1H time frame, you must make sure that the volatility is above the average level. In doing so, you will be able to extract more from the market for the same total fee. Cheers!

Categories
Forex Assets

Analyzing The ‘XMR/USD’ Crypto Fiat Pair

Introduction

Monero is a private and secure cryptocurrency that was launched 18th of April 2014 as a fork of ByteCoin. It is an open-source digital currency built on a blockchain, making it opaque. With Monero, the holder will have full control over their investment and funds, and nobody will have access to their balance and transactions.

Monero is traded in exchanges under the ticker XMR. It is under the top 20 in terms of market capitalization according to data from CoinMarketCap. It can be traded against USD as well as for cryptocurrencies Bitcoin, Ethereum, Tether, etc.

Understanding XMR/USD

The price of XMR/USD depicts the value of the US Dollar equivalent to one Monero. It is quoted as 1 XMR per X USD. For example, if the market price of XMR/USD is 64.67, then each XMR will be worth about 65 dollars.

XMR/USD specifications

Spread

Spread is the basic difference between the bid and the ask price of the cryptocurrency. These prices are put up by the clients and not exchange. Thus, the spread constantly varies in and across exchanges.

Fee

The types of fees in cryptocurrency exchanges vary from that of equity broker and forex brokers. Most crypto exchanges charge the following fees:

  • Execution fee (Taker or Maker) – twice, for opening and closing the trade
  • 30-day trading volume fee
  • Margin opening fee, if applicable

Example

  • Short 100 XMR/USD at $64.82
  • 30-day volume fee is $0
  • Order is executed as Taker
  • With Leverage

Total cost of the order = 100 x $64.82 = $6482

Assuming the taker fee to be 0.26%, the opening fee will be – $6482 x 0.26% = $16.85

Since the trade is opened with leverage, there is 0.02% of margin opening fee collected – $6482 x 0.02% = $1.29

If the position is squared off at $60.00, the total cost of closing will be – 100 x $60.00 = $6000.  The fee for the same can be calculated as – $6000 x 0.26% = $15.60

The algebraic sum of all the fee will yield the total fee as –

$16.85 + $1.29 + $15.60 = $33.74

Trading Range in XMR/USD

A trading range is the number of units the cryptocurrency pair moves in a specific time frame, represented in US dollars as the quote currency for the pair is USD. The values basically depict the volatility in different time frames.

The following table is the trading range for 100 quantities of XMR/USD.

Note: the above values are for trading 100 units of XMR/USD. If X units of the pair are traded, then the ATR values will be,

(ATR value from the table / 1,000) x X units

Procedure to assess ATR values

  1. Add the ATR indicator to your chart.
  2. Set the period to 1
  3. Add a 200-period SMA to this indicator.
  4. Shrink the chart so you can assess a large time period
  5. Select your desired timeframe
  6. Measure the floor level and set this value as the min
  7. Measure the level of the 200-period SMA and set this as the average
  8. Measure the peak levels and set this as Max.

XMR/USD Cost as a Percent of the Trading Range

This cost as a percent represents relative the fee on the trade by considering the volatility and time frames. The percentage values are calculated by finding the ratio of each ATR value and the total fee.

Taker Execution Model

Opening = $16.85 | Margin fee = $1.29 | Closing = $15.60 | 30-day volume = $0

Total fee = Opening + Margin fee + Closing + 30-day volume = $16.85 + $1.29 + $15.60 = $33.74

Maker Execution Model

Opening = $10.37 | Margin fee = $1.29 | Closing = $9.6 | 30-day volume = $0

Total fee = Opening + Margin fee + Closing + 30-day volume = $10.37 + $1.29 + $9.6 + $0 = $21.26

*Assuming maker fee to be 0.16% the trade value.

Trading the XMR/USD

XMR is ranked 16 in market capitalization with a denominator over a thousand. It offers enough liquidity and volume for retail traders to participate in this pair. However, it is comparatively lesser than coins like Bitcoin, Ethereum, Ripple, Bitcoin Cash, etc.

As far as the analysis for this pair is concerned, it is no different from analyzing other cryptocurrencies and forex pairs. Hence, you can confidently apply those concepts in Monero as well.

The cost percentages in the above tables represent how expensive or cheap trade is going to be based on the profit you make or the loss you incur. The larger the percentage, the higher is the fee. Note that we are referring to the relative fee, not the absolute fee. Irrespective of the time frame and volatility, the fee will be the same but will vary relatively. For example, a short-term trader who makes $50 on trade must pay the same fee as a long-term trader who makes $1000.

Thus, to effectively reduce your relative costs, you must understand the volatility of the market. The concept is simple; one can make money only if there is enough movement in the market. Thus, before taking a trade, you must know the current volatility of the market using the ATR indicator. If the values are above the average, then you’re good to go. But, values near the minimum value indicates that there is not much movement in the market, and it could not reach your target point within the expected time.

Categories
Forex Assets

XTZ/USD – Trading Costs Involved While Trading This Crypto-Fiat Pair

Introduction

Tezos is a platform that supports the development of DApps and smart contracts. It was created by an ex-Morgan Stanley analyst Arthur Breitman who launched an Initial Coin Offering (ICO) in 2017, raising $232 million. The next year, Tezos launched its beta network in July.

Tezos works by giving incentives to users willing to participate in the development of its protocol. Note that the complete network is decentralized. Users cannot mine Tezos coins as it based on the Proof-of-stake mechanism, unlike the Proof-of-Work in Bitcoin blockchain. Tezos is powered with its own XTZ token, which is created through a process called “baking.”

Understanding XTZ/USD

The price of XTZ/USD depicts the value of the US Dollar equivalent to on Tezos. It is quoted as 1 XTZ per X USD. For example, if the XTZ/USD’s market price is 2.9157, then each XTZ will be worth 2.9157 US dollars.

XTZ/USD specifications

XTZ stands 11th in terms of market capitalization on CoinMarketCap. Forex brokers typically allow trading of only the top 3 or top 5 for trading. So, most brokers do have XTZ enabled for trading. Thus, you will have to approach a cryptocurrency broker instead. They work quite differently from that of the forex broker. For example, instruments are traded in lots with forex brokers, unlike cryptocurrency exchanges.

Spread

Spread is the difference between the buying and selling price of the cryptocurrency. These prices are set by individual traders and not the exchange.  Thus, the spread always varies. Hence, we shall not be considering the spread in further calculations.

Fee

There are a number of fees charged by exchanges for trading cryptos. Below are some types of fees levied by most exchanges.

  • Execution fee (Taker or Maker)
  • 30-day trading volume fee
  • Margin opening fee, if applicable

Note that, the taker or maker fee is charged twice – for opening and closing the trade.

Example

  • Long 1,000 XTZ/USD at $2.9169
  • 30-day volume fee is 0.12%
  • Order is executed as Maker
  • Without Leverage

Total cost of the order = 1,000 x $2.9169 = $2916.9

Assuming the maker fee to be 0.16%, the opening fee will be – $2916.9 x 0.16% = $4.66

In addition, there is 0.12% fee for 30-day volume fee – $2916.9 x 0.12% = $3.50

Since the trade is opened without leverage, the margin opening fee will be $0.

If the order is closed at $2.9605, the total cost of closing will be – 1,000 x $2.9605 = $2960.5. The fee for closing will be:

$2960.5 x 0.16% = $4.73

Therefore, the total fee for this trade can be calculated as:

$4.66 + $3.50 + $4.73 = $12.89

Trading Range in XTZ/USD

The trading range in cryptocurrencies is different from that of foreign exchange. In forex, we calculated the pip movement using the ATR indicator and multiplied it with the pip value to find its worth. Since in cryptocurrency exchanges, there is no concept of pips. So, instead of representing the pip movement, we directly represent the value/worth of the price movement into the table.

The below table represents the value of the price movement for 1,000 quantities of XTZ/USD.

Note: the above values are for trading 1,000 units of XTZ/USD. If X units of the pair are traded, then the ATR values will be,

(ATR value from the table / 1,000) x X units

Procedure to assess ATR values

  1. Add the ATR indicator to your chart
  2. Set the period to 1
  3. Add a 200-period SMA to this indicator
  4. Shrink the chart so you can assess a large time period
  5. Select your desired timeframe
  6. Measure the floor level and set this value as the min
  7. Measure the level of the 200-period SMA and set this as the average
  8. Measure the peak levels and set this as Max.

XTZ/USD Cost as a Percent of the Trading Range

Cost as a percent of the trading range represents the relative cost in terms of percentage. It is calculated by finding the ratio between the total cost and the ATR value. The comprehension of it shall be discussed in the subsequent topic.

Taker Execution Model

Opening = $7.58 | Margin fee = $0 | Closing = $7.69 | 30-day volume = $3.50

Total fee = Opening + Margin fee + Closing + 30-day volume = $7.58 + $0 + $7.69 + $3.50 = $18.77

*Assuming taker fee to be 0.26% the trade value.

Maker Execution Model

Opening = $4.66 | Margin fee = $0 | Closing = $4.73 | 30-day volume = $3.50

Total fee = Opening + Margin fee + Closing + 30-day volume = $4.66 + $0 + $4.73 + $3.50 = $12.89

Interpretation of Cost as a Percent of the Trading Range

Firstly, the trading range table, in simple terms, depicts the approximate dollar profit/loss on the trade. For instance, let us consider the average value on the 4H timeframe, which is 71.5. This means that one can gain or lose an average of $71.5 in a matter of 4 hours or so.

With respect to the percentage table, the value of the percentage signifies how expensive the costs are relative to the time frame and profit or loss generated. In other sense, the cost remains the same irrespective of the time frame you trade. For example, let us consider the average percentage on the 4H time frame, which is 18.03%, and the average on the 1H, which is 34.01%. In both cases, the overall is the same, but the cost relative to the profit made, the cost appears to be higher in the 1H time frame because the profit amount is lower than the 4H time frame because there is more price movement on the 4H time frame.

Trading the XTZ/USD

Tezos is under the top 15 in market capitalization according to the data from CoinMarketCap. This signifies that it is intensively traded in the market. Most of the buying and selling happens in the cryptocurrency exchanges.

There are two types of traders – short term and long term. A short term trader may trade the 1H, 2H, 4H, or the 1D time frame, while a long term trader may go with the 1W or 1M time frame. Also, irrespective of the time frame, one must trade when the market volatility is around the average, or maximum value to relatively reduce fees on the trade.

Categories
Forex Assets

Analyzing The ‘ADA/USD’ Crypto-Fiat Asset Class

Introduction

Cardano is a decentralized platform allowing programmable transfers of value securely in a scalable fashion. It is the first blockchain created out from a scientific philosophy. It is also the first research-driven cryptocurrency that is built on the Haskell programming language.

Cardano is traded with the ticker ADA. It has a market capitalization of $2.2 billion. It can be bought, sold, and exchanged in several cryptocurrency exchanges. Apart from USD, it can be traded against other cryptos such as BTC, ETH, USDT, etc.

Understanding ADA/USD

The price of ADA/USD depicts the value of the US Dollar equivalent to one Cardano. It is quoted as 1 ADA per X USD. For example, if the market price of ADA/USD is 0.086112, then each ADA will be worth 0.086112 US dollars.

ADA/USD specifications

Forex brokers allow trading of only a few popular cryptocurrencies like Bitcoin, Ethereum, Ripple, etc. The other cryptos must be traded via cryptocurrency exchanges. And the working of these exchanges is different from that of forex brokers. As a major difference, cryptos are not traded in lots, in cryptocurrency exchanges.

Spread

Spread is the difference between the buying and selling price of the cryptocurrency. Crypto exchanges match these prices between induvial traders. Thus, there is no fixed spread. Also, typically, the spread is negligible in trading cryptos.

Fee

There are different fees charged by cryptocurrency exchanges for trading any coin. The various forms of fees include

  • Execution fee (Taker or Maker)
  • 30-day trading volume fee
  • Margin opening fee, if applicable

Note that the taker or maker fee will be considered for opening as well as closing the trade, and will depend on the value being traded.

Example

  • Short 10,000 ADA/USD at $0.085800
  • 30-day volume fee is $0
  • Order is executed as Taker

Total cost of the order = 10000 x $0.085800 = $858

Assuming the taker fee to be 0.26%, the opening fee will be – $858 x 0.26% = $2.23

Assuming the trade is opened with leverage, and the margin opening fee is 0.02%, the fee is calculated as – $858 x 0.02% = $0.17

If the order is closed at $0.095800, the total cost of closing will be 10,000 x $0.095800 = $958. And the fee for the same obtained is – $958 x 0.26% = $2.5

Thus, the total fee for the opening, maintaining and closing the trade would be equal to – $2.24 + $0.17 + $2.5 = $4.91

Trading Range in ADA/USD

The trading range represents the number of units moved in the pair in a specified time frame. For example, if 10,000 ADA/USD is traded and the average unit movement in the 1H time frame is 0.000778, then it means the pair will yield 10,000 x 0.000778 = $7.78.

Note: the above values are for trading 10,000 units of ADA/USD. If X units are traded, then the ATR values will be,

(Above ATR value / 10,000) x X units

Procedure to assess ATR values

  1. Add the ATR indicator to your chart.
  2. Set the period to 1
  3. Add a 200-period SMA to this indicator.
  4. Shrink the chart so you can assess a large time period
  5. Select your desired timeframe
  6. Measure the floor level and set this value as the min
  7. Measure the level of the 200-period SMA and set this as the average
  8. Measure the peak levels and set this as Max.

ADA/USD Cost as a Percent of the Trading Range

The following tables depict the variations in total cost in terms of percentage based on the change in volatility and time frame.

Taker Execution Model

Opening = $2.23 | Margin fee = $0.17 | Closing = $2.5

Total fee = Opening + Margin fee + Closing = $2.24 + $0.17 + $2.5 = $4.91

Maker Execution Model

Opening = $1.37* | Margin fee = $0.17 | Closing = $1.53*

Total fee = Opening + Margin fee + Closing = $1.37 + $0.17 + $1.53 = $3.07

*Assuming maker fee to be 0.16% the trade value.

Trading the ADA/USD

Cardano stands 10th in CoinMarketCap in terms of market capitalization. Thus, making it a tradable pair in the crypto market. Almost all forex brokers do not ADA enabled for trading, so it must be traded through cryptocurrency exchanges. The fee structure here is quite different from forex brokers. However, the overall fee is more or less the same.

Comprehending the above tables, the magnitude of the percentage depicts how expensive/cheap a trade will be relative to the time frame and profit/loss. Let us understand this with an example.

The average values in 4H and 1D are 26.65% and 9.73%, respectively. The percentage in the 4H time frame is greater than the percentage in the 1D time frame. This means that the total cost for both is the same ($4.91), but relative to the generated profit, it is higher in the 4H time frame. A detailed reason for this can be given from the trading range table.

In the trading range table, the corresponding values are $11.52 and $31.55. This can be interpreted as, an average of $11.52 will be generated in trading the 4H time frame, and $31.55 when trading the 1D time frame. The fee in both cases is the same. Thus, we infer that the fee that is paid to generate $31.55, the same fee is deducted for generating $11.52. And hence, this is exactly what the higher percentage value depicts.

Reading through the row, the percentage values for a time frame is highest in the minimum column and least in the maximum column. So, if you’re are able to deal with higher volatility, it is ideal to trade when the volatility is around the average or maximum values. And if you cannot deal with the high volatility, you may trade the higher time frames to reduce the relative costs.

Categories
Forex Assets

What Should You Know About The ‘XLM/USD’ Crypto Fiat Pair

Introduction

XLM is the abbreviation for Stellar. This cryptocurrency was founded in 2014 by Jed McCaleb. Stellar is also a payment technology that was created mainly to connect financial institutions and reduce the costs for cross-border transfers.

Stellar is actively traded in the market against fiat currencies and other cryptocurrencies. In this article, we shall be analyzing Stellar against the US dollar, abbreviated as XLM/USD.

Understanding XLM/USD

The price of XLM/USD depicts the value of the US Dollar that is equivalent to one Stellar. It is quoted as 1 XLM per X USD. For example, if the value of XLM/USD is 0.073264, then each stellar is worth 0.073264 US dollars.

Note: The price is considered from coinbase exchange.

XLM/USD Specifications

Spread

It is the athematic difference between the bid and the ask price managed by exchanges. It varies based on the type of execution model used by exchanges.

Spread on ECN: 450 pips

Spread on STP: 520 pips

Fee

A Fee is nothing but the commission on the trade. It is charged only on ECN accounts, and there is no fee on STP accounts.

Slippage

The difference between the trader’s intended price and the broker’s executed price is called slippage. It varies based on the volatility of the market and the exchange’s execution speed.

Trading Range in XLM/USD

The trading range is simply the illustration of the pip movement in a pair for different timeframes. With these values, a trader will know how long they have to wait for their trade to perform. Also, they can calculate approximate profit/loss on a trade beforehand.

Procedure to assess Pip Ranges

  1. Add the ATR indicator to your chart
  2. Set the period to 1
  3. Add a 200-period SMA to this indicator
  4. Shrink the chart so you can assess a large time period
  5. Select your desired timeframe
  6. Measure the floor level and set this value as the min
  7. Measure the level of the 200-period SMA and set this as the average
  8. Measure the peak levels and set this as Max.

XLM/USD Cost as a Percent of the Trading Range

The following tables represent the total cost variations for ECN and STP accounts. It represents how the costs vary with the change in volatility.

ECN Model Account

Spread = 450 | Slippage = 70 |Trading fee = 50

Total cost = Slippage + Spread + Trading Fee = 70 + 450 + 50 = 570

STP Model Account

Spread = 520 | Slippage = 70 | Trading fee = 0

Total cost = Slippage + Spread + Trading Fee = 70 + 520 + 0 = 590

Trading the XLM/USD

It is a known fact that cryptocurrency is a 24-hour market and is traded even during the weekend. However, this does not mean we can enter any time to pull out a trade from it. Though many traders do this, it is not a professional approach. Using the volatility and cost variation values, we can determine the ideal times to trade this pair.

The pip values seem to look really large, but it doesn’t indicate high volatility. This pair is as volatile as other major cryptocurrencies. From the cost table, it can be ascertained that the values are large for lower volatilities that decease as the volatility increases. So, traders who are concerned with high costs can trade during the times when the volatility high. However, they must be cautious about the risk involved in it. On the other hand, traders who wish to have an equilibrium between the two, then they may trade when the volatility is around the average values.

Furthermore, trading via limit and stop orders also reduces costs by a good number. In doing so, the slippage will be taken off of the total costs. So, in our example, the total cost would reduce by 70, which is quite a decent reduction.

Categories
Forex Assets

Trading The EOS/USD Crypto-Fiat pair & Understanding The Costs Involved

Introduction

EOS is a blockchain-based cryptocurrency, as well as a platform for decentralized app execution. This blockchain was developed despite the existence of Bitcoin and Ethereum to solve the problem of speed and scalability.

Understanding EOS/USD

The price of EOS/USD represents the value of the US Dollar equivalent to one EOS. It is quoted as 1 EOS per X USD. So, if the market price of EOS/USD is 2.5290, these many dollars are required to buy one EOS.

EOS/USD specifications

Spread

The difference between the bid & ask prices is known as spread. It changes with the execution model used brokers. Below are the spreads for both ECN & STP models for EOS/USD pair.

Spread on ECN: 10 pips | Spread on STP: 13 pips

Fee

A Fee is basically the commission on the trade. Note that there is a fee on ECN accounts, not STP.

Slippage

Due to high market volatility and the broker’s slower execution speed, slippage occurs. It is a difference in the price intended by the trader and price executed by the broker.

Trading Range in EOS/USD

The trading range is basically a tabular representation of the pip movement in EOS/USD for different timeframes. These numbers can be used traders as a risk management tool as determines the approx. profit/loss that can be made on a trade.

Procedure to assess Pip Ranges

  1. Add the Average True Range indicator to your price chart
  2. Then set the period to one
  3. Add a 200-period Simple Moving Average to this indicator
  4. You can assess a large time period by shrinking the price chart
  5. Select your desired timeframe
  6. Measure the floor level and set this value as the min
  7. Measure the level of the 200-period SMA and set this as the average
  8. Measure the peak levels and set this as Max.

EOS/USD Cost as a Percent of the Trading Range

The total cost comprising of the spread, slippage, and trading fee, changes with the volatility of the market. Hence, it is necessary for traders to position themselves to avoid paying high costs.

Below is a table representing the variation in the costs for different values of volatility.

ECN Model Account

Spread = 10 | Slippage = 3 |Trading fee = 5

Total cost = Slippage + Spread + Trading Fee = 3 + 10 + 5 = 18

STP Model Account

Spread = 13 | Slippage = 3 | Trading fee = 0

Total cost = Slippage + Spread + Trading Fee = 13 + 3 + 0 = 16

Trading the EOS/USD

The volatility and liquidity in this pair are similar to coins like Bitcoin and Ethereum. Hence, this makes EOS/USD a tradable pair. The spread in this pair is between 10-15 pips, which is extremely less compared to its volatility. Due to this, the costs reduce significantly. The highest cost percentage is only 18%.

However, we cannot ignore the fact about the volatility in this pair. This pair is pretty volatile and must be traded cautiously. It is recommended for traders to trade when the volatility of the market is around the average values. Furthermore, the costs can be reduced even further by placing orders as a limit or stop instead of the market. In doing so, the slippage will become zero and will reduce the total cost of the trade.

Categories
Forex Assets

Trading The XRP/USD Pair & Analysing The Costs Involved

Introduction

XRP/USD is the abbreviation for Ripple against the US Dollar. This pair is used for trading the Ripple cryptocurrency. Also, traders can trade Ripple against other fiat currencies.

Understanding XRP/USD

The value of XRP/USD represents the value of the US Dollar equivalent to one Ripple. It is quoted as 1 XRP per X USD. For example, if the value of XRP/USD is 0.1912, then it can be said that each Ripple is worth 0.1912 US Dollars.

XRP/USD specifications

Spread

Spread is the difference between the bid and the ask price quoted by the brokers. It varies based on the execution model used. Below are the ECN & STP spreads for the XRP/USD pair.

Spread on ECN: 50 pips | Spread on STP: 53 pips

Fee

The fee is the commission that is levied by the brokers on each trade. This fee is only applicable to ECN brokers, not STP brokers.

Slippage

When orders are executed on the ‘market,’ the price requested by the trader is different from the price given by the broker. This can happen either because of high market volatility or broker’s execution speed

Trading Range in XRP/USD

The minimum, average, and maximum pip movement in XRP/USD are given below. One can use these values to determine the profit/loss they could make in a given timeframe.

Procedure to assess Pip Ranges

  1. Add the ATR indicator to your chart
  2. Set the period to 1
  3. Add a 200-period SMA to this indicator
  4. Shrink the chart so you can assess a large time period
  5. Select your desired timeframe
  6. Measure the floor level and set this value as the min
  7. Measure the level of the 200-period SMA and set this as the average
  8. Measure the peak levels and set this as Max.

XRP/USD Cost as a Percent of the Trading Range

By applying the volatility values to the total cost of a trade, the variation in the costs for varying volatilities can be determined. Below are two tables representing the same.

ECN Model Account

Spread = 50 | Slippage = 3 |Trading fee = 5

Total cost = Slippage + Spread + Trading Fee = 3 + 50 + 5 = 58

STP Model Account

Spread = 53 | Slippage = 3 | Trading fee = 0

Total cost = Slippage + Spread + Trading Fee = 3 + 53 + 0 = 56

Trading the XRP/USD

While trading a pair, there are two factors that must be taken into consideration, namely, volatility and cost.

Volatility

The minimum in the 4H timeframe is 18 pips, while 142 pips are the maximum. And the average stands at 63. So, if a trader wishes to trade the 4H timeframe, then they should make sure that the current volatility is at or above the average volatility. This is because one can make money only when there is movement in the market.

Cost

Cost is not constant but varies as the volatility changes. The cost percentages in the minimum column are the highest compared to the average and maximum columns. This means that the costs are very high for highly volatile markets. Hence, it must be avoided.

The benefit with limit orders

Traders who trade with limit orders have an added benefit than those who trade with market orders. With limit orders, the total cost of the trade does not include the slippage. This hence brings down the cost of the trade to a decent extent.

This concludes the analysis of BCH/USD. We hope you found it interesting and useful. Stay tuned for more such asset analysis. Cheers!

Categories
Forex Assets

Analyzing The BCH/USD Crypto-Fiat Pair

Introduction

BCH/USD is a cryptocurrency abbreviated for the Bitcoin Cash against the US Dollar. This is the highest traded cryptocurrency in terms of volume. Also, it is a 24/7 market. Note that, Bitcoin Cash is not the same Bitcoin; both are two different cryptocurrencies.

Understanding BCH/USD

The price of BCH/USD represents the value of the US Dollar that makes up one Bitcoin Cash. It is quoted as 1 BCH per X USD. For example, if the value of BCH/USD is 234.06, these many US Dollars are required to purchase one Bitcoin Cash.

BCH/USD Specifications 

Spread

Spread is the difference between the bid and the ask price. Spread is different with different brokers and the type of execution model they use. Below are the ECN & STP values for the BCH/USD pair.

Spread on ECN: 400 pips (4.00 USD) | Spread on STP: 450 pips (4.50 USD)

Fee

A Fee is a commission paid on each position a trader takes and closes. This fee is charged only by ECN brokers. The slippage for each lot traded is a pip. The seems to be less because one lot accounts for only 1 BCH.

Slippage

Slippage is the difference between the price demanded by the trader and the price given by the broker. There are two reasons for slippage to occur:

  • High market volatility
  • Broker’s execution speed

Trading Range in BCH/USD

A Trading range is the representation of the volatility in BCH/USD for different timeframes. The numbers help in determining the approximate risk and reward on a trade.

Procedure to assess Pip Ranges

  1. Add the ATR indicator to your chart
  2. Set the period to 1
  3. Add a 200-period SMA to this indicator
  4. Shrink the chart so you can assess a large time period
  5. Select your desired timeframe
  6. Measure the floor level and set this value as the min
  7. Measure the level of the 200-period SMA and set this as the average
  8. Measure the peak levels and set this as Max.

BCH/USD Cost as a Percent of the Trading Range

A Fee is a variable that varies as the volatility of the market changes. Below are tables depicting the variation in the costs with the change in the volatility.

ECN Model Account

Spread = 400 | Slippage = 10 |Trading fee = 1

Total cost = Slippage + Spread + Trading Fee = 10 + 400 + 1 = 411

STP Model Account

Spread = 450 | Slippage = 10 | Trading fee = 0

Total cost = Slippage + Spread + Trading Fee = 10 + 450 + 0 = 460

Trading the BCH/USD

As mentioned, BCH/USD is currently the most traded cryptocurrency in the market. Therefore, one can expect enough volatility and liquidity. The volatility in BCH/USD is very high. For example, the minimum volatility on the 1H timeframe is 20, while the maximum is 118 on the same timeframe, which is five times the minimum. Hence, this makes this pair highly volatile and risky as well.

So, it is ideal for traders to trade when the volatility is between the average values. The volatility during such times is neither too high nor too low. Also, the costs aren’t too high. If traders wish to reduce costs even further, they could trade via limit or stop orders instead of market orders, as this would completely cut the slippage on the trade. The cost variations when the trades are executed either by limit or stop is given below.

ECN Model Account (Using Limit Orders)

Spread = 400 | Slippage = 0 |Trading fee = 1

Total cost = Slippage + Spread + Trading Fee = 0 + 400 + 1 = 401

Categories
Forex Signals

Bullish Bias in Gold Continues to Dominate – Who’s up for a bullish Signal?

On Tuesday, the precious metal gold continues to trade higher around 1,730 area in the wake of increased safe-haven appeal driven by COVID 19. Furthermore, the early-day upbeat remarks from the U.S. Task Force Briefings, news from the U.K. also recommend the coronavirus (COVID-19) is near to its expected high’s. The same could negatively influence the gold’s safe-haven appeal that has lately fired the bullion to the highest since November 2012.

The U.S. President Donald Trump is showing a willingness to support the USA fight against the coronavirus (COVID-19), which eventually seems to help the risk-tone. This time, the Fed will elevate about $2.3 trillion to promote small and medium-sized companies, districts and workers harmed by the coronavirus break.

Apart from this, the recent recovery in the Asian equity and continued rise in the U.S. 10-year Treasury yields, which is currently near 0.773%, provided support to the oil prices recover. The better-than-expected Chinese trade data also give confidence to the oil buyers.


Technically, the XAU/USD has the potential to go long, which is why we have opened a buying signal at 1728.27 with a stop loss of around 1718.27 and take a profit of 1738.27. The bullish channel likely keeps the gold prices higher, while the RSI and MACD are suggesting a continuation of a bullish bias in the gold. On the higher side, gold has the potential to go after 1,743 level today.

Buying Price: 1728.27
Take Profit 1738.27
Stop Loss 1718.27
Risk/Reward 1
Profit & Loss Per Standard Lot = -$1000/ +$1000
Profit & Loss Per Micro Lot = -$100/ +$100

Categories
Forex Assets

‘LTC/USD’ – Understanding The Crypto/Fiat Pair & Trading Costs Involved

Introduction

Cryptocurrencies are traded in pairs by pairing them with a fiat currency. Always, the cryptocurrency is written on the left and the fiat currency on the right. LTC/USD is a cryptocurrency, which is an abbreviation for the Litecoin versus the US Dollar. Like the Bitcoin and Ethereum, Litecoin is extensively traded in the exchange market.

Understanding LTC/USD

The market price of LTCUSD depicts the value of the US Dollar, which is equivalent to 1 Litecoin. It is quoted as 1 LTC per X USD. For example, if the value of LTCUSD is 41.69, then one Litecoin is worth 41.69 US Dollars.

LTC/USD specifications

Spread

Spread is the difference between the bid and the ask price in the market, where bid price is given considered when shorting a pair and ask price when going long on a pair. The varies from broker to broker. It also differs based on the type of execution model used. Below are the spreads for the LTC/USD pair for both ECN & STP accounts.

  • Spread on ECN: 50 pips (0.5 USD)
  • Spread on STP: 60 pips (0.6 USD)

Fee

ECN brokers charge some commission on every position a trader opens and closes. The fee for ECN accounts is about $0.18 per standard lot, which corresponds to 18 pips.

Slippage

Slippage is the difference between the price asked by the user and the price given by the broker. There is this difference due to two reasons – High market volatility & broker’s execution speed.

Trading Range in LTC/USD

Below is the trading range table for the LTCUSD, which represents the minimum, average, and maximum volatilities of a pair for different timeframes using the ATR indicator. These values can prove to be helpful for assessing one’s profit/loss on a trade.

Procedure to assess Pip Ranges

  1. Add the ATR indicator to your chart
  2. Set the period to 1
  3. Add a 200-period SMA to this indicator
  4. Shrink the chart so you can assess a large time period
  5. Select your desired timeframe
  6. Measure the floor level and set this value as the min
  7. Measure the level of the 200-period SMA and set this as the average
  8. Measure the peak levels and set this as Max.

LTC/USD Cost as a Percent of the Trading Range

The cost as a percent of the trading range represents the variation of cost on a trade based on the change in the volatility of the market. And these variations are indicated as a percentage. Using the magnitude of the percentages, we shall determine the ideal times of the day to trade this coin.

ECN Model Account

Spread = 50 | Slippage = 5 |Trading fee = 18

Total cost = Slippage + Spread + Trading Fee = 18 + 50 + 5 = 73

STP Model Account

Spread = 60 | Slippage = 5 | Trading fee = 0Total cost = Slippage + Spread + Trading Fee = 5 + 60 + 0 = 65

Trading the LTC/USD

LTCUSD is a crypto-fiat pair that has got enough volatility and liquidity to trade in the market. LTC is the fourth highest traded coin in terms of volume. However, it is not apt to trade anytime during the day. There are ways through which one reduces their costs for the same trade.

In the above table, if the percentages are high, then the costs are very high and vice versa. So, the cost is more for low volatile markets and less for high volatile markets. If you are a scalper or short-term trader, you may trade when the volatility is high as the profit margin is small, and you can avoid high costs.

Positional traders – these traders usually aim for large movements, and high costs become a little insignificant for their big pip movements. So, such traders may trade when the volatility is around the average values. Finally, it is not advisable to trade during low volatilities because the costs are high, and there is barely any movement in the market.

Slippage is a variable in total costs that can be eliminated by placing orders as ‘limit’ or ‘stop.’ We hope you found this analysis on LTCUSD useful. Stay tuned for more informative content. Cheers.

Categories
Forex Assets

Exploring The ETH/USD Pair & The Relative Costs Involved

Introduction

Trading cryptocurrencies is similar to trading in the Forex market, but the only difference being, both base and quote currencies are not fiat currencies. In crypto pairs, one of them is a virtual currency, and the other is a fiat currency. ETH/USD is a cryptocurrency pair, which is an abbreviation for Ethereum against the US Dollar. Participants can trade them via Forex brokers or through cryptocurrency exchanges.

Understanding ETH/USD

The value of ETHUSD represents the value of the US Dollar that is required to purchase one. It is quoted as 1 ETH per X USD. For instance, if the market price of ETHUSD is 170.46, then around 170 US Dollars are needed to buy one ETH.

ETH/USD Specifications 

Spread

The difference between the bid price and the ask price marked by the brokers is called the spread. Spread is the main source of revenue for brokers. Spread on major and minor currency pairs is typically very low. But, in cryptocurrencies, the spread is usually high. Below are the spread values of ECN & STP accounts for the ETH/USD pair.

  • Spread on ECN: 200 pips (2 USD)
  • Spread on STP: 250 pips (2.5 USD)

Fee

A Fee is applicable only on ECN accounts and the pro accounts of brokers. Typically, it is between 40-50 pips.

Slippage

Slippage is the difference between the price at which a trader opened a position and the price given by the broker. Due to the high volatility of the market and slow execution by the brokers, slippage occurs.

Trading Range in ETH/USD

Below is the representation of the volatility from minimum to maximum for ETHUSD in different timeframes. These numbers are very helpful in assessing one’s risk on a trade.  

Procedure to assess Pip Ranges

  1. Add the ATR indicator to your chart
  2. Set the period to 1
  3. Add a 200-period SMA to this indicator
  4. Shrink the chart so you can assess a large time period
  5. Select your desired timeframe
  6. Measure the floor level and set this value as the min
  7. Measure the level of the 200-period SMA and set this as the average
  8. Measure the peak levels and set this as Max.

ETH/USD Cost as a Percent of the Trading Range

With the application of the volatility values with the total cost on the trade, the variation in the cost of a trade can be assessed. To do so, the ratio between the total cost and volatility is taken and expressed in terms of a percentage.

The magnitude of the costs represents how high the costs are. If the percentages are large, it indicates high costs and vice versa.

ECN Model Account

Spread = 200 | Slippage = 15 |Trading fee = 45

Total cost = Slippage + Spread + Trading Fee = 15 + 200 + 45 = 260

STP Model Account

Spread = 250 | Slippage = 15 | Trading fee = 0

Total cost = Slippage + Spread + Trading Fee = 15 + 250 + 0 = 265

Trading the ETH/USD

Cryptocurrencies can be traded just like any other asset. In ETHUSD, the volatility is good enough for both short-term and long-term traders. Though the volatility values appear to be high, they don’t have a large reflection on your profit/loss. This is because, unlike forex currencies where one lot was equivalent to 100,000 units of the base currency, one lot in ETHUSD represents only 10 units of ETH.

From the above volatility table, it is seen that the costs are more when the volatility of the market is low and is less when the volatility is high. So, trading this pair majorly depends on the type of trader you are. For example, scalpers might trade when the volatility is high to get the greatest number of pips in a short amount of time. If they do so, they can get the benefit of lower costs.

In general, costs on a trade can be reduced by placing orders as ‘limit’ or ‘stop.’ In such orders, the slippage becomes nil. Hence, the total cost would be brought down to a good extent. The cost variations for limit orders or stop orders are given below for your reference and comparison.

ECN Model Account (Using Limit Orders)

Spread = 200 | Slippage = 0 |Trading fee = 45

Total cost = Slippage + Spread + Trading Fee = 0 + 200 + 45 = 245

Categories
Forex Assets

BTC/USD – Trading Costs Involved While Trading This Crypto-Fiat Pair

Introduction

Apart from currencies pairs, exchanges allow trading of cryptocurrencies as well. Cryptocurrencies can be bought and sold in the exchange market through Forex brokers. Trading cryptocurrencies can be closely related to Forex trading but not stock trading. This is because cryptos are traded as pairs and not individually. In this series, we will be analyzing the trading costs involved while trading cryptocurrencies that are paired with fiat currencies (Ex: USD).

BTC/USD is a cryptocurrency pair where BTC stands for Bitcoin, and USD stands for US Dollar. This pair is traded through Forex brokers as CFDs, or through cryptocurrency exchanges where cryptos are bought and sold exclusively.

Understanding BTC/USD

The price of BTC/USD in the exchange market represents the value of the US Dollar equivalent to one 1 Bitcoin. It is quoted as 1 BTC per X USD. For example, if the current market price of BTCUSD is 7356.50, then it can be said that one Bitcoin is equal to the US $7356.50.

BTC/USD specifications

Spread

Spread is the difference between the bid and the ask price in the exchange market. It is determined by the brokers and exchanges, and it hence varies from time to time. Typically, the spreads for trading cryptocurrencies are very high. In recent years, the spread of coins having two decimal places is between 1500-6000 pips. The approx. spread on ECN and STP accounts are given below.

  • Spread on ECN: 3000 pips (30 USD)
  • Spread on STP: 3050 pips (30.5 USD)

Fees

The fee is simply the commission paid for the position a trader takes. It is charged only for ECN and Pro accounts and not for STP accounts. For our analysis, we shall keep the fee at 45 pips.

Slippage

Slippage is the difference between the price at which a client executed trade and the price which was actually given by the broker. This difference occurs either because of high market volatility or speed of trade execution.

Trading Range in BTC/USD

The trading range is the representation of the pip movement in the pair for different timeframes. The values are calculated using the average true range indicator. And the procedure to assess it is given below as well.

Procedure to assess Pip Ranges

  1. Add the ATR indicator to your chart
  2. Set the period to 1
  3. Add a 200-period SMA to this indicator
  4. Shrink the chart so you can assess a large time period
  5. Select your desired timeframe
  6. Measure the floor level and set this value as the min
  7. Measure the level of the 200-period SMA and set this as the average
  8. Measure the peak levels and set this as Max.

BTC/USD Cost as a Percent of the Trading Range

Cost is a factor that varies with the change in the volatility of the market. By finding the ratio between the total cost and volatility, the variation in the costs is measured.

ECN Model Account

Spread = 3000 | Slippage = 25 |Trading fee = 45

Total cost = Slippage + Spread + Trading Fee = 25 + 3000 + 45 = 3070

STP Model Account

Spread = 3050 | Slippage = 25 | Trading fee = 0

Total cost = Slippage + Spread + Trading Fee = 25 + 3050 + 0 = 3075

The Ideal way to trade the BTC/USD

It is a general impression that trading cryptos are very risky because of its high volatility. But it is not completely true. To clear the misconception, consider the following example.

The pip value of BTC/USD per lot is 0.01 USD. That is, for every pip up or down, you will gain or lose 0.01 USD. The average pip movement in the 1H timeframe is 9100 pips. So, if you trade one lot of BTC/USD, you will win or lose about $0.01 x 9100 = $91 in a time frame of one hour. Hence, though the pip movement seems to be high, the profit/loss remains within decent boundaries.

Considering the cost variation in the above tables, it can be inferred that the costs are more for low volatile markets and less for a highly volatile market. But, the cost for average volatility acts as a median. Hence, trading when the volatility is around the average values is recommended. Furthermore, costs can be lowered by trading via limit orders instead of market orders. In doing so, the slippage on the trade will be nullified and will not be included in the total cost. In the above example, the total cost would reduce by 25 pips.

That’s about the trading costs involved while trading the BTC/USD pair. We will be discussing more Crypto/Fiat pairs in the upcoming articles. In case of any queries, let us know in the comments below. Cheers!

Categories
Forex Market Analysis

Gold Choppy Session Continues – Ascending Triangle Supports! 

On Wednesday, gold is keeping bullish momentum over rising coronavirus death toll hammered risk sentiment. At the same time, the trader awaits the announcement of the U.S. Federal Reserve’s policy conference minutes for hints on additional stimulus measures. Gold edged 0.1% to $1,650.40 during the U.S. session. 

One of the reasons behind gold’s bullish bias is ongoing tensions around the globe. The UK PM Boris Johnson is in ICU, which is driving uncertainty from the British markets. Moreover, Japan’s Prime Minister Abe has announced a state of emergency in Tokyo and 6-other provinces and plans to control the economic fallout of COVID-19 as well as a huge fiscal stimulus package. The package, worth ¥16.5trn, equates to 20% of GDP. 

Meantime, European leaders are discussing policy tool-kit, which has probably worth up to €540bn (3.8% of GDP). However, it will be interesting to get a broad agreement between European leaders on the debt mutualization plan since the very nation is introducing stimulus plans, which makes their currencies weaker. Consequently, traders switch to precious metal gold. 

Daily Support and Resistance

Support Resistance

1,628.08 1,687.6

1,592.25 1,711.3

1,532.73 1,770.83

Pivot Point 1,651.78

Gold prices are trading with a bullish bias around 1,649 level, having supported over previously violated ascending triangle resistance become support level of 1,636. We can see a series of neutral candles over 1,636 level, which is suggesting indecision among traders. However, the upward trendline and 50 periods EMA on the 4 hour time is demonstrating a chance of bullish trend continuation in the market. 

On the higher side, gold may find immediate resistance around 1,655, and bullish breakout of this may offer buying until 1,671. While support continues to hold around 1,636. Let’s consider taking bullish trades over 1,640 levels to target 1,662 and 1,671. Good luck!

Categories
Forex Assets

Trading The USD/HRK Forex Currency Pair

Introduction

USDHRK is the abbreviation for the United States Dollar against the Croatian Kuna. Thw USDHRK is an emerging currency pair. Unlike the major/minor currency pair, this pair has high volatility and low liquidity. The volume is less too. Here, USD is the base currency, and HRK is the quote currency.

Understanding USD/HRK

The value of this pair determines the value of HRK equivalent to one USD. It is simply quoted as 1 USD per X HRK. For example, if the value of this pair is 6.6123, then 6.6123 Kuna is required to buy one US Dollar.

Spread

Spread is the way through which retail brokers make money from their clients. And it is through the difference between the bid price and the ask price in the market. This value is set by the brokers and varies from the type of execution model they use.

ECN: 25 pips | STP: 30 pips

Fees

A fee is basically the commission that you are liable to pay one each trade you make. This is similar to the one that is levied by stockbrokers. However, the fee is charged only by ECN brokers. There is no fee as such in STP accounts.

Slippage

In market orders, when you execute a trade, you don’t get the exact executed price. The actual executed price is different. This difference between the prices is what is known as slippage. Market volatility and the broker’s execution speed are two factors that affect the slippage on the trade.

Trading Range in USD/HRK

The minimum, average, and maximum volatility can be used to determine the risk of a trade. The profit/loss can be simply calculated by multiplying the volatility value with the pip value (per standard lot).

Procedure to assess Pip Ranges

  1. Add the ATR indicator to your chart
  2. Set the period to 1
  3. Add a 200-period SMA to this indicator
  4. Shrink the chart so you can assess a large time period
  5. Select your desired timeframe
  6. Measure the floor level and set this value as the min
  7. Measure the level of the 200-period SMA and set this as the average
  8. Measure the peak levels and set this as Max.

USD/HRK Cost as a Percent of the Trading Range

The total cost of the trade can be found as the sum of spread, slippage, and trading fee. This total cost is variable and is dependent on the volatility of the market. Below is the representation of the variation in the costs for different volatilities and timeframes.

ECN Model Account

Spread = 25 | Slippage = 3 |Trading fee = 3

Total cost = Slippage + Spread + Trading Fee = 3 + 25 + 3 = 31

STP Model Account

Spread = 30 | Slippage = 3 | Trading fee = 0

Total cost = Slippage + Spread + Trading Fee = 3 + 30 + 0 = 33

The Ideal way to trade the USD/HRK

The percentages in the above tables depict how the cost varies on the trade. The higher the value, the higher is the cost of the trade. Similarly, the smaller the percentages, the lower is the costs.

From the above tables, it can be ascertained that the costs are high for low volatilities, as the percentage values are high in the min column. And the costs are lower for high volatilities. So, the ideal way to trade this pair is dependent on the type of trader you are. For instance, a trader who is particular about costs may trade when the volatility of the currency pair is high. The traders who wish to keep a balance between the two may trade during those times when the volatility is around the average values.

Moreover, one may reduce their costs by trading using limit or stop orders instead of market orders. This will cut off the slippage factor on the trade and bring down the total costs pretty much. An example of the same is given below.

Spread = 25 | Slippage = 0 |Trading fee = 3

Total cost = Slippage + Spread + Trading Fee = 0 + 25 + 3 = 28

Categories
Forex Assets

Analyzing The USD/MAD Forex Currency Pair

Introduction

USD/MAD is the abbreviation for the US dollar against the Moroccan Dirham. This pair is classified as an emerging currency pair in the forex market. In this pair, USD is the base currency, and MAD is the quote currency. Typically. It is seen that this pair has pretty low volatility and liquidity. However, it can still be traded under certain conditions.

Understanding USD/MAD

The market price of this currency pair determines the value of MAD that is equivalent to one USD. For instance, if the current market price of USD/MAD is 9.5867, then these many Moroccan Dirhams are required to purchase one USD.

Spread

The difference between the bid price and the ask price is referred to as the spread. This is the primary way through which brokers generate revenue. Spread is a variable and is different with different brokers. It also differs based on the execution model used by the broker.

ECN: 35 pips | STP: 40 pips

Fees

The commission paid on each trade is the fee on that trade. Note that, the concept of the fee is only ECN accounts and not STP accounts. The fee on ECN accounts is typically between 5-10 pips.

Slippage

Slippage is the difference between the price intended by the client and the price that is actually executed by the broker. There is this difference due to two reasons:

  • Market’s volatility
  • Broker’s execution speed

Trading Range in USD/MAD

The trading range is the tabular representation of the volatility of the market in different timeframes. These values help in assessing the minimum, average, and maximum profit/loss in six different timeframes.

Procedure to assess Pip Ranges

  1. Add the ATR indicator to your chart
  2. Set the period to 1
  3. Add a 200-period SMA to this indicator
  4. Shrink the chart so you can assess a large time period
  5. Select your desired timeframe
  6. Measure the floor level and set this value as the min
  7. Measure the level of the 200-period SMA and set this as the average
  8. Measure the peak levels and set this as Max.

USD/MAD Cost as a Percent of the Trading Range

The total cost of the trade is calculated by adding up the slippage, spread, and the trading fee. It is not constant but varies based on the volatility of the market. Below are tables that represent how costs vary for different timeframes and volatilities.

ECN Model Account

Spread = 35 | Slippage = 3 |Trading fee = 3

Total cost = Slippage + Spread + Trading Fee = 3 + 35 + 3 = 41

STP Model Account

Spread = 40 | Slippage = 3 | Trading fee = 0

Total cost = Slippage + Spread + Trading Fee = 3 + 40 + 0 = 43

The Ideal way to trade the USD/MAD

Starting off from the trading range table, we can see that the volatility of this pair is quite high. The spread, too, is higher than other emerging pairs. So, it is not really ideal to trade at any time in 24 hours.

When we have a look at the cost percentage tables, we can see that the percentages are high in the minimum column, and low in the max column. This implies that the costs are high during low volatilities, and costs are low during high volatilities. So, the best time to trade this pair is when the volatility is around the average values because this assures decent volatility as well as affordable costs.

Furthermore, the costs can be reduced by placing orders as ‘limit’ instead of ‘market’. In doing so, the slippage on the total costs will be made zero. So, spread and trading fee will be the only factors involved in calculating the total cost.

Categories
Forex Assets

Understanding The USD/TWD Forex Currency Pair

Introduction

USDTWD is the abbreviation for the US dollar against the New Taiwan Dollar. Due to the involvement of Taiwan in this pair, this pair is classified as an Asian emerging currency pair. Here, the US Dollar is the base currency, and the New Taiwan Dollar is the quote currency.

Understanding USD/TWD

The TWD required to purchase one USD is determined by the price on the exchange rate. It is simply quoted as 1 USD per X TWD. For example, if the price of this pair was 25.856, a rounded figure of 26 TW Dollars are needed to buy one US Dollar.

Spread

The spread is a type of fee that is paid to the broker on each trade. The amount to be paid depends on the lot size traded and also the volatility of the market. It is simply the difference between the bid price and the ask price on the exchange board. The bid and ask price is typically different from different brokers. It also varies based on the execution model implemented by the broker.

ECN: 27 pips | STP: 30 pips

Fees

The commission that a broker charges on each of your trade is the fee. This, too, depends on the type of execution model. Note that there is no fee on STP accounts. However, this is covered by higher spreads.

Slippage

In market orders, one does not get the exact price at which they triggered their buy/sell button. It varies due to the market volatility and the broker’s execution speed. This could be in favor of or against the client.

Trading Range in USD/TWD

The trading range is a range of pip movement values in different timeframes. In simple terms, it tells the number of pips the currency pair has moved in a given timeframe. For example, if the minimum volatility value on the 1H timeframe is five pips, then it means that this pair moves at least five pips in about an hour or so. These values can be helpful in figuring the approximate P/L on a trade, even before placing the trade.

Procedure to assess Pip Ranges

  1. Add the ATR indicator to your chart
  2. Set the period to 1
  3. Add a 200-period SMA to this indicator
  4. Shrink the chart so you can assess a large time period
  5. Select your desired timeframe
  6. Measure the floor level and set this value as the min
  7. Measure the level of the 200-period SMA and set this as the average
  8. Measure the peak levels and set this as Max.

USD/TWD Cost as a Percent of the Trading Range

From the above table, one may even determine the total cost variation in trade in different timeframes for different volatilities. With these values, we can, in turn, determine the ideal way to trade this currency pair.

ECN Model Account

Spread = 27 | Slippage = 3 |Trading fee = 3

Total cost = Slippage + Spread + Trading Fee = 3 + 27 + 3 = 33

STP Model Account

Spread = 30 | Slippage = 3 | Trading fee = 0

Total cost = Slippage + Spread + Trading Fee = 3 + 30 + 0 = 33

The Ideal way to trade the USD/TWD

The magnitude of the percentages in the table represents how high or low is the cost of the trade. It is proportional to the cost of the trade. In the below table, we can clearly see that the costs are high in the min column, depicting high costs for lower volatilities. Similarly, low costs for high volatilities.

Also, the costs are pretty high on lower timeframes compared to the higher timeframes. So, this definitely is not the best pair to trade for scalpers. With an investment point of view, it could prove to be the best pair irrespective of the timeframe you’re trading. Talking about a positional trader, it is ideal to trade during those times when the volatility of the market is around the average values.

Another simple way to bring your costs down is by placing limit or stop orders instead of market orders. This considerably brings down the cost of the trade as the slippage in such orders is nil.

Below is an example of the cost percentages when the slippage is made zero.

Spread = 30 | Slippage = 0 | Trading fee = 0

Total cost = Slippage + Spread + Trading Fee = 0 + 30 + 0 = 30

Categories
Forex Assets

Trading Costs Involved While Trading The USD/PHP Forex Pair

Introduction

USD/PHP is the abbreviation for the US dollar versus the Philippine Peso. Since Philippine is involved in the pair, this classified under the Asian emerging pairs. In this pair, the USD is the base currency and the PHP is the quote currency.

Understanding USD/PHP

The current market price determines the price of PHP that is equivalent to one US dollar. It is simply quoted as 1 USD per X PHP. For example, if the price of this pair was 50.96, then around 51 pesos would be required to buy one US dollar.

Spread

The difference between the bid price and the ask price is referred to as the spread. This value a variable that varies from broker to broker as well as the type of execution model used by the brokers.

ECN: 3 pips | STP: 4 pips

Fees

The fee is a synonym for commission. It is levied on the ECN accounts only and not STP accounts.

Slippage

Slippage is some sort of a fee that is paid only on market orders. Slippage is the pip difference between the trader’s requested price and the price that was given by the broker. There is variation primarily due to two reasons – Market’s volatility & Broker’s execution speed

Trading Range in USD/PHP

Wanting to know how much could be your minimum average and maximum profit/loss of a trade in a given timeframe? Below is a table that will help you with it. With the pip movement values in the table, one can determine their risk on the trade. All you have to do is, multiply the volatility value with the pip value ($19.24). This will yield the value for one standard lot size.

 Procedure to assess Pip Ranges

  1. Add the ATR indicator to your chart
  2. Set the period to 1
  3. Add a 200-period SMA to this indicator
  4. Shrink the chart so you can assess a large time period
  5. Select your desired timeframe
  6. Measure the floor level and set this value as the min
  7. Measure the level of the 200-period SMA and set this as the average
  8. Measure the peak levels and set this as Max.

USD/PHP Cost as a Percent of the Trading Range

Apart from the profit/loss in a trade, we can even determine the cost variation in altering volatilities. To do so, we have taken the ratio between the volatility value and the total cost and represented it as a percentage.

ECN Model Account

Spread =3 | Slippage = 3 |Trading fee = 3

Total cost = Slippage + Spread + Trading Fee = 3 + 3+ 3 = 9

STP Model Account

Spread = 4 | Slippage = 3 | Trading fee = 0

Total cost = Slippage + Spread + Trading Fee = 3 + 4 + 0 = 7

The Ideal way to trade the USD/PHP

Firstly, from the trading range table, we can infer that the volatility of this pair is feeble. But, note that, the small pip movement values do not mean you’ll have to trade large quantities to make a good profit. Since the pip value (per standard lot) is $19.24, even a 0.1 pip will generate $1.924.

Coming to the cost table, the percentages here are too high, especially in the min column. So it is recommended to not trade during low volatilities as It will have high costs. So, to reduce costs, it is ideal to trade when the volatility of the market is on the higher side. As far as the risk involved in highly volatile markets is concerned, you may cut down your lot sizes.

To simplify it even further, you can bring down your costs by executing your trades as limit/stop orders instead of market orders. This eliminates the slippage involved in the calculation of total costs on the trade.

Categories
Forex Assets

Analyzing The USD/KRW Forex Currency Pair

Introduction

USDKRW is the abbreviation for the US Dollar against the South Korean Won. This pair comes under the branch of emerging currency pairs. Here, the US Dollar, being on the left, is the base currency, and the KRW is the quote currency.

Understanding USD/KRW

The market price of this determines the value of KRW equivalent to the US $1. It is quoted as 1 USD per X KRW. So, if the market price of USDINR is 1199.70, these many units of the quote currency are required to purchase one unit of the base currency.

Spread

The algebraic difference between the bid price and the ask price is referred to as the spread. This is the primary source through which brokers generate their revenue. The spread varies from broker to broker and also the way through which they execute the trades.

ECN: 24 pips | STP: 25 pips

Fees

A fee is nothing but the commission that you pay to the broker on each trade. It is similar to that one that is paid to stock market brokers. Below is the fee on ECN and STP accounts.

ECN – 5-10 pips | STP – 0 pips

Slippage

Slippage is the variation in the price that was intended by the trade and price that was executed by the broker. Market volatility and the broker’s execution speed are the sole reasons for slippage to occur.

Trading Range in USD/KRW

A trading range is a table of volatility values in different timeframes. It shows the minimum, average, and maximum pip movement in USDKRW.

Procedure to assess Pip Ranges

  1. Add the ATR indicator to your chart
  2. Set the period to 1
  3. Add a 200-period SMA to this indicator
  4. Shrink the chart so you can assess a large time period
  5. Select your desired timeframe
  6. Measure the floor level and set this value as the min
  7. Measure the level of the 200-period SMA and set this as the average
  8. Measure the peak levels and set this as Max.

USD/KRW Cost as a Percent of the Trading Range

This an application to the above range table. Here, we determine the variation in the costs for changing volatility and a set of timeframes. With this, we can figure out the ideal times of the day to enter and exit this currency pair.

ECN Model Account

Spread = 19 | Slippage = 3 |Trading fee = 3

Total cost = Slippage + Spread + Trading Fee = 3 + 24 + 3 = 30

STP Model Account

Spread = 20 | Slippage = 3 | Trading fee = 0

Total cost = Slippage + Spread + Trading Fee = 3 + 25 + 0 = 28

The Ideal way to trade the USD/KRW

Though the Forex market is a 24-hour market, it is not really ideal to trade anytime during the day. This is due to the changes in the costs as the volatility changes.

From the table, we can observe that the cost percentage values are higher in the minimum column and comparatively lower in the maximum column. This means that the costs are high during less volatile markets, and low for highly volatile markets. So, choosing the right time to trade is dependent on the type of trader you are.

For instance, if a trader is concerned about the costs and ignorant of the volatility, then he may trade the market during high volatilities. But, if you’re a trader who’s concerned about both the factors, then you may trade during those times when the volatility of the market is around the average values. This will provide you with decent volatility with pretty low costs as well.

There is another way through which one can lower their cost much more. And this is through taking trades using limit orders instead of market orders. Considering the above-mentioned example, the total cost now would be reduced by three pips.

Categories
Forex Assets

Understanding The USD/INR Forex Currency Pair

Introduction

USD/INR is the abbreviation for the US Dollar against the Indian Rupee. This Asian pair is classified as an emerging currency pair. Here, the US Dollar is the base currency, and the INR is the quote currency.

Understanding USD/INR

The price in the market determines how much the Indian Rupee worth with respect to the US Dollar is. It is quoted as 1 USD per X INR. So, if the market price of USDINR is 71.46, then around ₹71 is required to purchase $1.

Spread

Spread in foreign exchange, is the difference between the bid and the ask price of the currency pair. This is the primary way through which brokers generate revenue. Spread is typically decided by the brokers itself. And it varies based on the type of execution model implemented by the brokers.

ECN: 19 pips | STP: 20 pips

Fees

Out of the two types of execution models, there is a fee, only on ECN accounts. Typically, there is no fee on STP accounts. However, this is compensated by higher spreads.

Slippage

Slippage is the difference between the price demanded by the user and the price he received by the broker. There is always this difference when orders are executed by the market. There are a couple of reasons for its occurrence.

  • Broker’s execution speed
  • Market’s volatility

Trading Range in USD/INR

The minimum, average, and maximum volatility of the currency pair in different timeframes are represented in the below trading range table. These values help us calculate the profit or loss that can be made in a given amount of time. Hence, this table is a great risk management tool.

 Procedure to assess Pip Ranges

  1. Add the ATR indicator to your chart
  2. Set the period to 1
  3. Add a 200-period SMA to this indicator
  4. Shrink the chart so you can determine a significant period
  5. Select your desired timeframe
  6. Measure the floor level and set this value as the min
  7. Measure the level of the 200-period SMA and set this as the average
  8. Measure the peak levels and set this as Max.

USD/INR Cost as a Percent of the Trading Range

The costs as a percent of the trading range are the representation of the variation of the costs for different volatilities and timeframes. Understanding this cost variation helps in determining the ideal times of the day to trade this currency pair, which shall be discussed in the subsequent sections.

ECN Model Account

Spread = 19 | Slippage = 3 |Trading fee = 3

Total cost = Slippage + Spread + Trading Fee = 3 + 19 + 3 = 25

STP Model Account

Spread = 20 | Slippage = 3 | Trading fee = 0

Total cost = Slippage + Spread + Trading Fee = 3 + 20 + 0 = 23

The Ideal way to trade the USD/INR

Before getting into it, let’s first comprehend the below tables. The greater the values of the percentage, the greater is the cost of the trade. Similarly, the lower the values, the lesser is the total cost of the trade. Also, costs are inversely proportional to the volatility of the market.

From the above tables, we can ascertain that the values are higher in the min column, and gradually increases in the up to the max column. This means that the costs are high when the volatility of the market is low. The costs are neither too high nor too low for average volatility. Hence, if you are a trader who requires moderate volatility and low costs, then you may trade when the volatility of the market is around the average values.

Note: The current volatility of the market can be obtained from the ATR indicator.

There is another way through which one can considerably reduce their costs. By executing trades via limit/stop orders instead of market orders, the slippage on the trade will be waived off from the total costs. This brings down the costs significantly. For example, if the slippage on the trade is five pips, then five pips will be reduced in calculating the total costs on the trade.

Categories
Forex Assets

Analyzing the USD/CNH Forex Currency Pair

Introduction

USDCNH is the tick symbol for the US Dollar versus the Chinese Yuan. This Asian currency pair is classified as an emerging currency pair. Here, the US Dollar is the base currency, and the CNH is the quote currency.

Understanding USD/CNH

The price of this pair as a whole determines the value of CNH equivalent to one USD. It is quoted as 1 USD per X CNH. For example, if the price of this pair currently is 6.4728, then these many Yuans are required to buy one US Dollar.

Spread

The spread is the difference between the bid price and the ask price of a currency pair. Since the bid and ask price is set by the brokers, spread varies from broker to broker. The approximate spread on ECN and STP accounts is given below.

ECN: 23 pips | STP: 24 pips

Fees

A fee is nothing but the commission that is paid to the broker on each trade. This, too, is different from broker to broker. The fee on STP accounts is nil, while there are few pips of fee for ECN accounts.

Slippage

Slippage is another type of fee which is applied for market orders. It is a pip difference between the price requested by the trader to be executed and the price that is actually given to the trade. There is this difference due to the market’s volatility and the broker’s execution speed.

Trading Range in USD/CNH

With the table given below, one can assess their risk on each trade. This table represents the range of pip values from minimum to maximum for different timeframes. Multiplying this with the value per pip yields the amount one will be risking on their trade.

Procedure to assess Pip Ranges

  1. Add the ATR indicator to your chart
  2. Set the period to 1
  3. Add a 200-period SMA to this indicator
  4. Shrink the chart so you can determine a large period
  5. Select your desired timeframe
  6. Measure the floor level and set this value as the min
  7. Measure the level of the 200-period SMA and set this as the average
  8. Measure the peak levels and set this as Max.

USD/CNH Cost as a Percent of the Trading Range

The trading range values can be used to determine the variation in the costs of the trade for different volatilities as well. Below are two tables (for ECN and STP) that depict how the cost varies as the volatility and timeframes are changed.

ECN Model Account

Spread = 23 | Slippage = 3 |Trading fee = 3

Total cost = Slippage + Spread + Trading Fee = 3 + 23 + 3 = 29

STP Model Account

Spread = 24 | Slippage = 3 | Trading fee = 0

Total cost = Slippage + Spread + Trading Fee = 3 + 24 + 0 = 27

The Ideal way to trade the USD/CNH

This currency pair is a little, unlike the other emerging currency pairs. As in, it has pretty good liquidity and volatility. It is comparable to a cross-currency pair. So, it can be traded in a similar way how to cross currencies are traded.

From the table, we can ascertain that the magnitude of the percentages is higher for lower volatilities and comparatively lower for high volatilities. And the median costs lie in an average column.

If you are a trader who requires low costs, then you will have to bear with the high volatility. Or if you’re a trader who needs low volatility, then you must be able to bear with high costs. Finally, traders who wish to have a balance between the two, then they may trade during those times when the volatility is around the average values (in the trading range table).

Inculcating strategies that require limit order and not market orders can help reduce costs significantly. This is because limit orders do not consider the slippage factor in calculating the total costs. That is, in our example, the total cost of each trade would reduce by three pips.

Categories
Forex Assets

Assessing The USD/UAH Exotic Forex Currency Pair

USD/UAH is the abbreviation for the currency pair US dollar against the Ukrainian Hryvnia. It is classified as an emerging currency pair. The volatility, liquidity, and volume in this pair, is significantly low. In this pair, the US dollar is the base currency, and UAH is the quote currency.

Understanding USD/UAH

The value of the pair as a whole represents the value of UAH that is equivalent to one US dollar. It is quoted as 1 USD per X UAH. For instance, if the value of USDUAH is 24.19, then about 24 Hryvnias are required to purchase one US dollar.

Spread

The difference between the bid price and the ask price is referred to as the spread. Spread usually varies from broker to broker, and also on the execution model used by the brokers.

ECN: 20 pips | STP: 23 pips

Fees

As the name pretty much suggests, the fee is the charge paid to the broker on each trade. Below is the fee on ECN and STP accounts.

ECN – 5-10 pips | STP – 0 pips

Slippage

Due to the changes in the volatility and the broker’s execution speed on the trade, a trader does not get the exact price he needed. And the difference between the two prices is called slippage.

Trading Range in USD/UAH

Risk management is a vital factor in trading. The trading range is a tabular representation of the pip movement in a currency pair in different timeframes. And these values help in determining the gain or loss on a trade.

Note: The product of the pip movement value and the pip value (per standard lot) yields the profit/loss in a trade for a particular timeframe.

Procedure to assess Pip Ranges

  1. Add the ATR indicator to your chart
  2. Set the period to 1
  3. Add a 200-period SMA to this indicator
  4. Shrink the chart so you can determine a large time period
  5. Select your desired timeframe
  6. Measure the floor level and set this value as the min
  7. Measure the level of the 200-period SMA and set this as the average
  8. Measure the peak levels and set this as Max.

USD/UAH Cost as a Percent of the Trading Range

The total cost of a trade is determined by the sum of the spread, slippage, and the trading fee. And this varies from time to time, based on the volatility of the market. Below are the tables that represent the costs for different volatilities and timeframes.

ECN Model Account

Spread = 20 | Slippage = 3 |Trading fee = 5

Total cost = Spread + Slippage + Trading Fee = 20 + 3 + 5 = 28

STP Model Account

Spread = 23 | Slippage = 3 |Trading fee = 5

Total cost = Spread + Slippage + Trading Fee = 23 + 3 + 5 = 31

The Ideal way to trade the USD/UAH

Firstly, the percentage values depict the cost variation on the trade. The magnitude of the percentage is directly proportional to the cost of the trade.

We can see that the minimum pip movement in 1H, 2H, and 4H timeframe is 0 pips. So, it is pointless to trade in the lower timeframes. However, one may trade this pair on the higher timeframes, like the 1D, 1W, and 1M. To reduce costs even further and to have decent volatility, one may preferably trade when the volatility of the market is above the average values.

Furthermore, limit orders is another way through which a trader can bring down their costs considerably. This is because limit orders, unlike the market orders, do not have any slippage on it. For instance, the total cost on an ECN account for limit orders would be,

Total cost = Spread + Slippage + Trading Fee = 20 + 0 + 5 = 25

Corollary

We can see that on average volatilities, it almost takes a week range to cover the costs if the trade goes in the direction of the trade.  That means this pair is unsuitable to trade short-term. The use of limit orders to catch the price entry at the absolute minimum of the week, combined with ultra-reliable timing, is the only way to succeed. There are lots of better pairs to choose from.

Categories
Forex Assets

Asset Analysis – USD/RON Forex Exotic Currency Pair

Introduction

USDRON is the abbreviation for the US Dollar against the Romanian Leu. This pair comes under the roof of emerging currency pairs. The volume in this pair is pretty low, and the volatility is high. Here, the US Dollar is referred to as the base currency and the RON the quote currency.

Understanding USD/RON

The fluctuating price in the exchange market specifies the value of RON equivalent to one USD. It is quoted as 1 USD per X RON. For instance, if the market price of this pair is 4.4723, then about 4½ RON is required to buy one US Dollar.

Spread

Spread is the difference between the bid and the ask prices set by the broker. It is not the same with all brokers. It also varies from the type of execution model used by the broker.

ECN: 19 pips | STP: 21 pips

Fees

The fee is the commission that is paid to the broker on each position you take. This, too, varies from the type of execution model. Typically, there is no fee on STP accounts. However, there are a few pips of fee on ECN accounts.

Slippage

Slippage is the difference between the price requested by the client and the price he actually got from the broker. This happens only on market orders. The primary reasons for its occurrence are,

Market’s volatility

Broker’s execution speed

Trading Range in USD/RON

A trading range is the representation of the pip movement in a currency pair for different timeframes. With these values, we can determine the gain or loss in a trade for a specified time frame. All that must be done is, multiply the required value from the below table with the pip value. This will yield the profit/loss for one standard lot.

Procedure to assess Pip Ranges

  1. Add the ATR indicator to your chart
  2. Set the period to 1
  3. Add a 200-period SMA to this indicator
  4. Shrink the chart so you can assess a large time period
  5. Select your desired timeframe
  6. Measure the floor level and set this value as the min
  7. Measure the level of the 200-period SMA and set this as the average
  8. Measure the peak levels and set this as Max.

USD/RON Cost as a Percent of the Trading Range

Apart from assessing the profit or loss on a trade, we can also determine how the cost varies as the volatility changes. Below is a tabular representation of the same.

ECN Model Account

Spread = 19 | Slippage = 3 |Trading fee = 3

Total cost = Slippage + Spread + Trading Fee = 3 + 19 + 3 = 25

STP Model Account

Spread = 21 | Slippage = 3 | Trading fee = 0

Total cost = Slippage + Spread + Trading Fee = 3 + 21 + 0 = 24

The Ideal way to trade the USD/RON

Trading emerging currency pairs is different from trading major and e pairs. This pair’s high volatility and low trading volume make it infeasible to trade any time during the day. So let’s take some info out from the above tables and try finding the ideal times to enter this pair.

From the table, it can be ascertained that the percentage values are high in the min column and pretty low in the max column. This means that the total costs on the trade increases as the volatility decreases. So, to have equilibrium between the two, it is perfect to enter during those times when the volatility is around the average values. This will ensure both sufficient volatility and affordable costs.

Another simple technique to reduce total costs is by trading using limit and stop orders instead of market orders. In doing so, the total costs will reduce significantly as the slippage will not be considered for limit/stop orders. The reduction in the costs is represented in the below table as follows.

Categories
Forex Videos

Forex – How To Trade The EURUSD Pair Right Now!

What on earth is going on with the EURUSD pair and how to trade it!

In 2011 the EURUSD was way ahead of other currency pairs being traded in the Forex market and was traded with almost 50% more in volume than that of the USDJPY and GBPUSD combined.
Indeed it was only a couple of years ago that you might expect the daily swing in the EURUSD pair to be well over 100 pips per day. And yet, in recent months, we have seen the daily price action of the pair restricted to around 25-30 pips on many occasions during the European and American trading sessions, when its volumes are at their peak.

Example A


Let’s take a quick look at example A which is a 15-minute time frame of the pair, where the two vertical lines indicate where the majority of the volume will have been traded. This time frame is a fairly typical choice for an institutional trader to use. So let’s take a more detailed look at what is going on in example B.

Example B


From the 5th of February 2020 through to the 7th, which contains two complete trading days, we can see that the total amount of pips traded is just 61, giving us our average of 30.5 pips per day. In terms of volume, it is almost nothing.


Example C


Let’s drill down further, in example C, to try and define what is going on. We have broken the time period down into three sections. Firstly, in section A we can see that where was sidewards trading, which was consolidating and restricted to only 21 pips and where price action was fluctuating very tightly around the key 1.10 exchange level.

Finally, traders threw in the towel with regard to expectations that the key 1.10 level would act as an area of support, and price action then falls lower to area B, again where it consolidates into a restrictive range of only 19 pips.
Again price action moves lower initially in area C, but again we see a fairly restrictive price action of only 33 pips including the most volatile session in the middle of this area which is associated with the release of the US nonfarm payrolls, and where the much better than expected 225,000 jobs were added to the labor force, and where previously one might have expected dollar strength to move this pair 100 pips to the downside with such a number, but it was relatively unaffected.

So what is happening, and how can we trade this pair? First and foremost, it was only a couple of months ago that big institutional players were suggesting that this pair could be heading for the 1.15 level, such is the belief in the strength of the Euro. Obviously, that has not happened, and this is largely due to a weakness in the Euro area and which is particularly affecting growth in the German economy, which some say is in borderline recession, and where the German economy is pretty much the backbone of the European Union.

We also have fallout from Great Britain formally leaving the European Union and where uncertainty will prevail with the European model, due to losing income from the UK and whereby no formal trade agreements have yet been set in place and where the restrictive timeline to implement this leaves many wondering whether it is achievable by the end of December 2020.
The Coronavirus is also keeping worries with regard to a potential contraction in growth and all of this can

only mean one thing the big institutional players are uncertain with regard to directional bias for this pair in the short to medium-term and are pretty much standing on the sidelines waiting for clear evidence of where the Euro is heading.
Therefore, should you be standing on the sidelines as well? This pretty much depends on your flavor for risk. You might be better off looking at other major currencies such as the USDJPY, the GBPUSD, if you want volatility. But if you want to trade the EURUSD pair, we suggest that you use simple add price action boxes such as we have drawn onto our charts and look for breakouts when they occur, or simply drop down to a lower time frame such as the 5-minutes chart in order to scalp the pair to try and make a few pips here and there throughout the day.

Categories
Forex Assets

Analyzing The USD/EGP Exotic Forex Currency Pair

Introduction

USDEGP is the abbreviation for the US Dollar against the Egyptian Pound. The USDEGP is classified under the emerging currency pairs, and the volatility in these pairs is quite high. In this pair, the US Dollar is the base currency and the EGP the quote currency.

Understanding USD/EGP

The price of USDEGP specifies the value of EGP equivalent to one USD. It is quoted as 1 USD per X EGP. So, if the market price of this pair is 15.673, then 15.673 units of EGP are required to purchase one US Dollar.

Spread

The difference between the bid and ask price is referred to as the spread. This value varies from broker to broker as well as how they execute the trade. The approximate spread on ECN and STP accounts is shown below.

ECN: 20 pips | STP: 21 pips

Fees

The fee is a commission that is to be paid to the broker for each trade you execute on an ECN account. On STP accounts, the fee is nil.

Slippage 

The price you receive from the broker is usually different from the price when you executed. And the difference between these two prices is referred to as the slippage. The factors affecting slippage include,

  • Market’s volatility
  • Broker’s execution speed

Trading Range in USD/EGP

The trading range is a tabular representation of the pip movement in a currency pair for different timeframes. With it, one can assess their risk on the trade for each given timeframe.

Procedure to assess Pip Ranges

  1. Add the ATR indicator to your chart
  2. Set the period to 1
  3. Add a 200-period SMA to this indicator
  4. Shrink the chart so you can assess a large period
  5. Select your desired timeframe
  6. Measure the floor level and set this value as the min
  7. Measure the level of the 200-period SMA and set this as the average
  8. Measure the peak levels and set this as Max.

USD/EGP Cost as a Percent of the Trading Range

As the name pretty much suggests, this is a trading range table that represents cost variations (in terms of percentage) for different timeframes and volatilities. These values are useful in determining the ideal times of the day to trade this pair.

ECN Model Account

Spread = 20 | Slippage = 3 |Trading fee = 3

Total cost = Slippage + Spread + Trading Fee = 3 + 20 + 3 = 26

STP Model Account

Spread = 21 | Slippage = 3 | Trading fee = 0

Total cost = Slippage + Spread + Trading Fee = 3 + 21 + 0 = 24

The Ideal way to trade the USD/EGP

In emerging currencies, the volatility is high, and the traded volume is low. So is it not ideal to enter the market any time during the day. So, let’s interpret the above tables and find the best times of the day to trade this currency pair.

The magnitude of the percentage is directly proportional to the cost of the trade. And since the percentage is higher in the min column, we can conclude that as the volatility increases, the cost reduces. However, our main aim is not only to reduce costs but to have good volatility and trading volume as well. Hence, to ensure both, it is ideal to trade when the volatility is at/above the average values in the volatility table.

Moreover, one can bring their costs slightly lower by trading using limit orders instead of market orders. This will cut off the slippage on the total cost of the trade. An example of the same is given below.