Categories
Forex Assets

Trading The XRP/USD Pair & Analysing The Costs Involved

Introduction

XRP/USD is the abbreviation for Ripple against the US Dollar. This pair is used for trading the Ripple cryptocurrency. Also, traders can trade Ripple against other fiat currencies.

Understanding XRP/USD

The value of XRP/USD represents the value of the US Dollar equivalent to one Ripple. It is quoted as 1 XRP per X USD. For example, if the value of XRP/USD is 0.1912, then it can be said that each Ripple is worth 0.1912 US Dollars.

XRP/USD specifications
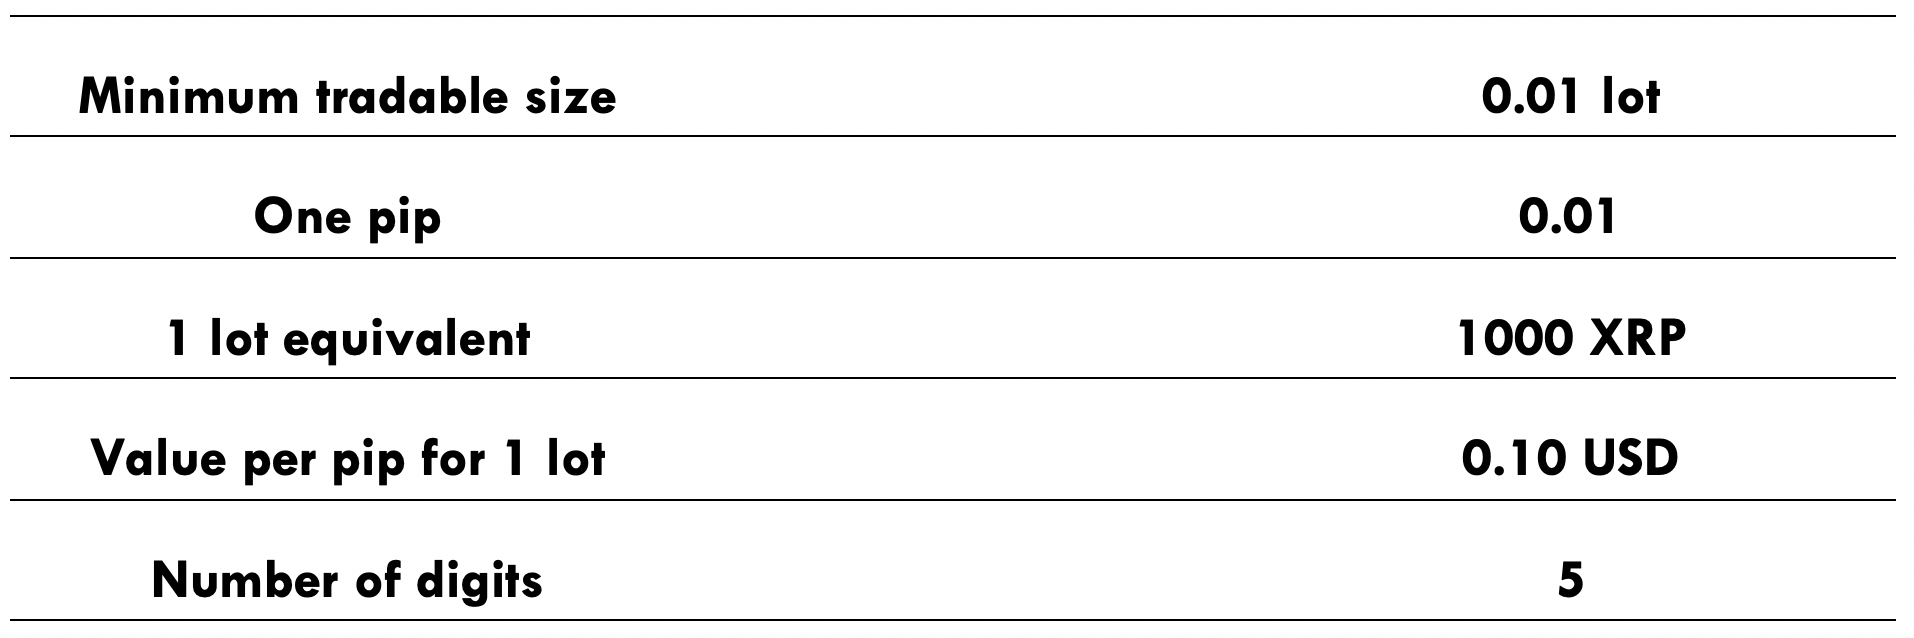
Spread

Spread is the difference between the bid and the ask price quoted by the brokers. It varies based on the execution model used. Below are the ECN & STP spreads for the XRP/USD pair.

Spread on ECN: 50 pips | Spread on STP: 53 pips

Fee

The fee is the commission that is levied by the brokers on each trade. This fee is only applicable to ECN brokers, not STP brokers.

Slippage

When orders are executed on the ‘market,’ the price requested by the trader is different from the price given by the broker. This can happen either because of high market volatility or broker’s execution speed

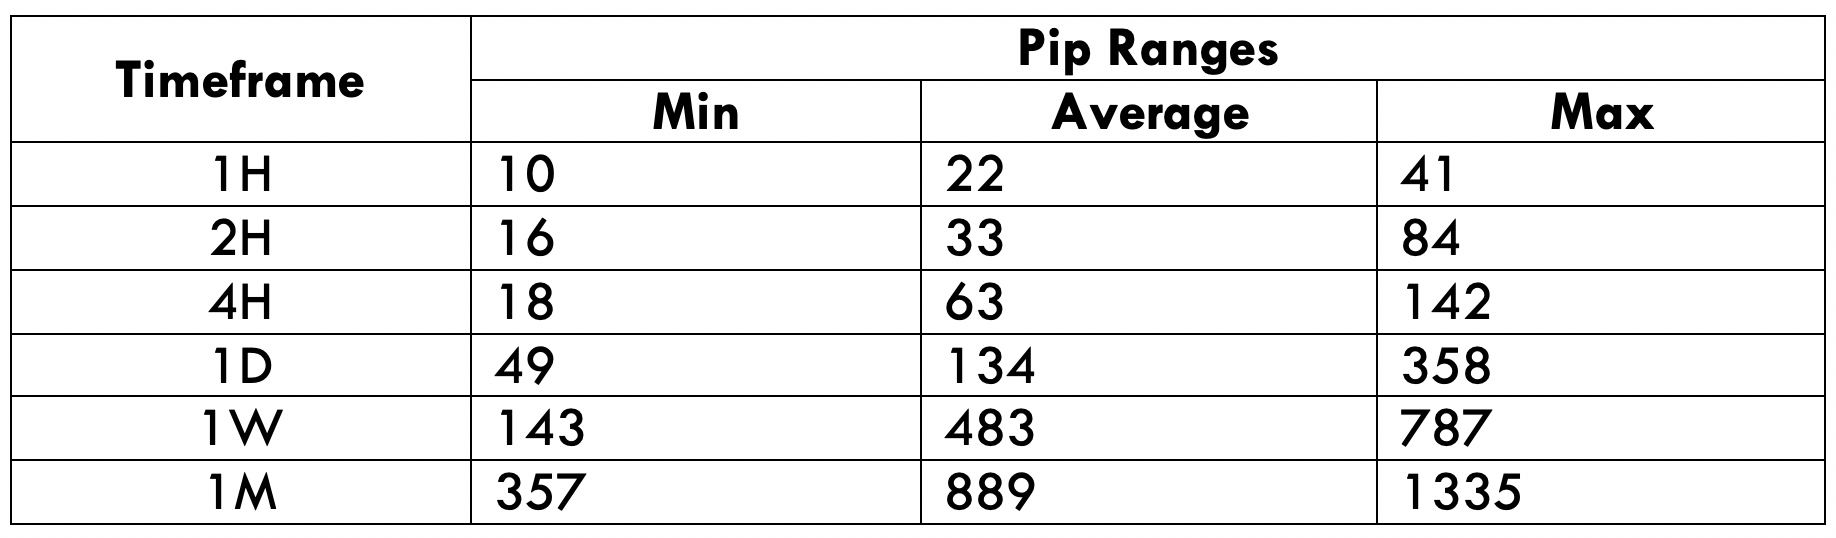
Trading Range in XRP/USD

The minimum, average, and maximum pip movement in XRP/USD are given below. One can use these values to determine the profit/loss they could make in a given timeframe.

Procedure to assess Pip Ranges

  1. Add the ATR indicator to your chart
  2. Set the period to 1
  3. Add a 200-period SMA to this indicator
  4. Shrink the chart so you can assess a large time period
  5. Select your desired timeframe
  6. Measure the floor level and set this value as the min
  7. Measure the level of the 200-period SMA and set this as the average
  8. Measure the peak levels and set this as Max.

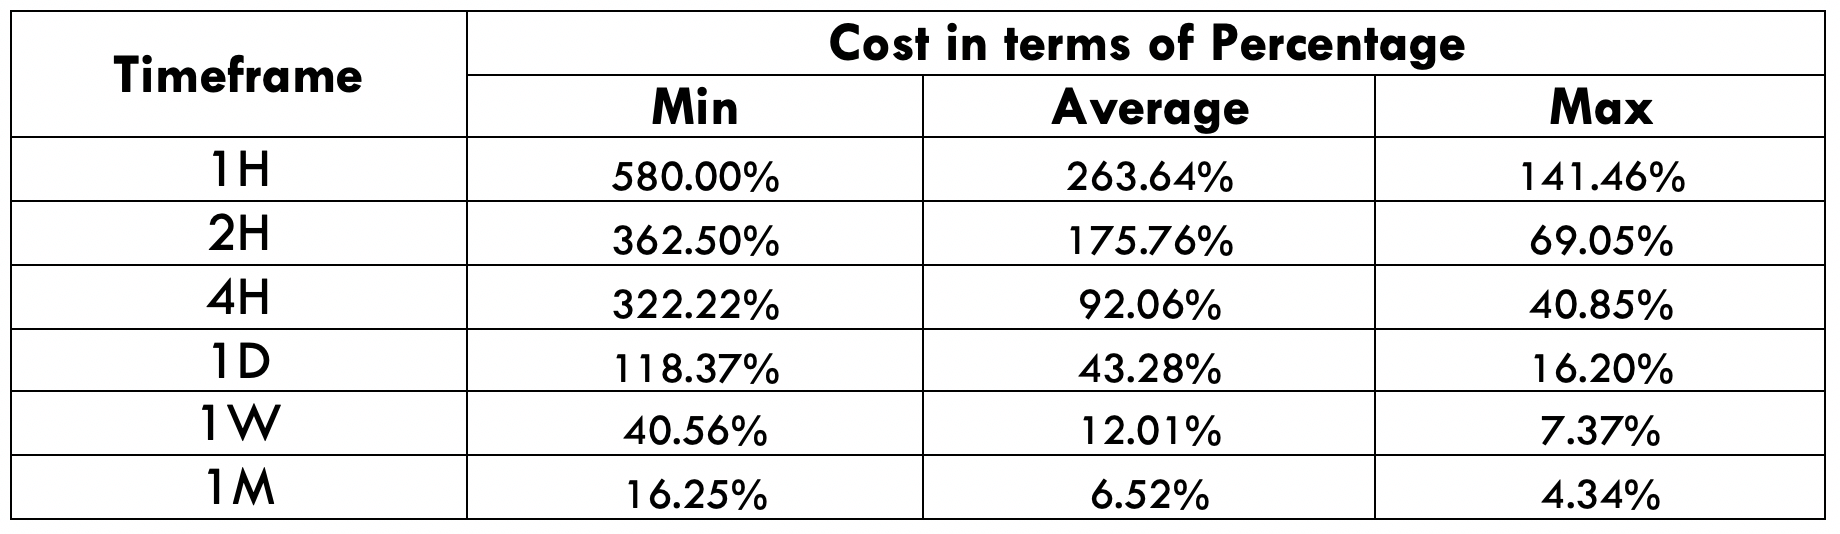
XRP/USD Cost as a Percent of the Trading Range

By applying the volatility values to the total cost of a trade, the variation in the costs for varying volatilities can be determined. Below are two tables representing the same.

ECN Model Account

Spread = 50 | Slippage = 3 |Trading fee = 5

Total cost = Slippage + Spread + Trading Fee = 3 + 50 + 5 = 58
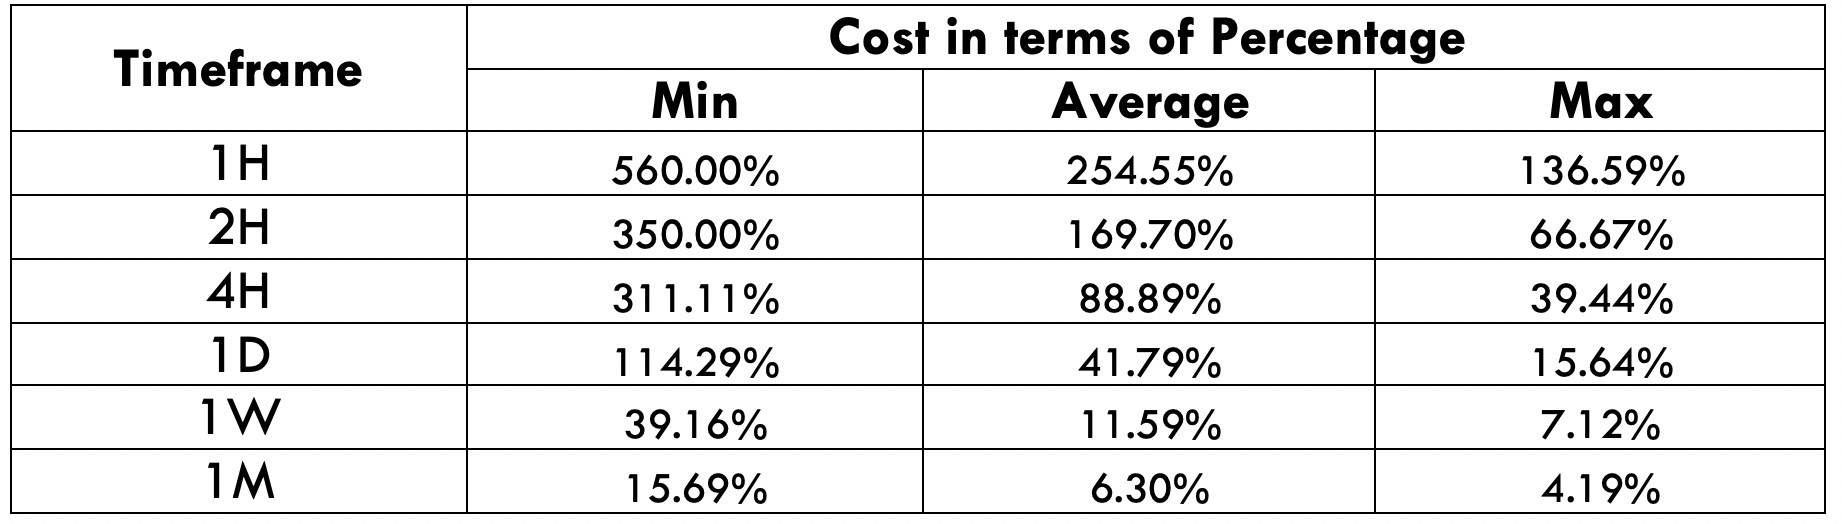
STP Model Account

Spread = 53 | Slippage = 3 | Trading fee = 0

Total cost = Slippage + Spread + Trading Fee = 3 + 53 + 0 = 56

Trading the XRP/USD

While trading a pair, there are two factors that must be taken into consideration, namely, volatility and cost.

Volatility

The minimum in the 4H timeframe is 18 pips, while 142 pips are the maximum. And the average stands at 63. So, if a trader wishes to trade the 4H timeframe, then they should make sure that the current volatility is at or above the average volatility. This is because one can make money only when there is movement in the market.

Cost

Cost is not constant but varies as the volatility changes. The cost percentages in the minimum column are the highest compared to the average and maximum columns. This means that the costs are very high for highly volatile markets. Hence, it must be avoided.

The benefit with limit orders

Traders who trade with limit orders have an added benefit than those who trade with market orders. With limit orders, the total cost of the trade does not include the slippage. This hence brings down the cost of the trade to a decent extent.

This concludes the analysis of BCH/USD. We hope you found it interesting and useful. Stay tuned for more such asset analysis. Cheers!

Categories
Crypto Market Analysis

Daily update: Bitcoin, Ethereum, XRP, Cardano

Daily update: Bitcoin, Ethereum, XRP, Cardano

Bitcoin

  • Fundamental analysis: Bitcoin has seen some increases in transaction volume. However, the sentiment remains bearish. This is due to many people separating the terms Blockchain and Bitcoin, and respecting the value of one, and not the other.
  • Technical analysis: Bitcoin has had a pretty volatile day. In a span of 1 hour, Bitcoin jumped from the low of $6100 to the high of $6550. However, it has remained calm around the price of $6400, where it bounced off the support line ($6390) and stayed above it.

Ethereum

  • Fundamental analysis: Ethereum has been in good graces when it comes to market sentiment these few days. With a web browser on the Ethereum platform which is considered a viable replacement to Chrome, a change of governance to an updated versions of ERC tokens and much more, ETH has seen some bullish potential.
  • Technical analysis: When it comes to price, Ethereum has not seen many changes after the big spike that came on the 18th of September. It is now consolidating and waiting for buyers or sellers to start their cycle. It has also found some resistance at the 100 EMA on the 1h time frame.

XRP

  • Fundamental analysis: There is no doubt that the Ripple is a great company. Partnerships with major corporations just keep getting announced. However, most of these deals do not include XRP. That’s why the price of XRP is not as affected as some people might think it should be. On the other hand, if XRP ever gets included in some of these deals, the price will skyrocket. The trust of this happening is the sole reason people remain bullish when it comes to XRP.
  • Technical analysis: The 18th of September was a great day for XRP. The price spiked up over 20%. Also, the price is consolidating at the top of the move, and has not declined significantly after the upwards move. XRP has found good support at $0.31 and a resistance line at $0.332.

Cardano

  • Fundamental analysis: Fundamentals of Cardano have not changed for quite a while. It is still a platform with great potential, but we have yet to see what it has to offer when it comes to use case. The fundamentals are often speculative when it comes to this kind of Cryptocurrencies.
  • Technical analysis: Cardano is one of the top performers today. It has found an area of support to which the price responds perfectly (bottom blue line). The only times the price did not react was when Bitcoin had a major downswing, and every other Cryptocurrency followed. Once the price has came back above the support line, it has retested it and stayed above.
Categories
Crypto Market Analysis

Daily Crypto Update 13.06.2018 – Nothing but Red

Only two of the top 100 cryptos are positive, this is telling us a lot about the difficult time the market is going through. It is still receiving attacks from bears and I think the market will continue bearish today on all fronts but with less intensity while the buyers prepare their strategies. The volume has increased a little but Market Capitalisation continues in a constant drop.


General Overview


Cryptocurrencies: 1628
Market Cap: $276.340.549.831
24h Vol: $15.643.281.033
BTC Dominance: 40.3%

If 98 of 100 cryptos are in red that means that the bears are winning, the market is alive but resentful and if there is a moment to recover it is today;

Market Capitalization

If the market keeps losing capitalisation in the rhythm it has, the week will be much more negative.


News


These are the top headlines that came out in the last hours regarding different topics related to cryptos, here is the news:

Google searches for Bitcoin have reportedly declined 75% through 2018, yet the leading cryptocurrency is still outstripping the famous music star Beyonce on Google Trends, CNBC reported Tuesday, June 12th.

A “value discovery” platform for blockchain and cryptocurrencies, aided by a unique AI algorithm, plans to help investors make the best choices available to them in real-time, whilst avoiding dangerous mistakes. Beenews (BKBT) is based on Meta-graph Chain, a public blockchain system which includes the smart contract system.

Tether (USDT) has once again become the source of criticism after a new study blamed it for Bitcoin price manipulation in 2017, The New York Times reports Wednesday, June 13.
A paper released June 13 by John M. Griffin and Amin Shams of the University of Texas suggests that transaction patterns show Tether was “used to provide price support and manipulate cryptocurrency prices.”

Chinese e-commerce giant JD.com has released plans to issue asset-backed securities (ABSs) on the blockchain, local media reported June 13.
According to China’s Securities Regulatory Commission (CSRC) via its media outlet Securities Times, subsidiary JD Finance will issue the ABS in conjunction with Huatai Securities and Xingye Bank.

A big announcement is expected from Coinbase and there seem to be imminent plans to list Cardano (ADA) in this exchange of currencies that has more than 10 million subscribers. Cardano has a strong client base, has less regulation from the SEC and offers a platform that is applicable to real-world situations. However there is another currency that would compete with Cardano to get into Coinbase and that is QTUM, we will see what happens.

Source: cointelegraph.com


Analysis


ETH/USD

ETH / USD Has lost 9.41% in the last 24H and 25% of its value in this 4 day drop, its current price is $474.81, closing under the S1 Pivot point.


Looking at this 4 hour chart, the drop seems unstoppable and if ETH Loses today’s minimum at $463, we will very likely see new minimums closing at $430.


Market sentiment

4-hour chart technicals signal show oversold levels but pointing nowhere.

Moving averages pointing down, also showing sell signs.


Pivot points

R3 720.5 
R2 676.6 
R1 599.9 
P 551.7 
S1 478.1 
S2 429.9 
S3 357.5

XRP

XRP has lost 8.27% in the last 24 Hours and is currently moving around $0.53.


In this 4h chart, we can see how the price has touched the S1 pivot point and still seems to be receiving sellers pressure. The pair is now in 2 months minimums and a breakout of this level could easily send the price to test $0.5. If the 50-EMA crosses 100-EMA it could be another strong indicator for further drops.


Market sentiment

4-hour chart technicals signal show oversold levels and pointing down.

Moving averages pointing down, also showing sell signs.


Pivot points

R3 0.82
R2 0.76 
R1 0.67 
P 0.61 
S1 0.52
S2 0.46 
S3 0.37

ADA

ADA HAS LOST 8.27% in the last 24 hours and its current price is $0.1523 losing 36% of its value in only 10 days,
that is quite worrying in this red market.


The price is very close to the Pivot Point S1 at $0.1500 (2 months minimum). If this support is broken, we will be visiting new minimums of $0.1455 and then $0.1405.
A possible salvation for the pair could be the announcement that it could be listed in Coinbase, if this news is confirmed, the price could respond positively. The weakness of the pair does not support an analysis with bullish projection.


Market sentiment

4-hour chart technicals signal show oversold levels and pointing down.

Moving averages pointing down, also showing sell signs.


Pivot points

R3 0.2790
R2 0.2555 
R1 0.2143
P 0.1900 
S1 0.1489
S2 0.1253 
S3 0.0841

Conclusion


The market is definitely red, the sentiment is quite Bearish and if we are not in the market in shorts and taking advantage of the situation it is better to be on the sidelines while it shows signs of recovery. On the other side, if the Bearish Sentiment increases, it is necessary to look for safe entries only in the short term.

Categories
Crypto Market Analysis

Ripple Further Increase Expected

Ripple (XRP)

Market Cap. $28 179 718 865

Volume (24h) $754 165 000

Circulating Supply: 39 122 794 968 XRP

Total Supply: 99 992 362 643 XRP

Max Supply: 100 000 000 000 XRP


The Ripple XRP has finally managed to jump above the short-term downtrend line. The crypto has lost the bearish momentum, so the current rebound was natural and expected.

Ripple XRP Price Predictions April 2018

XRP/USD retested the broken downtrend line and now is pressuring the 0.71192 static resistance. Maybe some of you have already entered long on Ripple after the breakout above the downtrend line. Personally, I’m waiting for a valid breakout above the inside sliding parallel line (sl1) to be sure that the rate will really move towards new highs.

It seems like that the major corrective phase is completed, but we still need a confirmation that the Ripple XRP will start a broader upside movement.

A valid breakout above the sliding line (sl1)  and above the 0.80000 level will signal a further increase towards the median line (ML) of the ascending pitchfork. The major upside target will be at the upper median line (UML).

The perspective is bullish on the short term as long as the rate stays above the downtrend line and most important above the outside sliding parallel line (sl) of the ascending pitchfork.

Ripple XRP Predictions April 2018

XRP/USD slipped lower to test and retest the 0.70835 broken resistance. A failure to make a valid breakout above the sliding line (sl1) will signal a minor exhaustion. Price could come back to test and retest the lower median line (LML) or the outside sliding (sl) before will give birth to a larger bullish movement.

Note: if you want to go long on the XRP/USD you should place a Stop Loss somewhere below the outside sliding line (sl). You can place it somewhere below the 0.53550 to be safe if the rate will come down a little.