Introduction
This analysis will look into endogenous factors that influence economic growth both in the UK and Australia. We will also analyze the exogenous factors that impact the exchange rate of the GBP/AUD pair.
Ranking Scale
We will conduct correlation analysis, which we will use to rank the endogenous and exogenous factors on a scale of -10 to 10.
In ranking the endogenous factors, we will conduct a correlation analysis against the GDP growth rate. If the score is negative, the endogenous factor has resulted in depreciation of either the GBP of the AUD. Conversely, if the score is positive, then the factor has resulted in an appreciation of the local currency.
When the exogenous analysis is negative, the factor has resulted in a decline of the GBP/AUD exchange rate. If the score is positive, then the factor has led to an increase in the exchange rate.
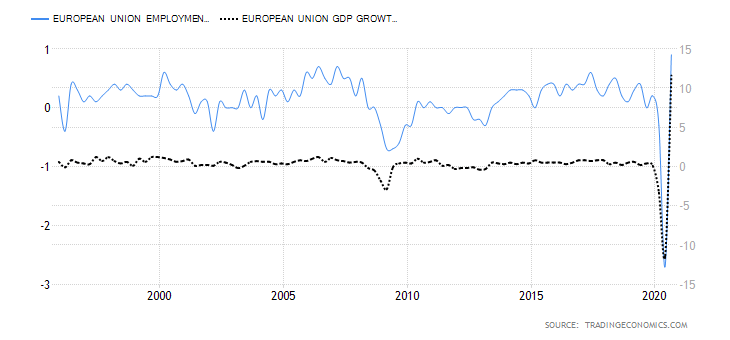
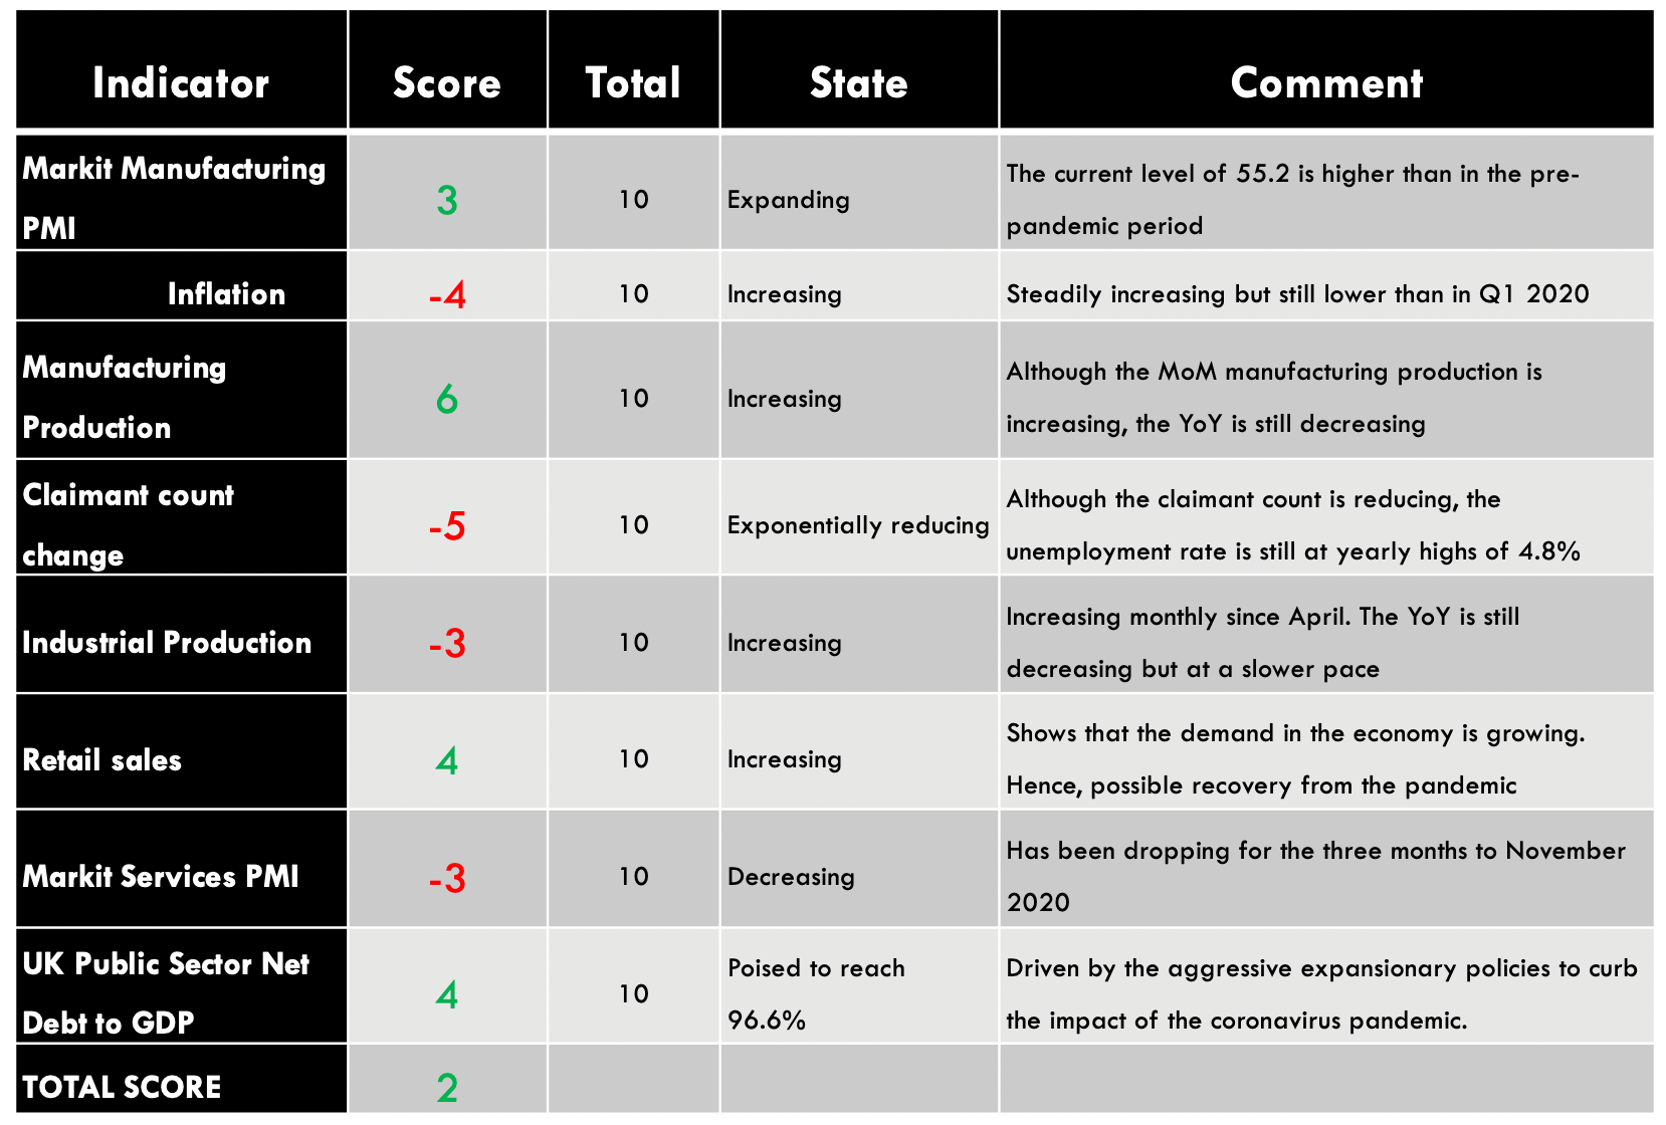
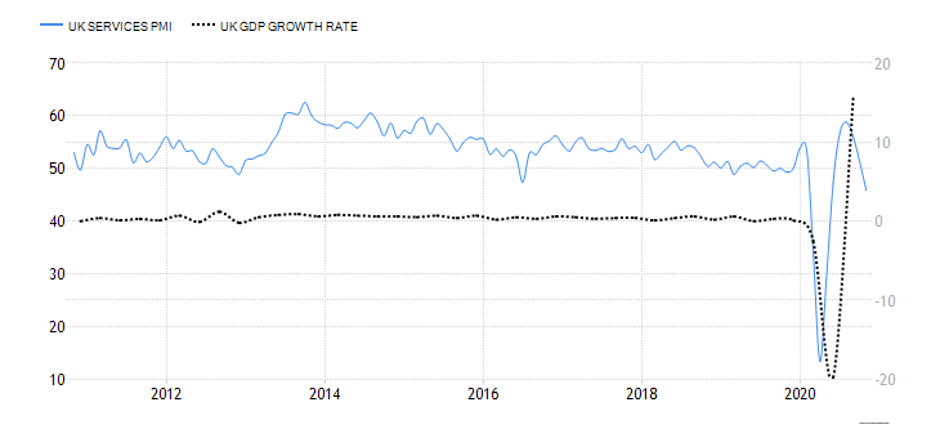
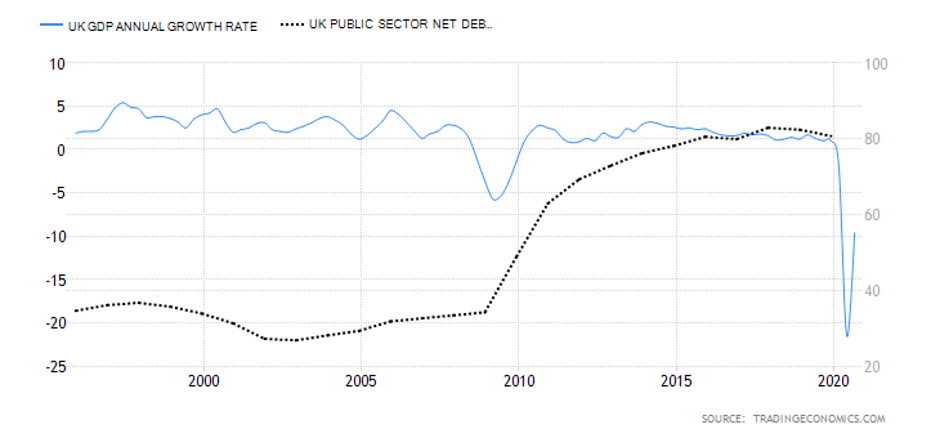
Summary – GBP Endogenous Analysis
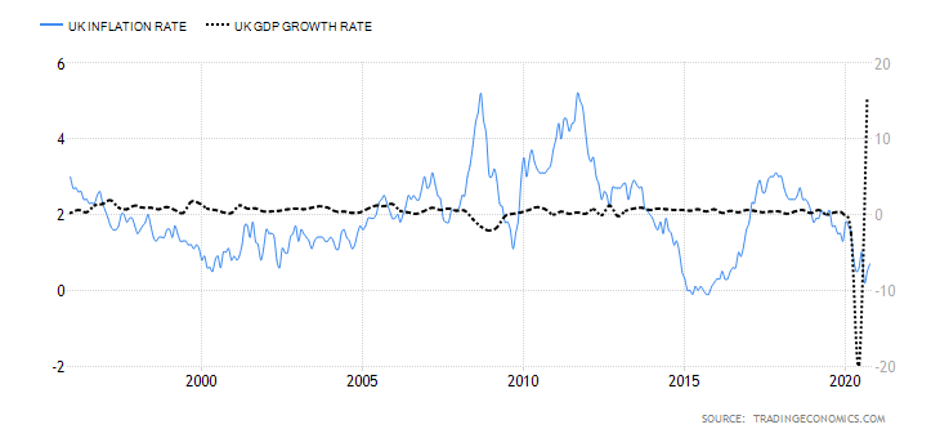
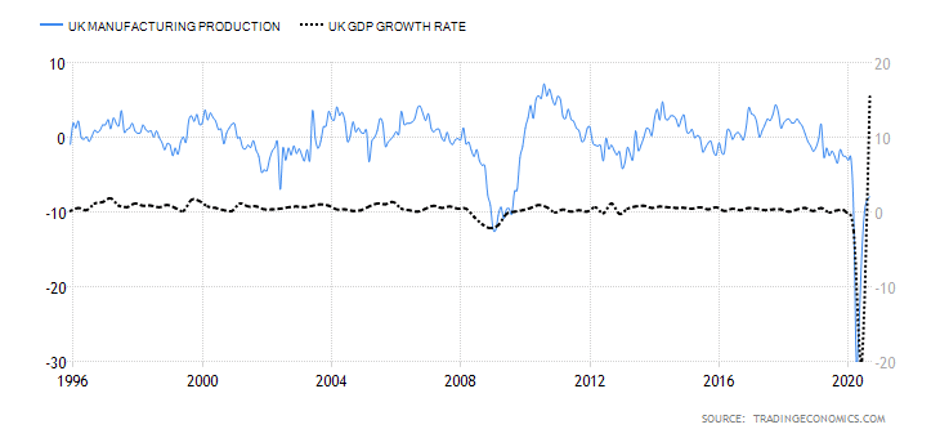
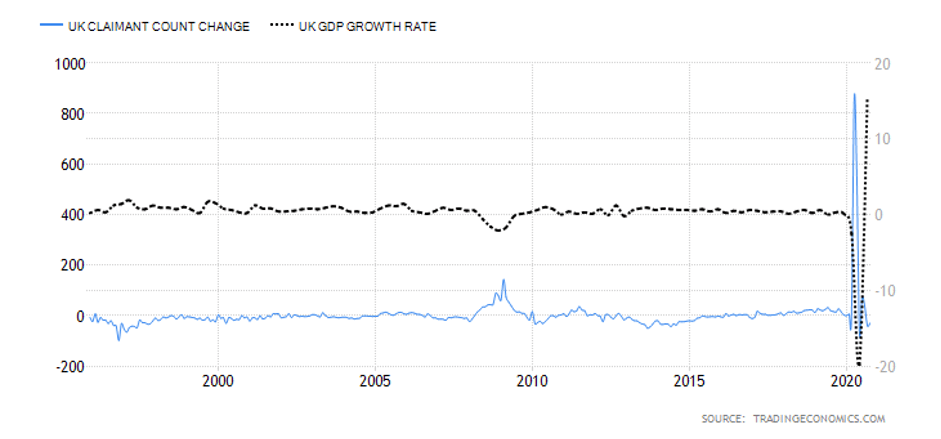
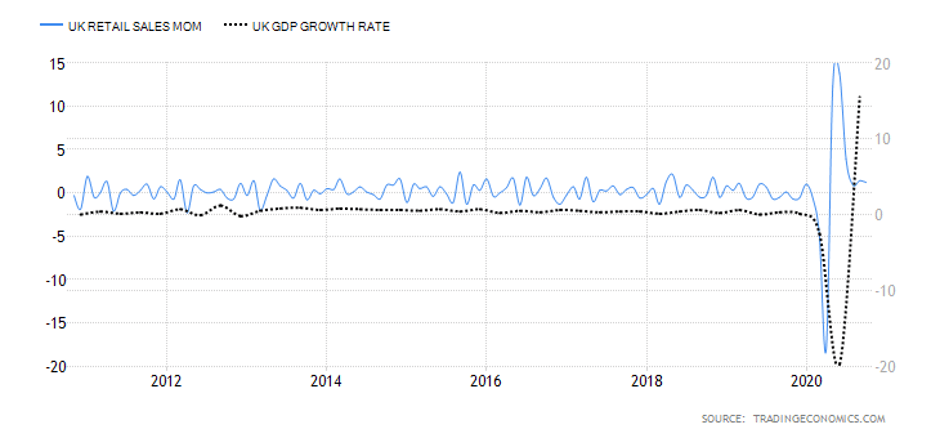
A -15 score indicates that the Pound has depreciated since the starting of 2020.

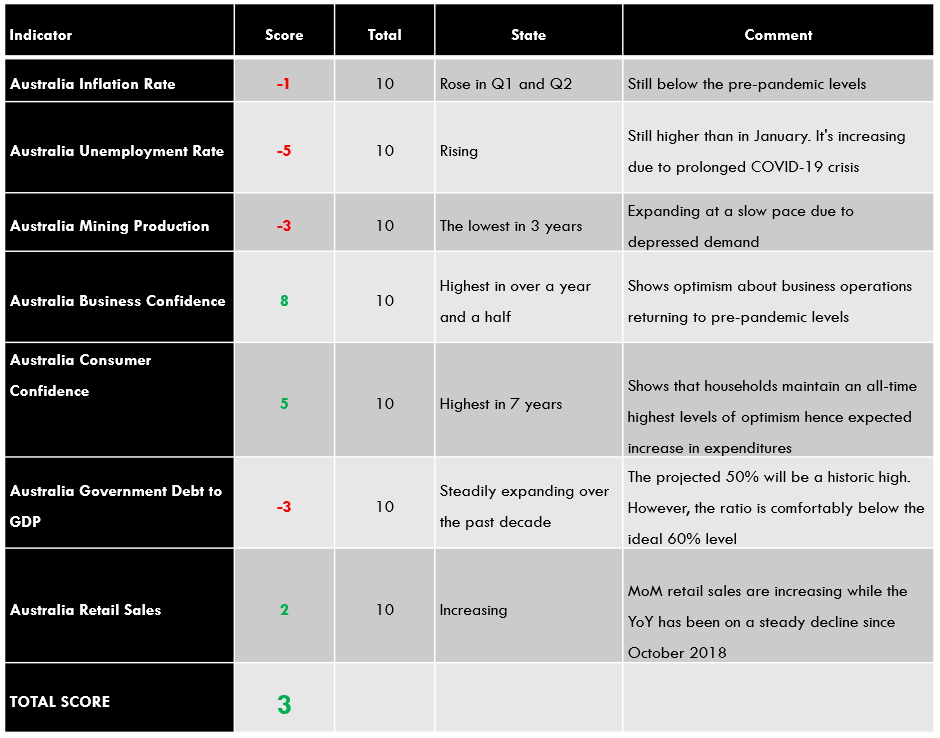
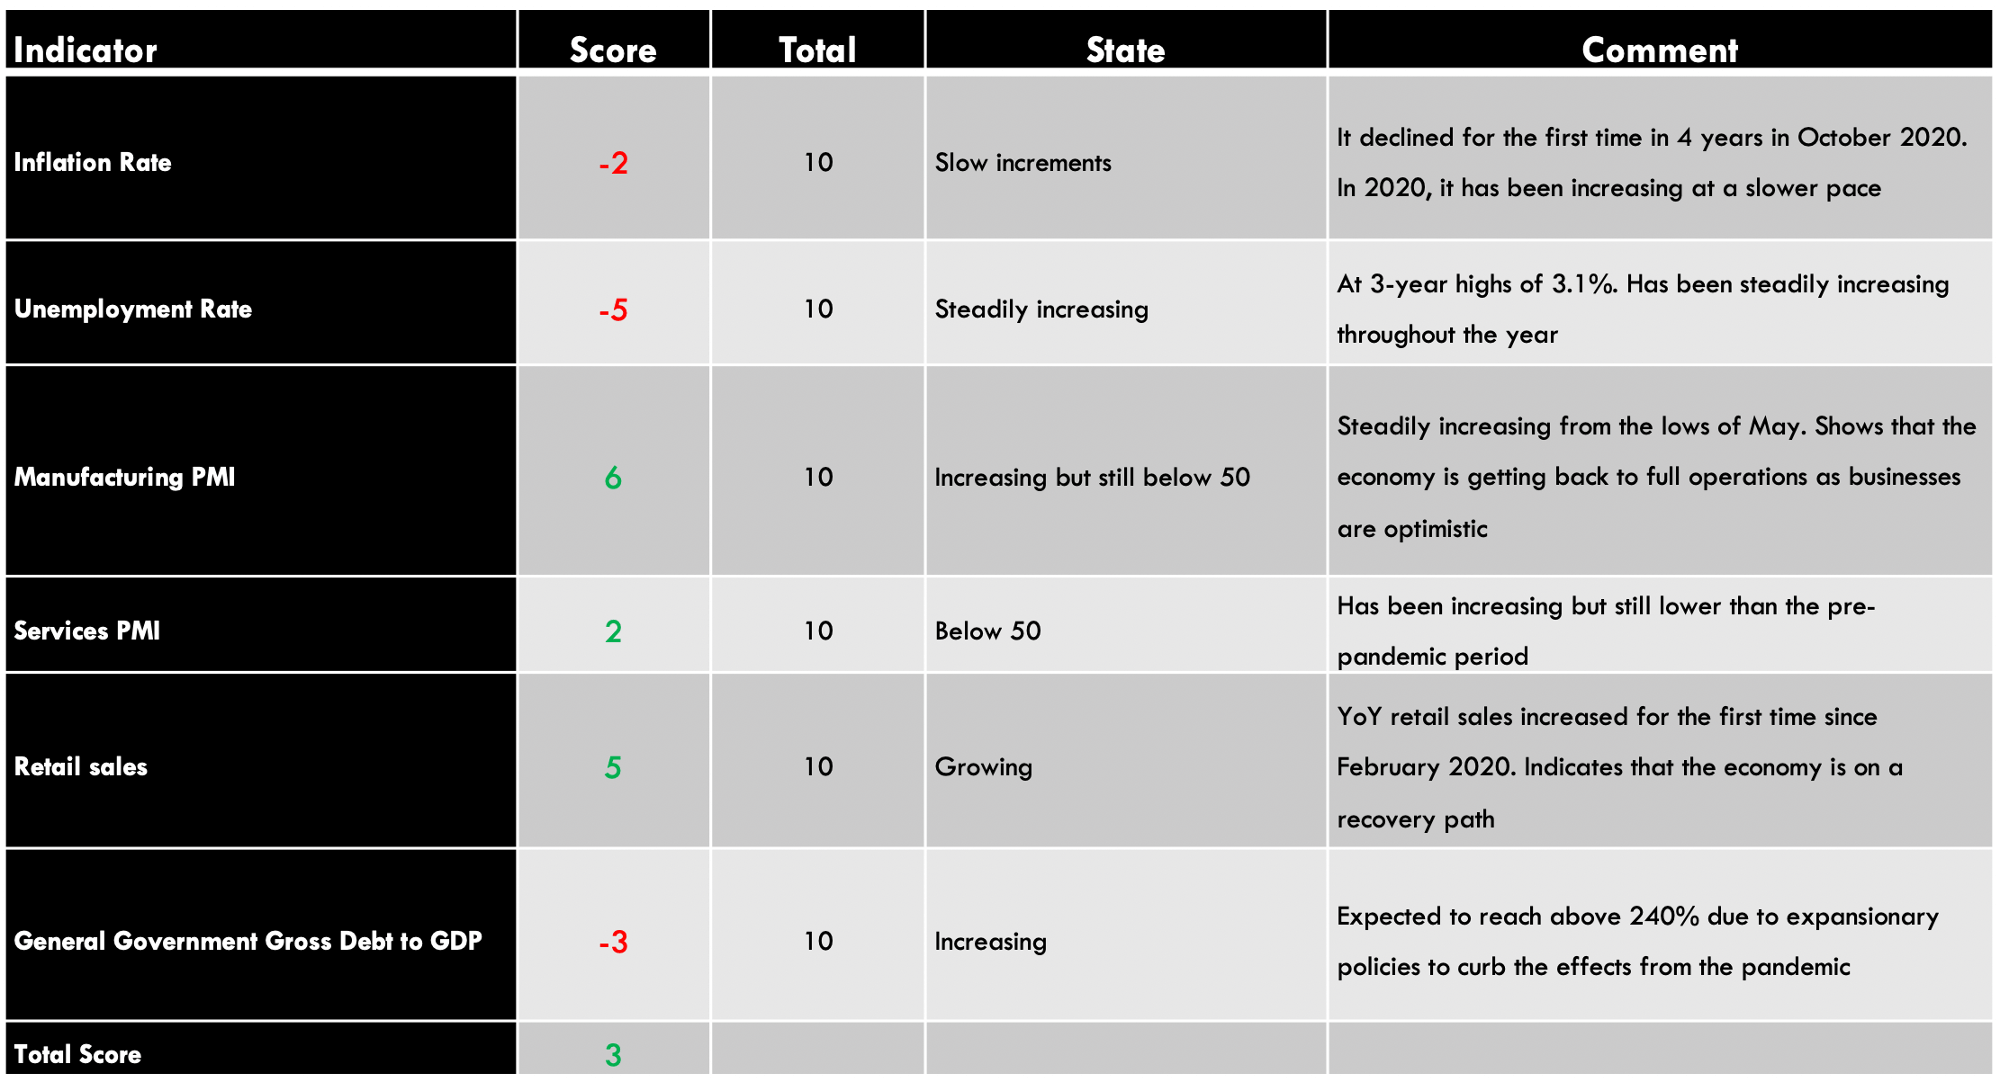
Summary – AUD Endogenous Analysis
A score of -8 indicates that the Australian dollar has depreciated as well since the beginning of 2020.
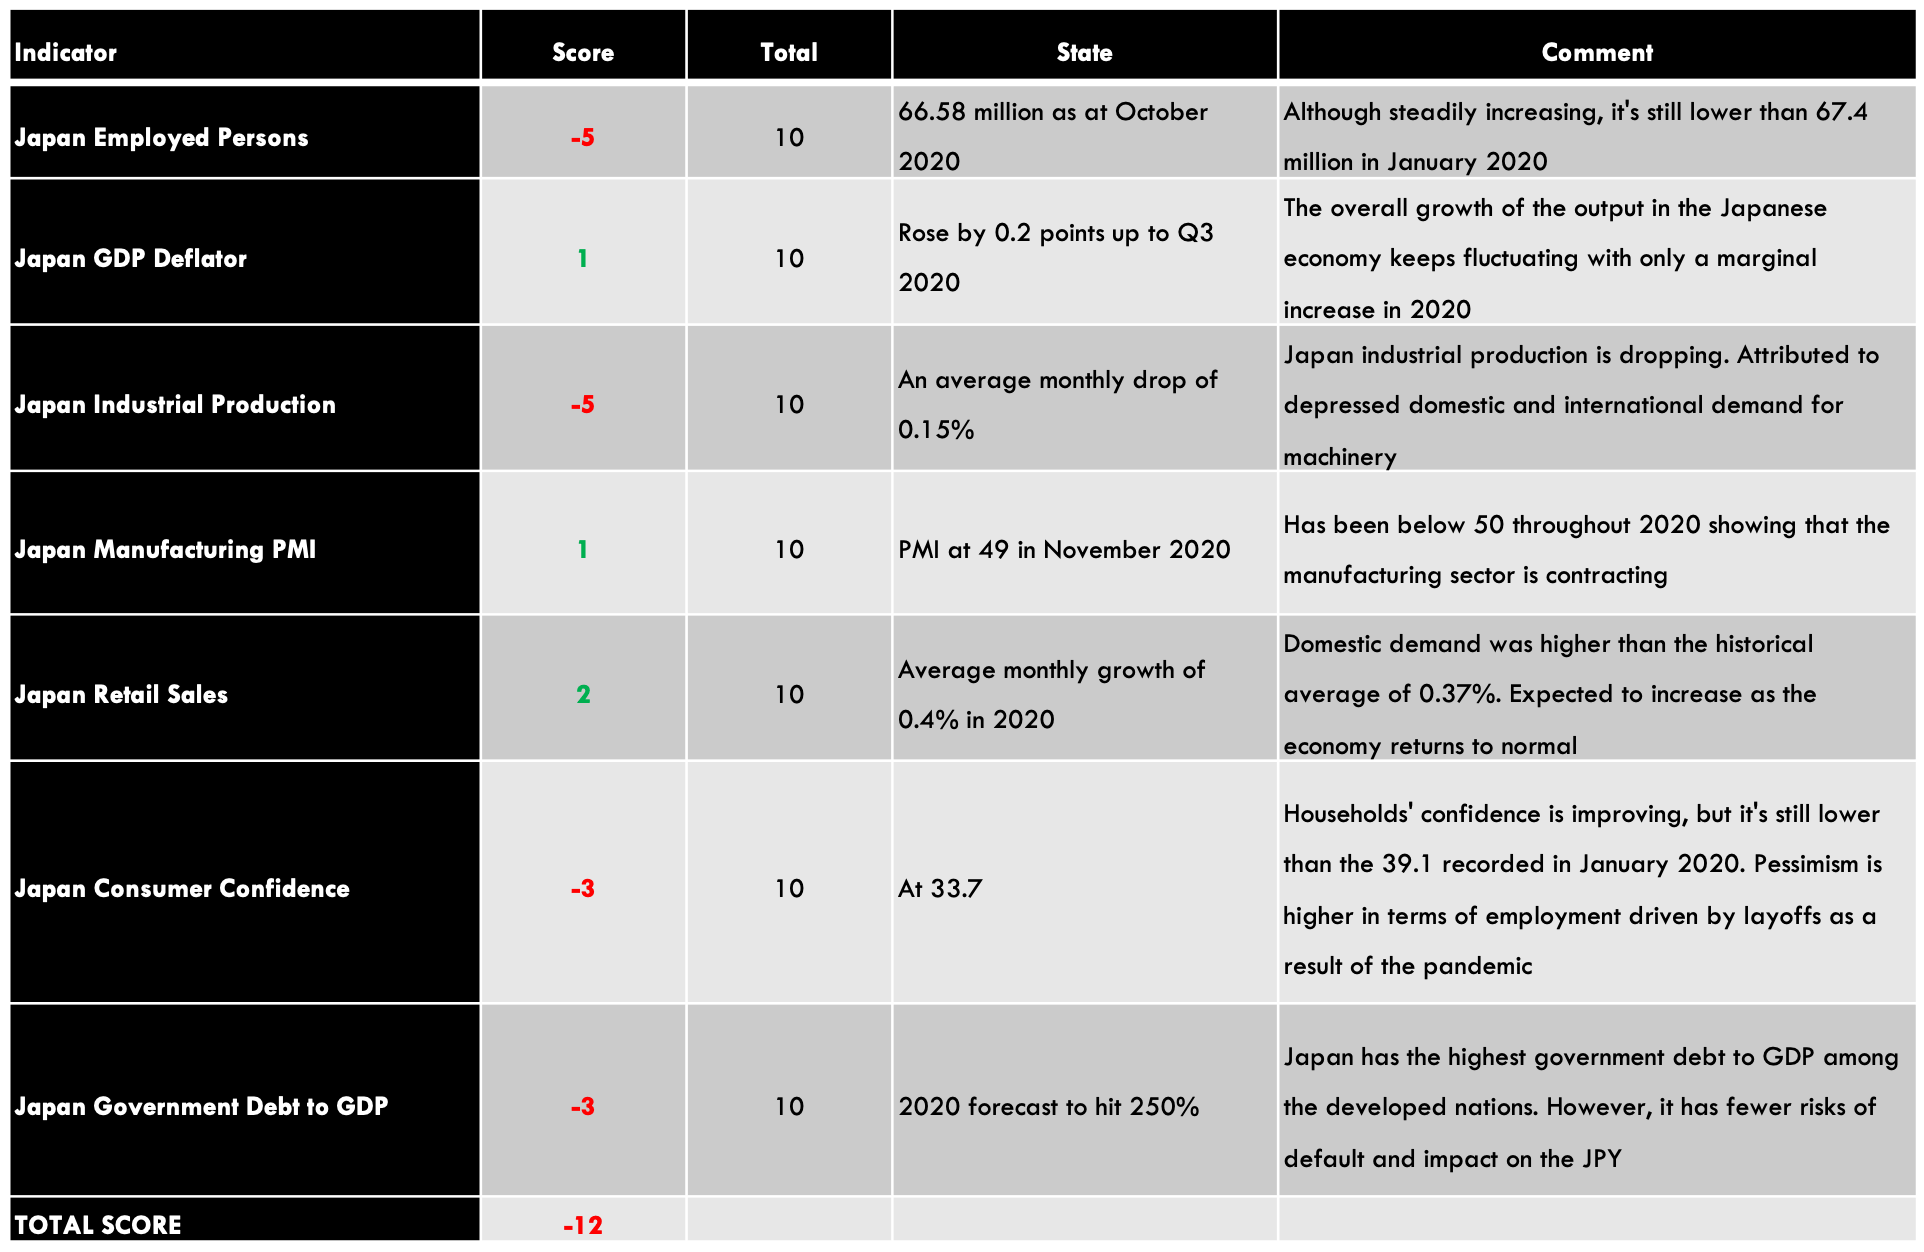
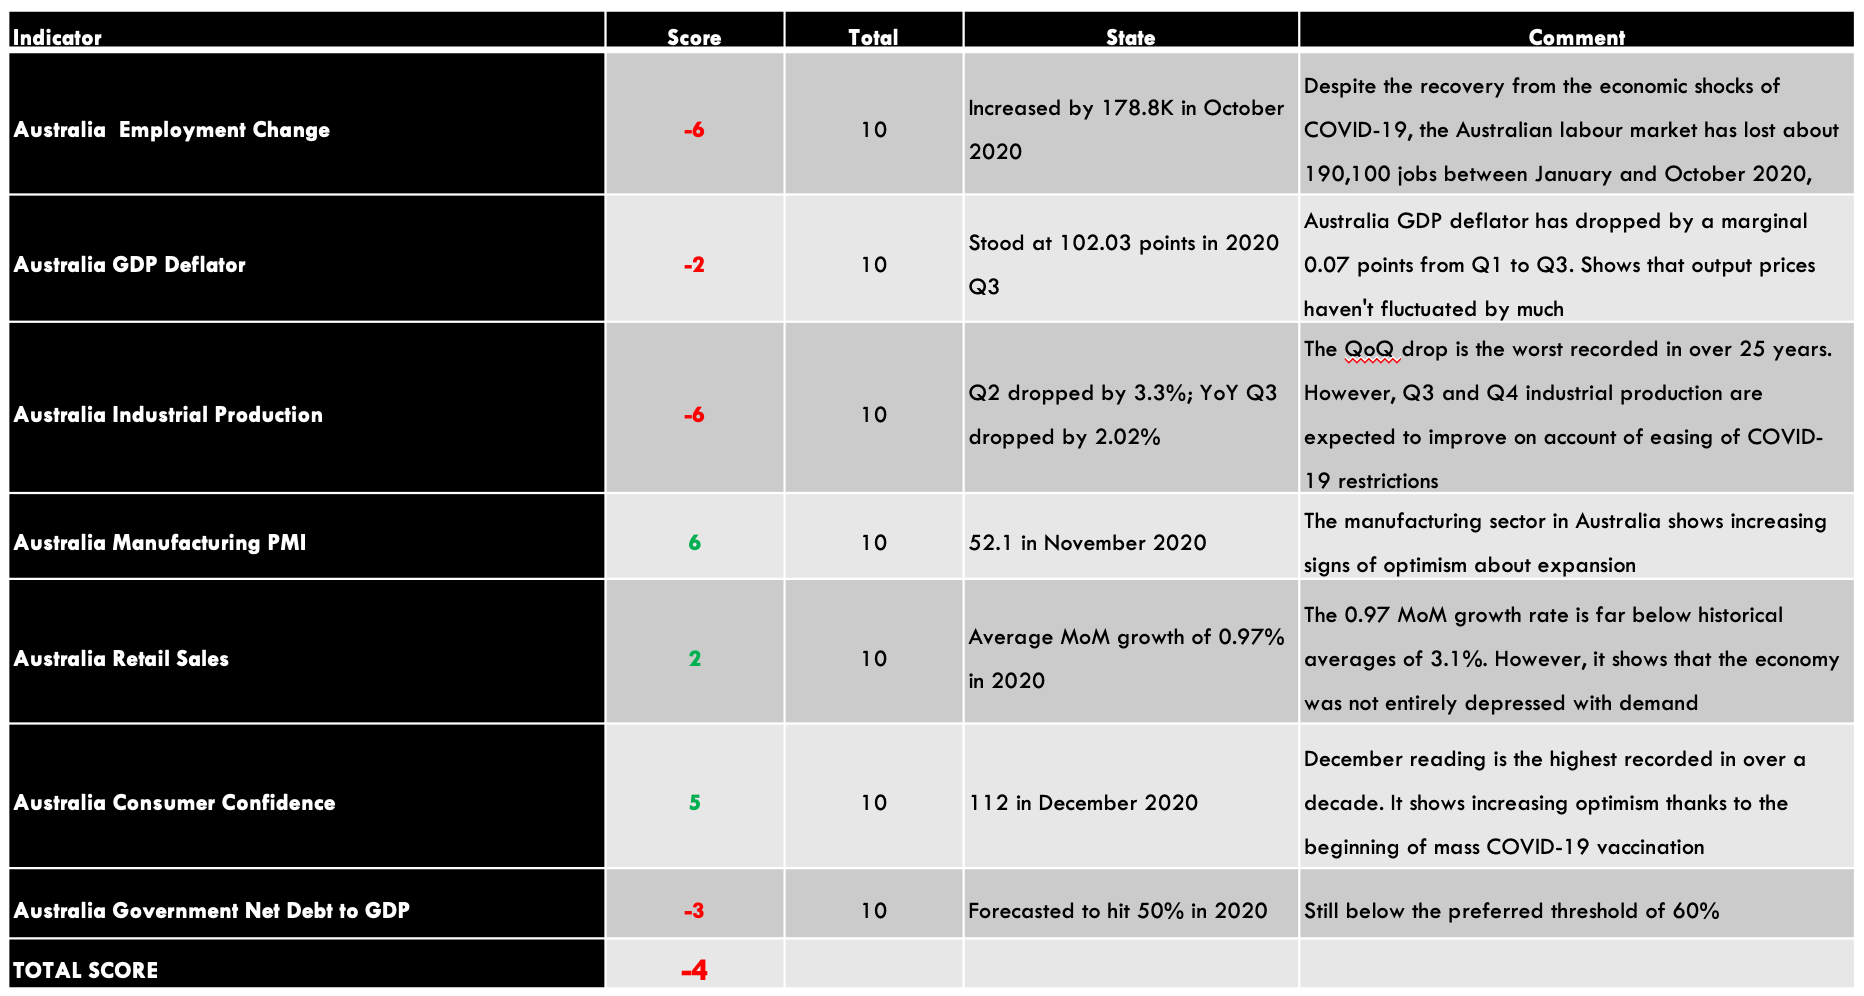
| Indicator | Score | Total | State | Comment |
| Australia Employment Rate | -3 | 10 | 61.2% in October | The employment rate hit 20-year lows during the pandemic. It’s expected to continue recovery as the economy recovers |
| Australia Core Consumer Prices | 2 | 10 | 117.49 in Q3 2020 | The inflation rate still lower than Q1, but the demand is increasing in the economy |
| Australia Manufacturing Production | -3 | 10 | Q3 projected to drop by 3.5% | Q2 dropped by 6.2%. Production expected to improve in Q3 as business operation resume some normalcy |
| Australia Business Confidence | 6 | 10 | NAB business confidence was 12 in November | It’s the highest level since April 2018. This shows that businesses are highly optimistic about their future operations |
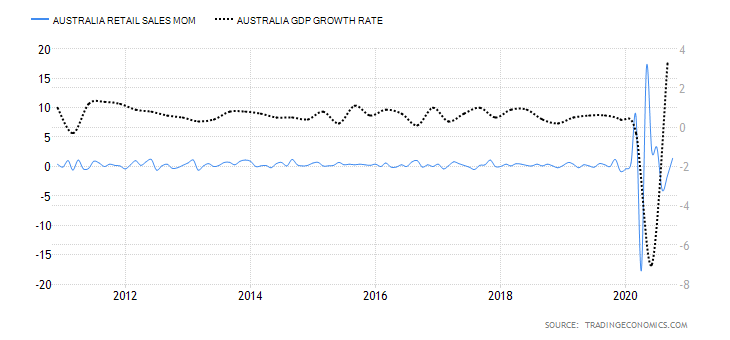
| Australia Consumer Spending | -3 | 10 | Was 253.648 billion AUD in Q3 2020 | Q3 levels still lower than Q1 domestic expenditure. Expected to increase further when the economy recovers to pre-pandemic levels |
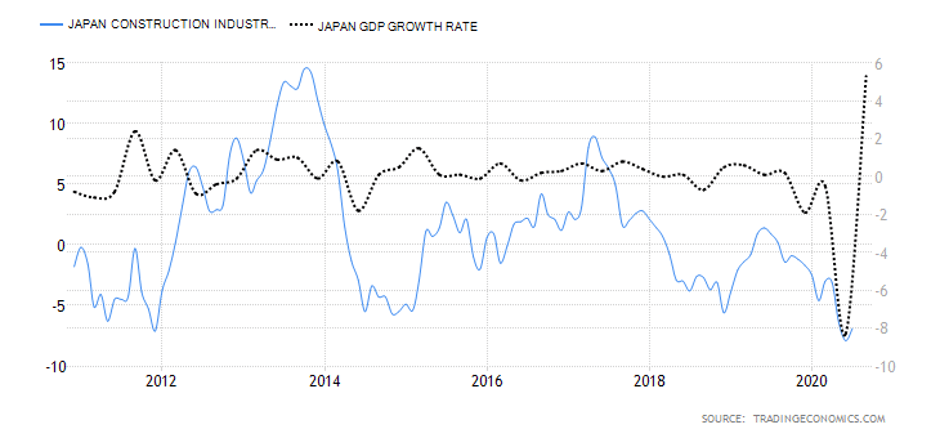
| Australia Construction Output | -3 | 10 | Q3 output dropped by 2.6% | Q3 drop caused by a reduction in residential and non-residential construction, engineering, and building works |
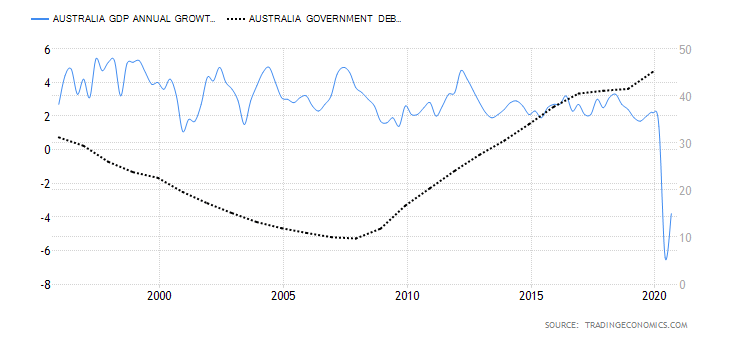
| Australia Government Budget Value | -4 | 10 | a budget deficit of 10.974 billion AUD in October | The government budget deficit is improving. This shows that the revenue stream is improving as businesses resume operations |
| TOTAL SCORE | -8 |
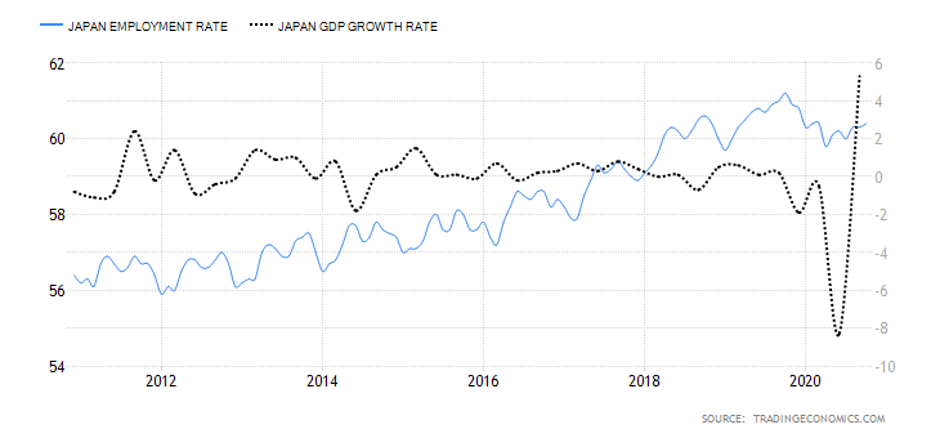
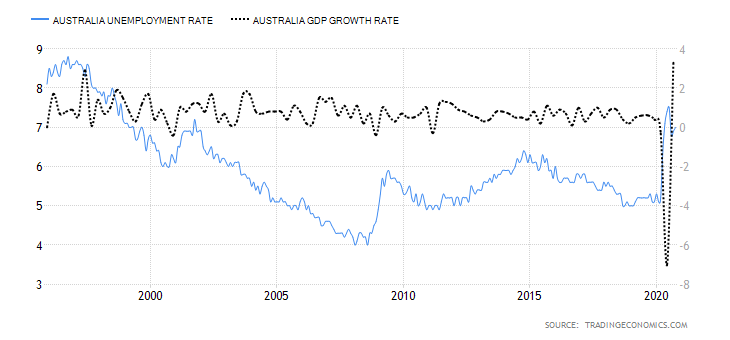
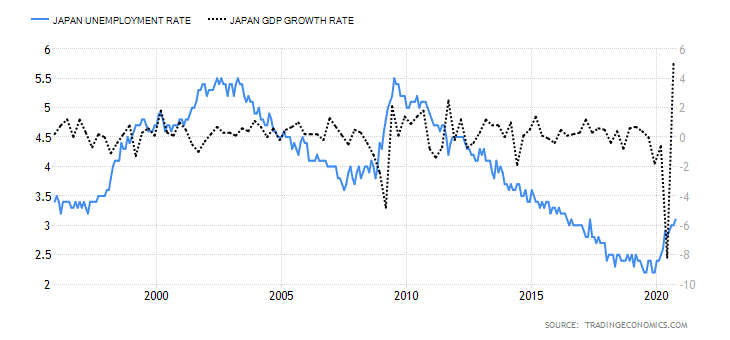
- Australia Employment Rate
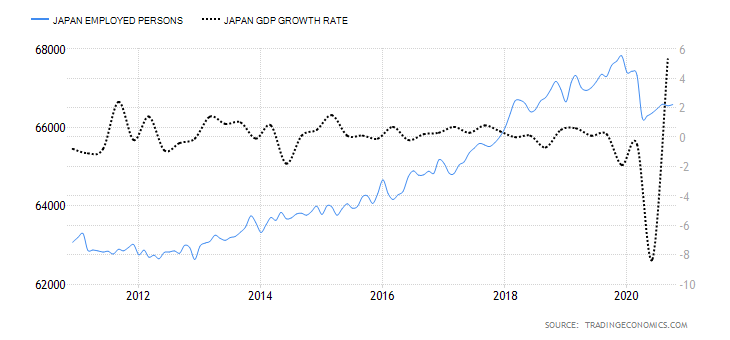
This indicator shows the number of working-age Australians who are employed during a particular period. As an indicator of growth in the labor market, the employment rate shows if the economy is adding or shedding jobs. Thus, it is used to show periods of economic growth and contractions.
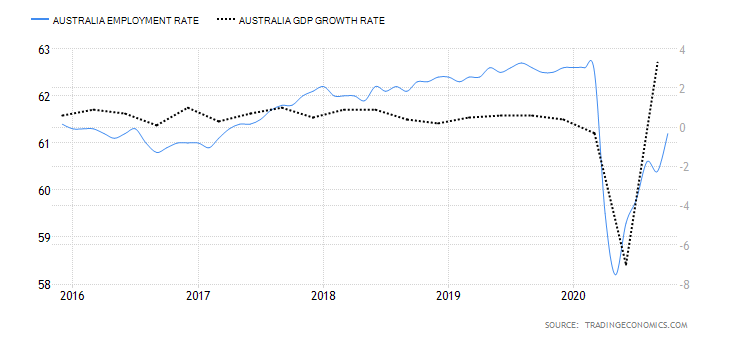
The Australian labor market has been recovering from the coronavirus pandemic shocks when the employment rate hit a 20-year low of 58.2%. In October 2020, Australia had an employment rate of 61.2%, up from 60.4% in September. However, it is still lower than January’s 62.6%. Australia’s employment rate has a score of -3.
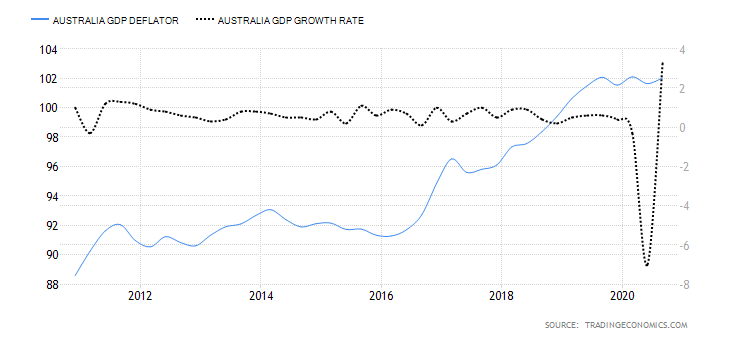
- Australia Trimmed Mean Consumer Prices
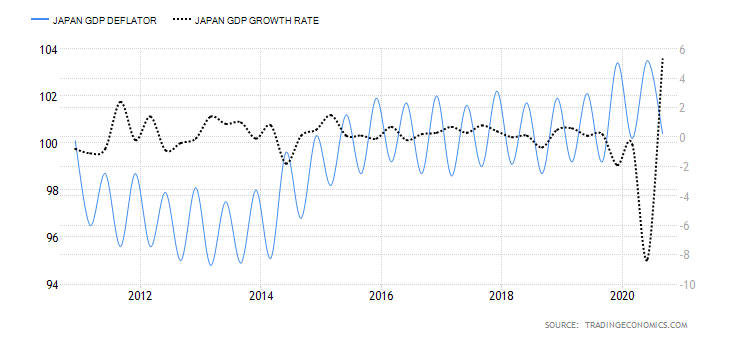
This indicator is also called core consumer prices. It measures the price changes of goods and services that are frequently purchased by Australian households. The computation of the trimmed mean consumer prices excludes goods and services whose prices are volatile.
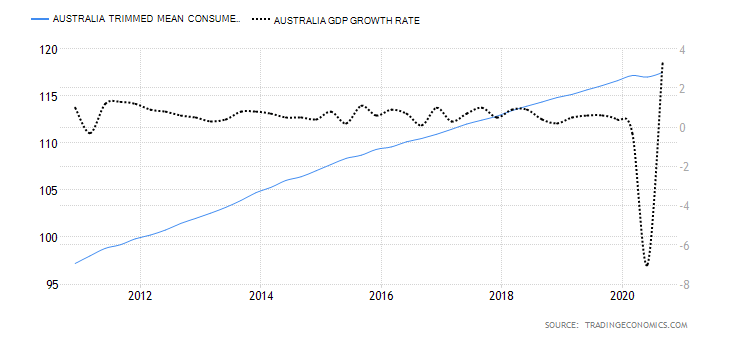
In Q3 2020, the core consumer prices in Australia rose to 117.49 from 117.04 in Q2. Q3 levels are also higher than the 117.17 points recorded in Q1. This shows that the economy is recovering since an increase in prices implies an increase in domestic demand for goods and services. We assign a score of 2.
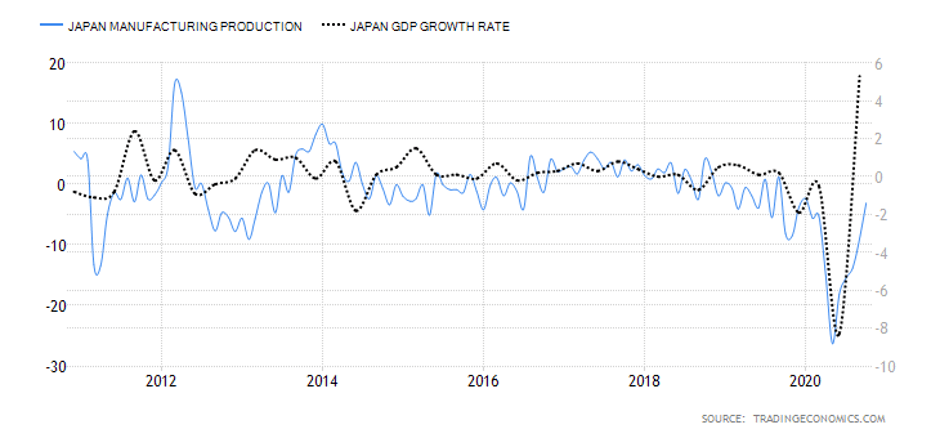
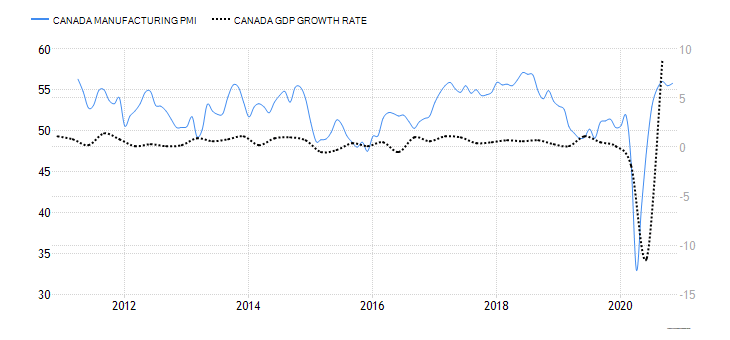
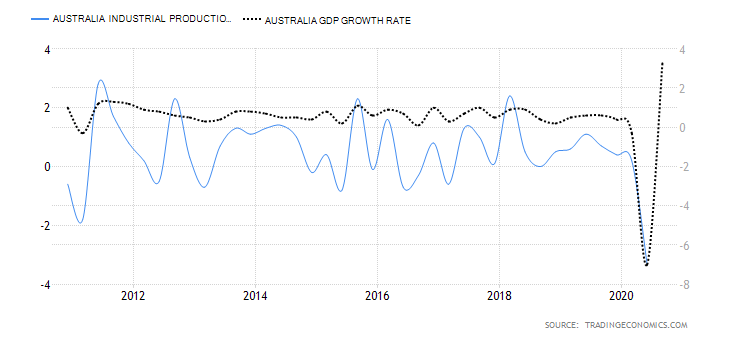
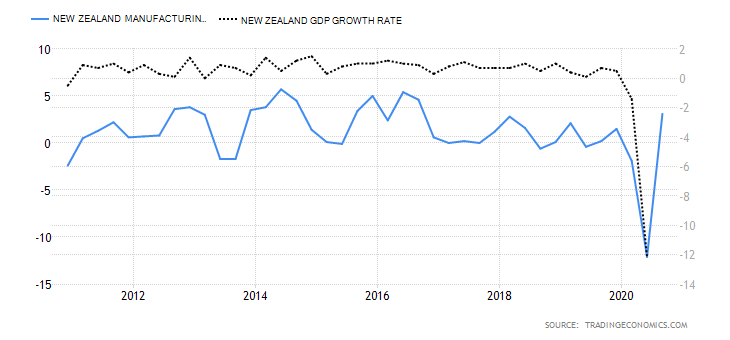
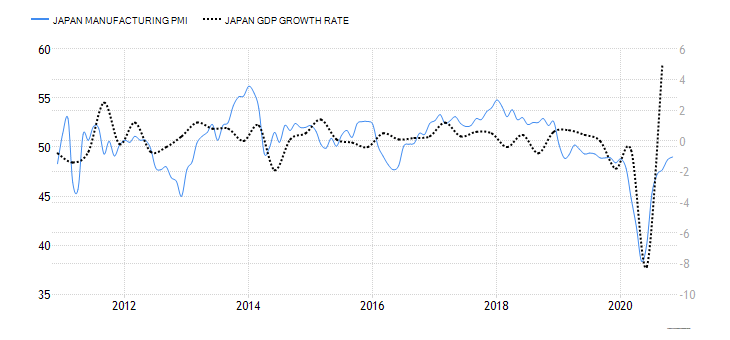
- Australia Manufacturing Production
This indicator shows the YoY change in the value of output from the manufacturing sector. The Australian economy is heavily dependent on industrial production; hence, manufacturing production changes provides invaluable insights into the domestic economic growth. It also shows how the economy is recovering from the impact of COVID-19.

In Q2 2020, the YoY manufacturing production in Australia dropped by 6.2%, compared to 2.7% growth in Q1. Q3 YoY manufacturing production is expected to drop by 3.5%. Consequently, Australian manufacturing production has a score of -3.
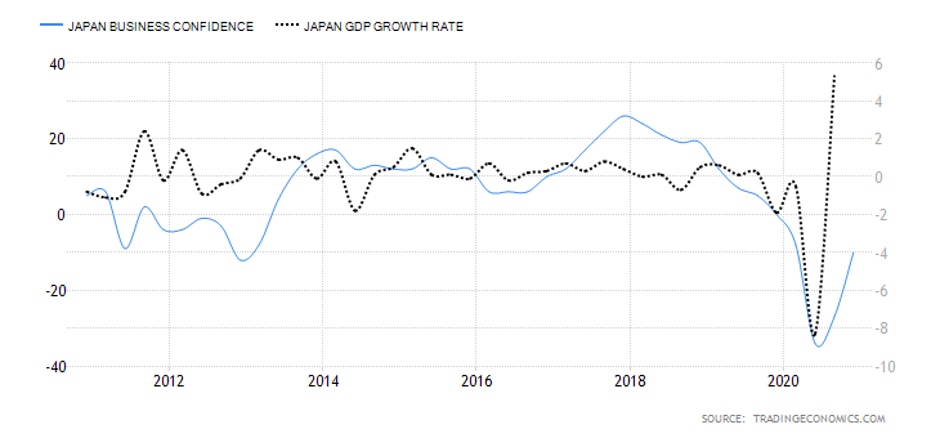
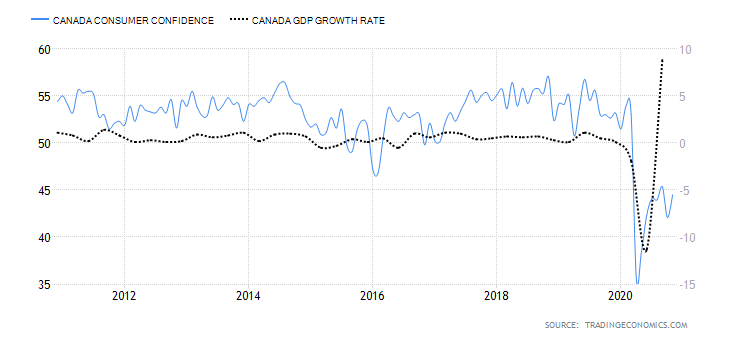
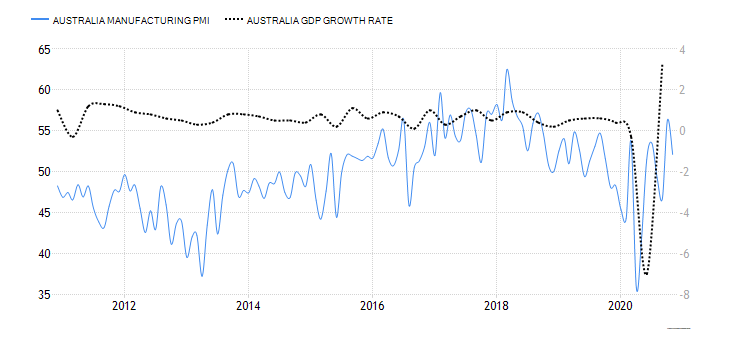
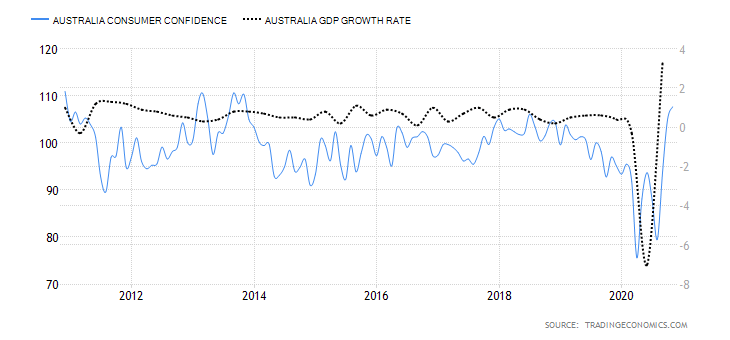
- Australia Business Confidence
Business confidence in Australia is measured by conducting a monthly survey of about 600 businesses. They include small, medium, and large companies operating in non-agricultural sectors. The survey gauges the businesses’ expectations in terms of profitability, trading volume, and employees. The index is derived by considering the percentage of respondents who have good and very good expectations and those who have a bad and very bad outlook.

In November 2020, the NAB business confidence increased to 12 from 3 in October, which has been the highest since April 2018. Australia’s business confidence has a score of 6.
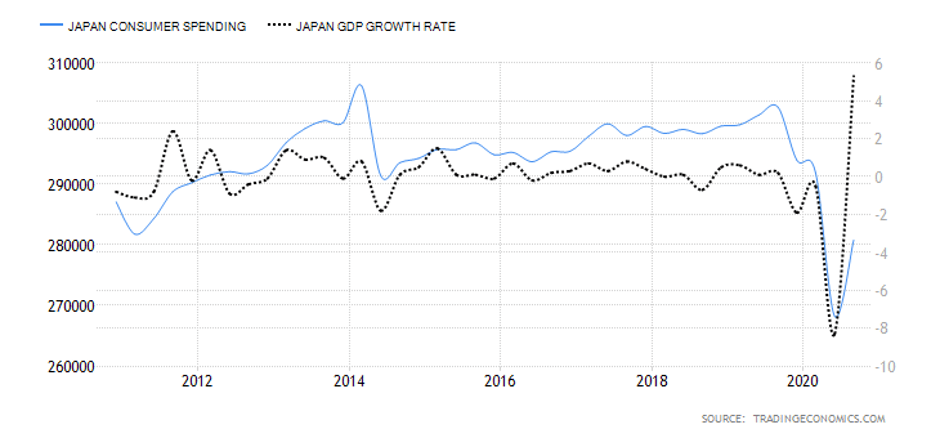
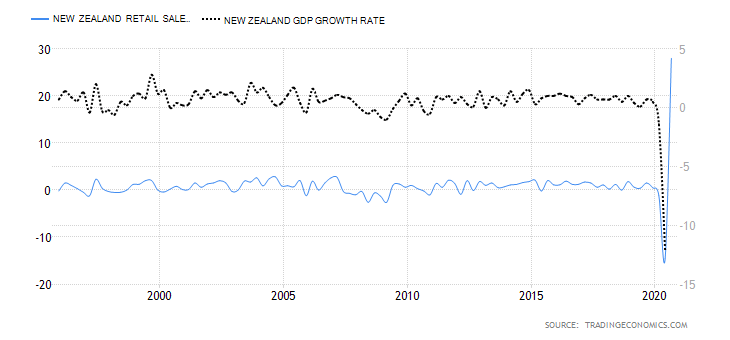
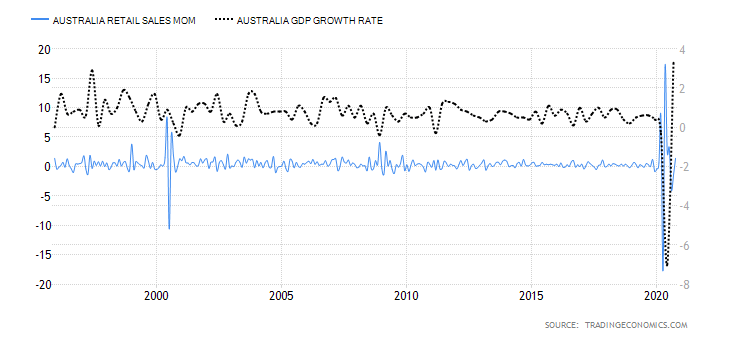
- Australia Consumer Spending
The indicator records the quarterly change in the value of goods and services consumed by domestic households. It includes expenditure by non-profit organizations that provide goods and services to Australian households and the value of backyard productions.
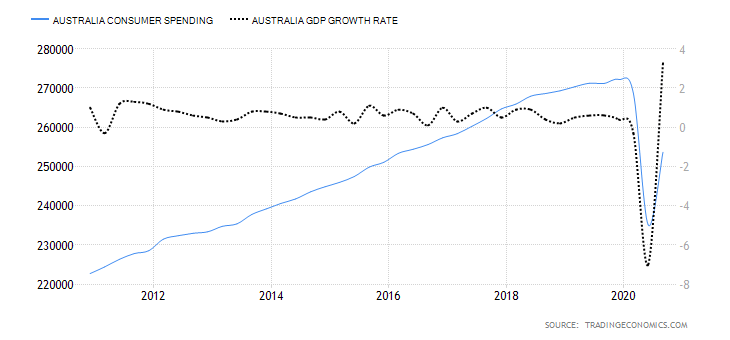
In Q3 of 2020, consumer spending in Australia rose to AUD 253.648 billion from AUD 235.131 billion in Q2. Although it’s lower than Q1 expenditure, domestic demand in the economy is rebounding from the slump of COVID-19. Consequently, Australian consumer spending has a score of -3.
- Australia Construction Output
This indicator shows the quarterly change in the value of construction work in Australia. The total value involves both private and public sector building and engineering work.
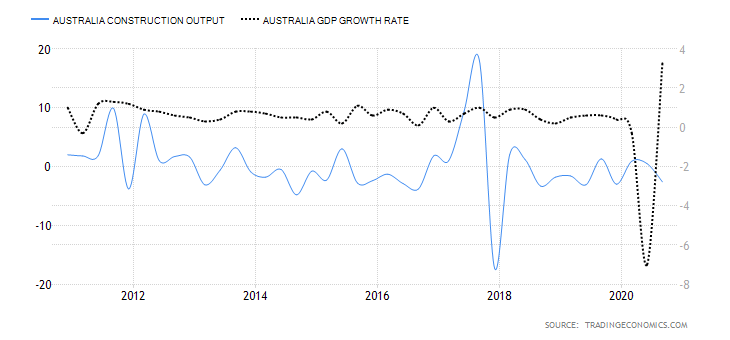
In the third quarter of 2020, Australia’s construction output dropped by 2.6% from a 0.5% growth in Q2. This drop was caused by output drop in residential and non-residential construction, engineering, and building works. Thus, we assign a score of -3.
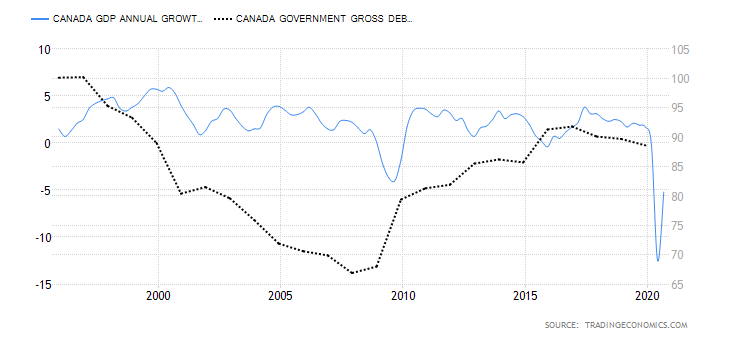
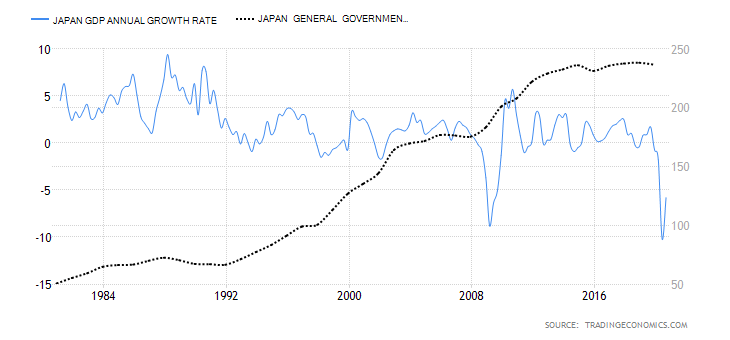
- Australia Government Budget Value
The government budget value measures whether the Australian government has a budget surplus or deficit. A budget surplus implies that the government’s expenditure is less than its revenue. Similarly, a budget deficit means that the government spends more than it collects in terms of revenue.
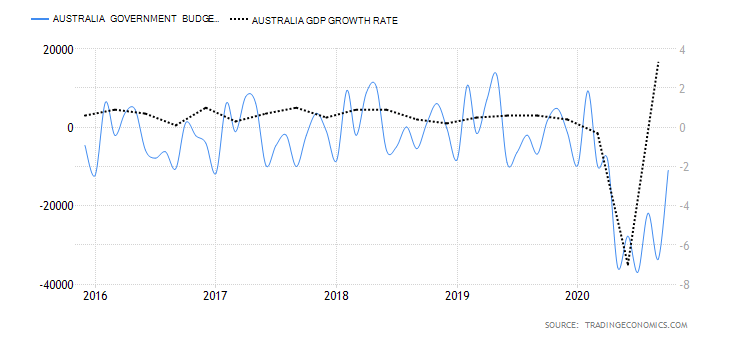
In October 2020, Australia had a budget deficit of AUD 10.974 billion, up from a deficit of 33.613 billion in September. We assign a score of -4.
In the next article, you can find the Exogenous analysis of the GBP/AUD currency pair and also our forecast on its price movement in the near future. Cheers.