JPY Endogenous Analysis
Summary
An overall score of -13 implies that this currency (JPY) has depreciated since the beginning of this year.
| Indicator | Score | Total | State | Comment |
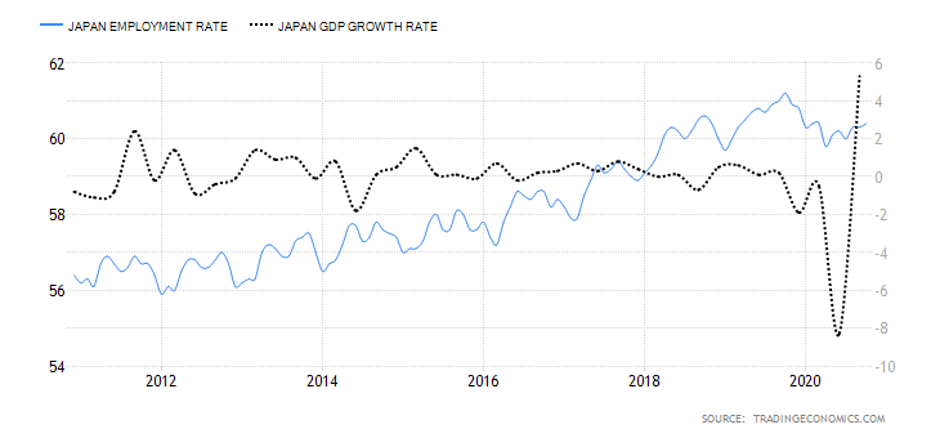
| Japan Employment Rate | -4 | 10 | 60.4% in October 2020 | The Japanese labor market has shed about 820,000 jobs between January and October 2020 |
| Japan Core Consumer Prices | -1 | 10 | 101.2 points in November 2020 | The index has dropped marginally by 0.8 points in the first 11 months |
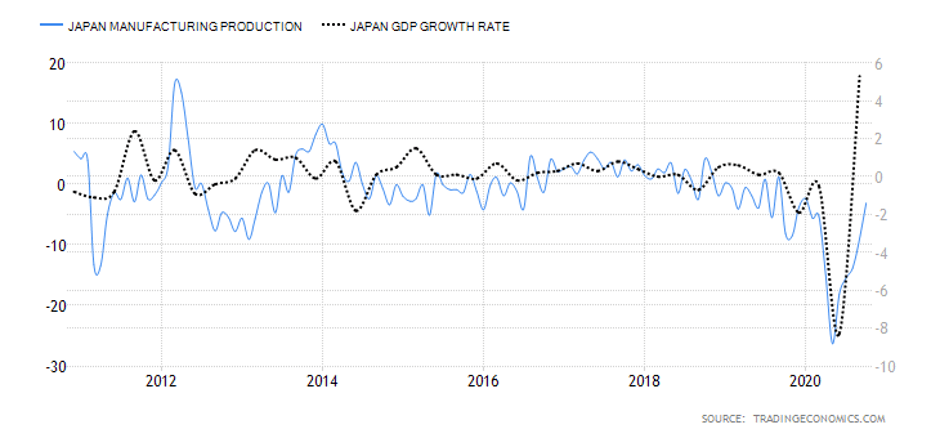
| Japan Manufacturing Production | 2 | 10 | 3.1% drop in October | The decrease in YoY manufacturing production is slowing down |
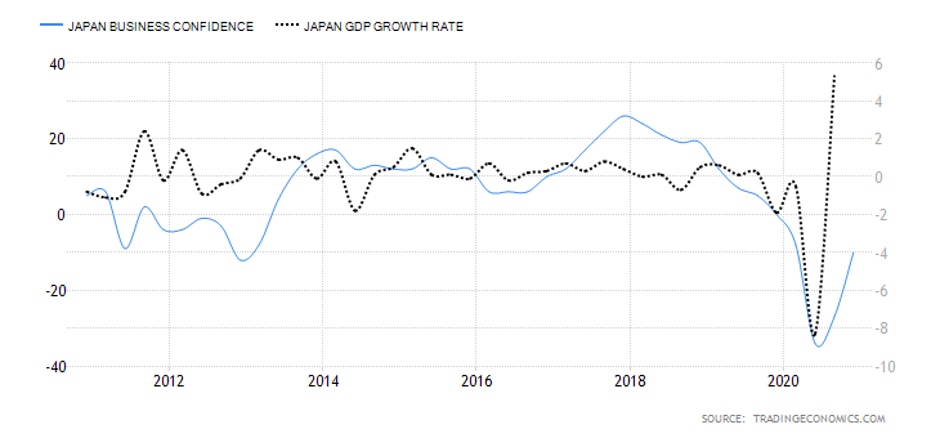
| Japan Business Confidence | -2 | 10 | Q4 reading was -10 | Businesses are growing increasingly optimistic |
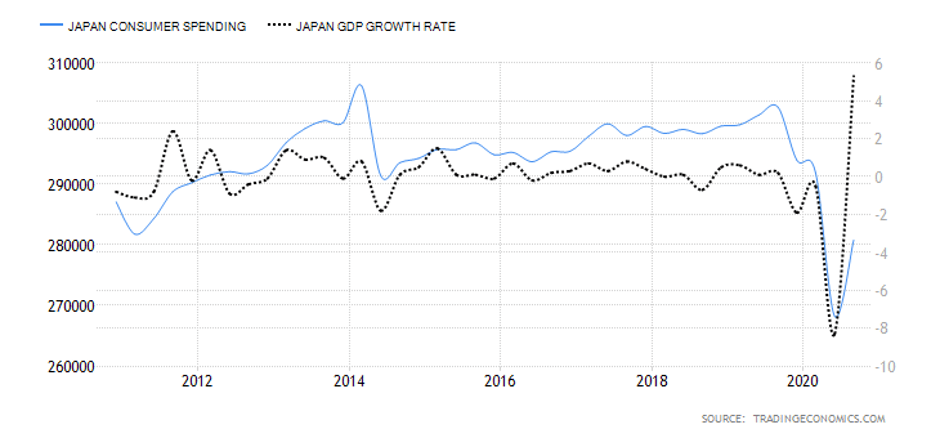
| Japan Consumer Spending | -2 | 10 | Was ¥280.8 trillion in Q3 2020 | The increase in Q3 expenditure by households shows that the economy is steadily recovering |
| Japan Construction Industry Activity | -2 | 10 | YoY drop of 6.9% in July 2020 | The July drop was the second-worst recorded in over ten years |
| Japan Government Budget Value | -4 | 10 | the budget deficit of ¥308414 in Q2 2020 | This is the worst deficit in 20 years. It’s expected to improve as the economy goes back to normal |
| TOTAL SCORE | -13 |
- Japan Employment Rate
This indicator shows the number of Japanese nationals employed as a percentage of the entire Japanese working-age population. With this indicator, we can track the Japanese economy’s performance since employment corresponds to the expansion and contraction of the economy.
In October 2020, the Japan employment rate rose to 60.4% from 60.3% in September. Although Japan’s employment rate is higher than in January, the labor market has lost about 820,000 jobs since January. We assign a score of -4.
- Japan Core Consumer Prices
Core consumer prices measure the inflation rate in Japan based on a select basket of goods. The core consumer prices do not include goods and services with volatile prices. Typically, when inflation rises, it implies that the economy is expanding and the labor market is growing. Conversely, when the index drops, it means that the labor market is shrinking.
In November 2020, Japan Core Consumer Prices dropped to 101.2 points from 101.3 in October. Since January, the index has shed 0.8 points. Thus, it scores a -1.
- Japan Manufacturing Production
This indicator measures the percentage change in the value of the output in the manufacturing sector. Since the Japanese economy is highly reliant on the manufacturing sector, changes in this indicator can be considered a leading indicator of economic growth.
In October 2020, the YoY manufacturing production in Japan decreased by 3.1% compared to the 9% decrease recorded in September. The October decrease is the slowest since February. We assign a score of 2.
- Japan Business Confidence
In Japan, the business confidence index results from a survey of about 1100 large manufacturers with a capital of at least ¥1 billion. The survey evaluates the current industry trends, business conditions within the company and the industry, and expectations for the next quarter and year. The sentiment in Japanese businesses is ranked with an index of a scale from -100 to +100. The negative index shows pessimism, while a positive index shows optimism.
In Q4 of 2020, the Bank of Japan’s Tankan business sentiment index increased to -10 from -27 in Q3. This improvement shows that the economy is potentially recovering from the impact of the COVID-19 pandemic. However, it is still lower than the -8 registered in Q1. Thus, we assign a score of -2.
- Japan Consumer Spending
It tracks the quarterly value of expenditure by households. In Japan, the consumption expenditure accounts for both the supply-side and demand-side. The supply-side from the survey of family income, while the demand-side is from the expenditure survey. The weighted average of both these estimates represents the final consumption expenditure.
In Q3 2020, the consumer spending in Japan rose to ¥280.8 trillion from ¥268.2 trillion in Q2. However, it is still lower than the consumer spending recorded in Q1. Japan consumer spending scores -4.
- Japan Construction Industry Activity
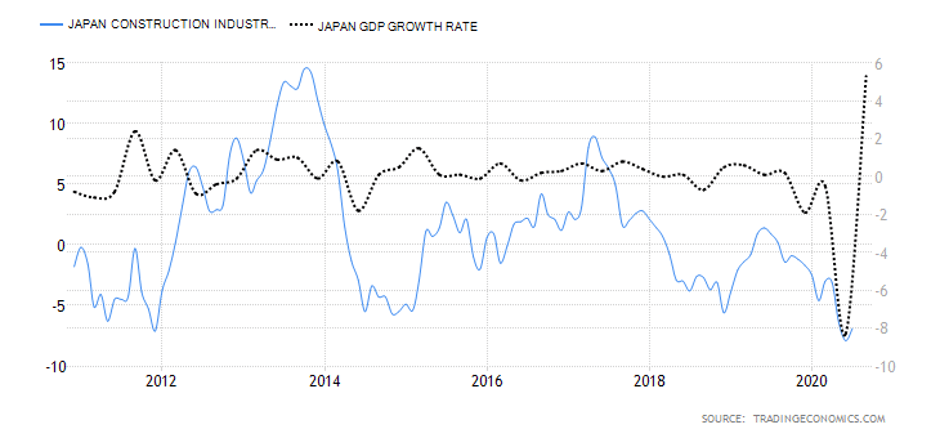
This index tracks the YoY changes in the construction industry in Japan. It shows the changes in companies’ monetary value of construction work and billed to the clients. Note that in Japan, the construction industry accounts for about 6% of the total industrial activity. Thus, the construction output index can be a leading indicator of the entire industrial activity. More so, since it is a tertiary industry, it can signal longer-term changes in the GDP.
In July 2020, Japan’s YoY construction output dropped by 6.9%. This drop is the second-worst in over ten years. The worst was recorded in June at -7.9%. The Japan construction industry activity scores -2.
- Japan Government Budget Value
In Japan, the government budget value evaluates the difference between government revenues and expenditure. This is meant to determine whether there is a government budget surplus or deficit. A budget surplus arises when revenues exceed the expenditure, while a deficit occurs when government expenditure is more than revenues.
In Q2 of 2020, Japan has a government budget deficit of ¥308414. This is the worst deficit recorded in over two decades. Thus, the Japan Government Budget Value has a score of -4.
In the upcoming article, you can find the Exogenous analysis of the GBP/JPY currency pair where we have forecasted its price movements. All the best.


