Categories
Forex Fundamental Analysis

GBP/JPY Global Macro Analysis – Part 2

JPY Endogenous Analysis

Summary

An overall score of -13 implies that this currency (JPY) has depreciated since the beginning of this year.

Indicator Score Total State Comment
Japan Employment Rate -4 10 60.4% in October 2020 The Japanese labor market has shed about 820,000 jobs between January and October 2020
Japan Core Consumer Prices -1 10 101.2 points in November 2020 The index has dropped marginally by 0.8 points in the first 11 months
Japan Manufacturing Production 2 10 3.1% drop in October The decrease in YoY manufacturing production is slowing down
Japan  Business Confidence -2 10 Q4 reading was -10 Businesses are growing increasingly optimistic
Japan Consumer Spending -2 10 Was ¥280.8 trillion in Q3 2020 The increase in Q3 expenditure by households shows that the economy is steadily recovering
Japan Construction Industry Activity -2 10 YoY drop of 6.9% in July 2020 The July drop was the second-worst recorded in over ten years
Japan Government Budget Value -4 10 the budget deficit of ¥308414 in Q2 2020 This is the worst deficit in 20 years. It’s expected to improve as the economy goes back to normal
TOTAL SCORE -13
  • Japan Employment Rate

This indicator shows the number of Japanese nationals employed as a percentage of the entire Japanese working-age population. With this indicator, we can track the Japanese economy’s performance since employment corresponds to the expansion and contraction of the economy.

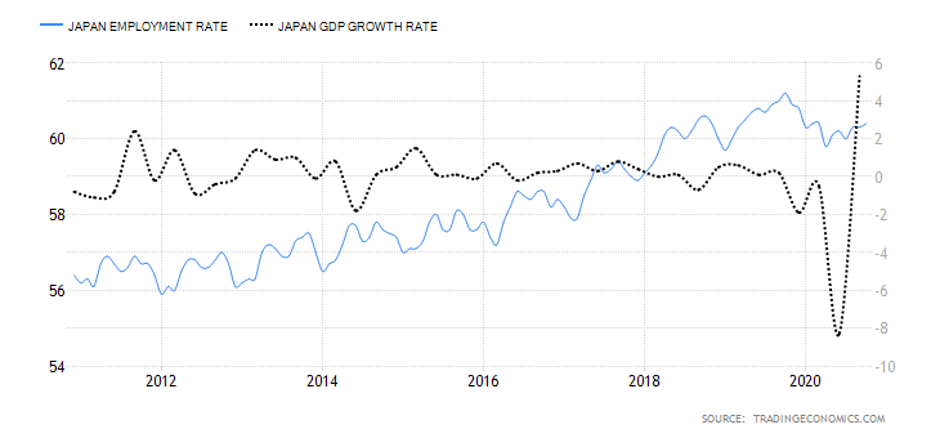
In October 2020, the Japan employment rate rose to 60.4% from 60.3% in September. Although Japan’s employment rate is higher than in January, the labor market has lost about 820,000 jobs since January. We assign a score of -4.

  • Japan Core Consumer Prices

Core consumer prices measure the inflation rate in Japan based on a select basket of goods. The core consumer prices do not include goods and services with volatile prices. Typically, when inflation rises, it implies that the economy is expanding and the labor market is growing. Conversely, when the index drops, it means that the labor market is shrinking.

In November 2020, Japan Core Consumer Prices dropped to 101.2 points from 101.3 in October. Since January, the index has shed 0.8 points. Thus, it scores a -1.

  • Japan Manufacturing Production

This indicator measures the percentage change in the value of the output in the manufacturing sector. Since the Japanese economy is highly reliant on the manufacturing sector, changes in this indicator can be considered a leading indicator of economic growth.

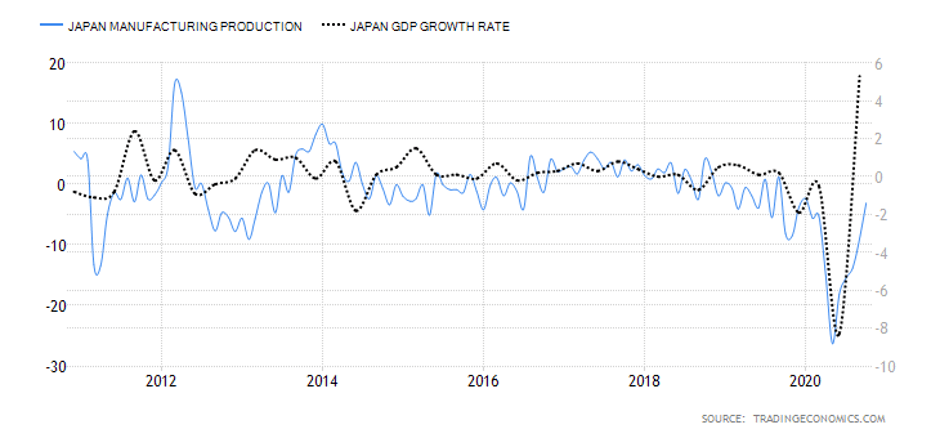
In October 2020, the YoY manufacturing production in Japan decreased by 3.1% compared to the 9% decrease recorded in September. The October decrease is the slowest since February.  We assign a score of 2.

  • Japan Business Confidence

In Japan, the business confidence index results from a survey of about 1100 large manufacturers with a capital of at least ¥1 billion. The survey evaluates the current industry trends, business conditions within the company and the industry, and expectations for the next quarter and year. The sentiment in Japanese businesses is ranked with an index of a scale from -100 to +100. The negative index shows pessimism, while a positive index shows optimism.

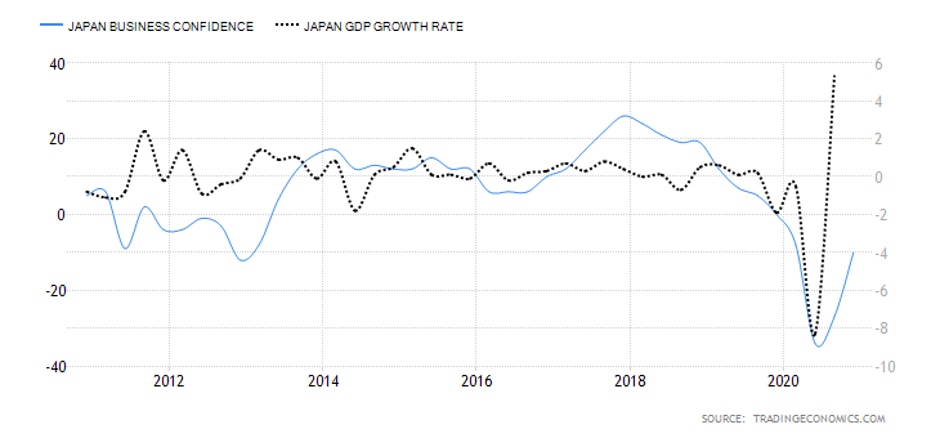
In Q4 of 2020, the Bank of Japan’s Tankan business sentiment index increased to -10 from -27 in Q3. This improvement shows that the economy is potentially recovering from the impact of the COVID-19 pandemic. However, it is still lower than the -8 registered in Q1. Thus, we assign a score of -2.

  • Japan Consumer Spending

It tracks the quarterly value of expenditure by households. In Japan, the consumption expenditure accounts for both the supply-side and demand-side. The supply-side from the survey of family income, while the demand-side is from the expenditure survey. The weighted average of both these estimates represents the final consumption expenditure.

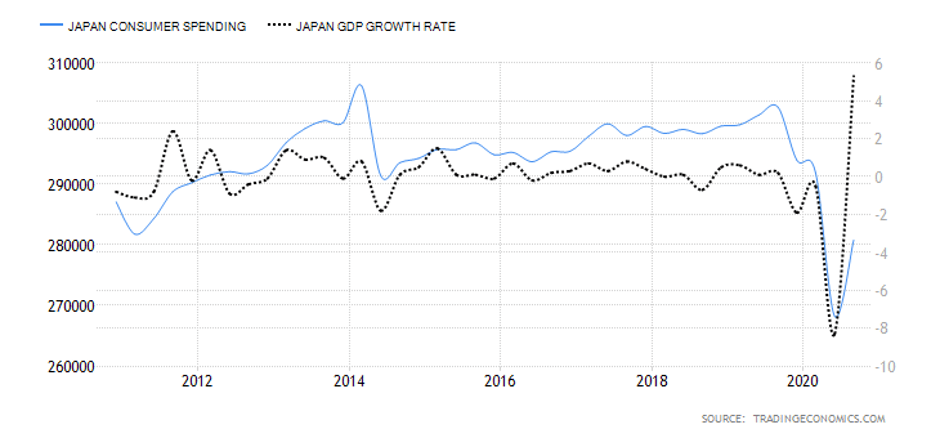
In Q3 2020, the consumer spending in Japan rose to ¥280.8 trillion from ¥268.2 trillion in Q2. However, it is still lower than the consumer spending recorded in Q1. Japan consumer spending scores -4.

  • Japan Construction Industry Activity

This index tracks the YoY changes in the construction industry in Japan. It shows the changes in companies’ monetary value of construction work and billed to the clients. Note that in Japan, the construction industry accounts for about 6% of the total industrial activity. Thus, the construction output index can be a leading indicator of the entire industrial activity. More so, since it is a tertiary industry, it can signal longer-term changes in the GDP.

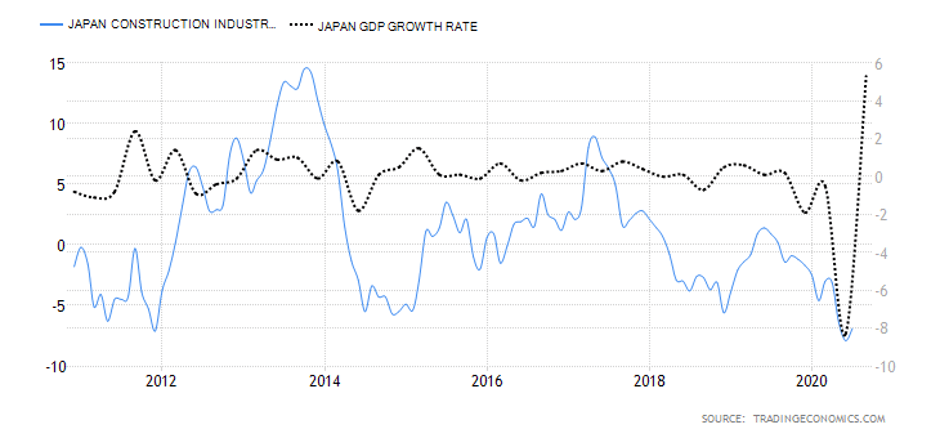
In July 2020, Japan’s YoY construction output dropped by 6.9%. This drop is the second-worst in over ten years. The worst was recorded in June at -7.9%. The Japan construction industry activity scores -2.

  • Japan Government Budget Value

In Japan, the government budget value evaluates the difference between government revenues and expenditure. This is meant to determine whether there is a government budget surplus or deficit. A budget surplus arises when revenues exceed the expenditure, while a deficit occurs when government expenditure is more than revenues.

In Q2 of 2020, Japan has a government budget deficit of ¥308414. This is the worst deficit recorded in over two decades. Thus, the Japan Government Budget Value has a score of -4.

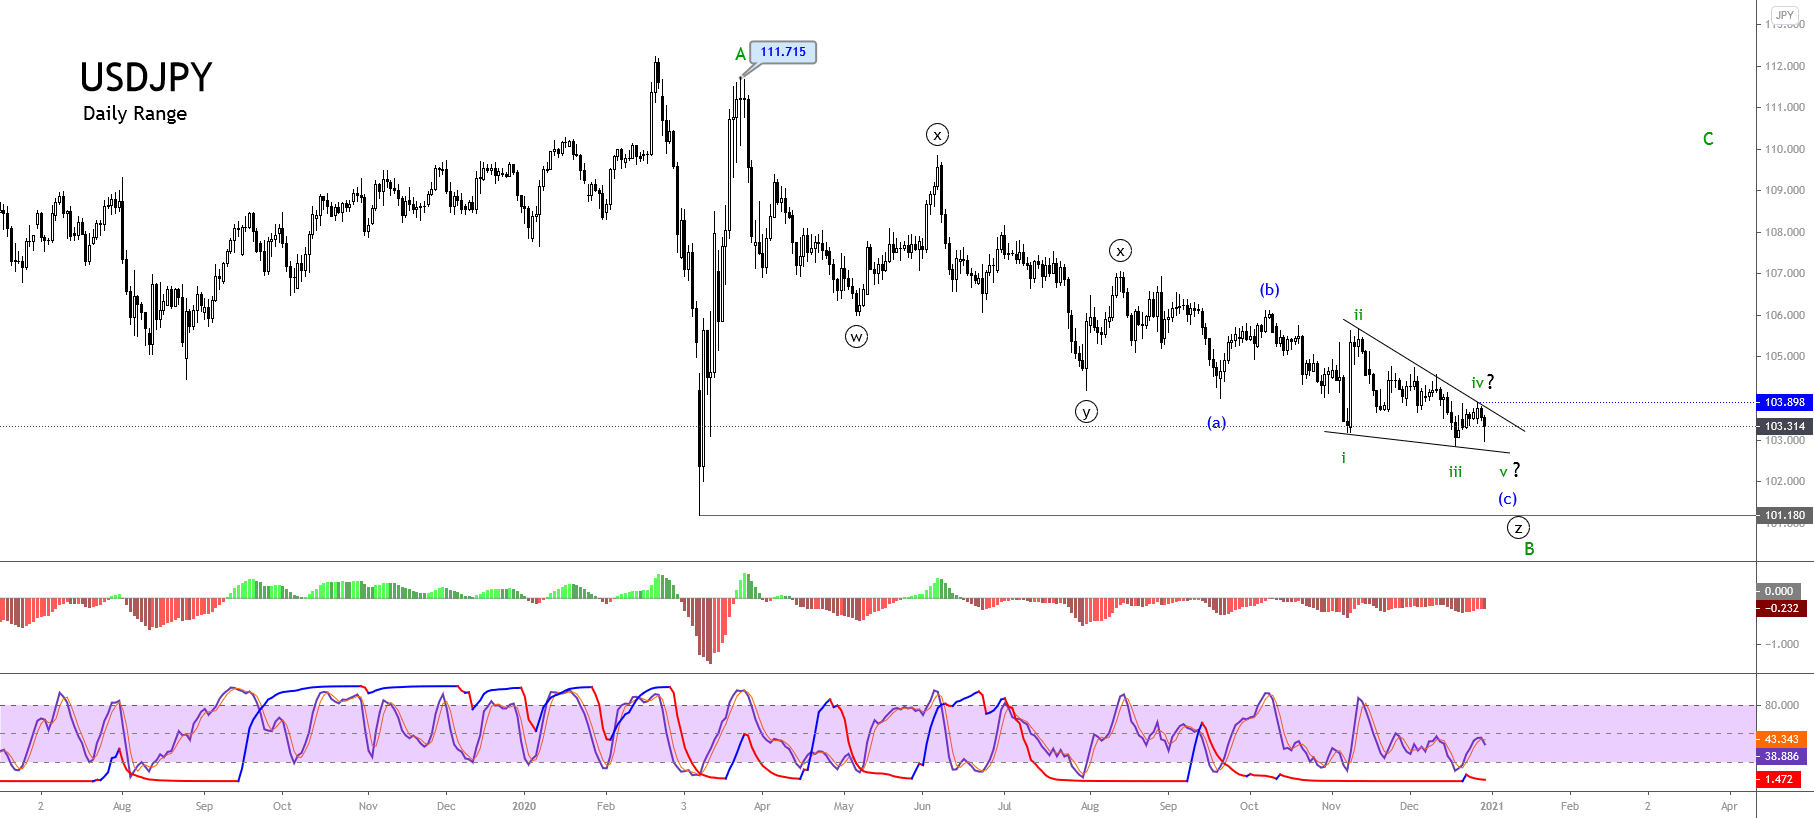
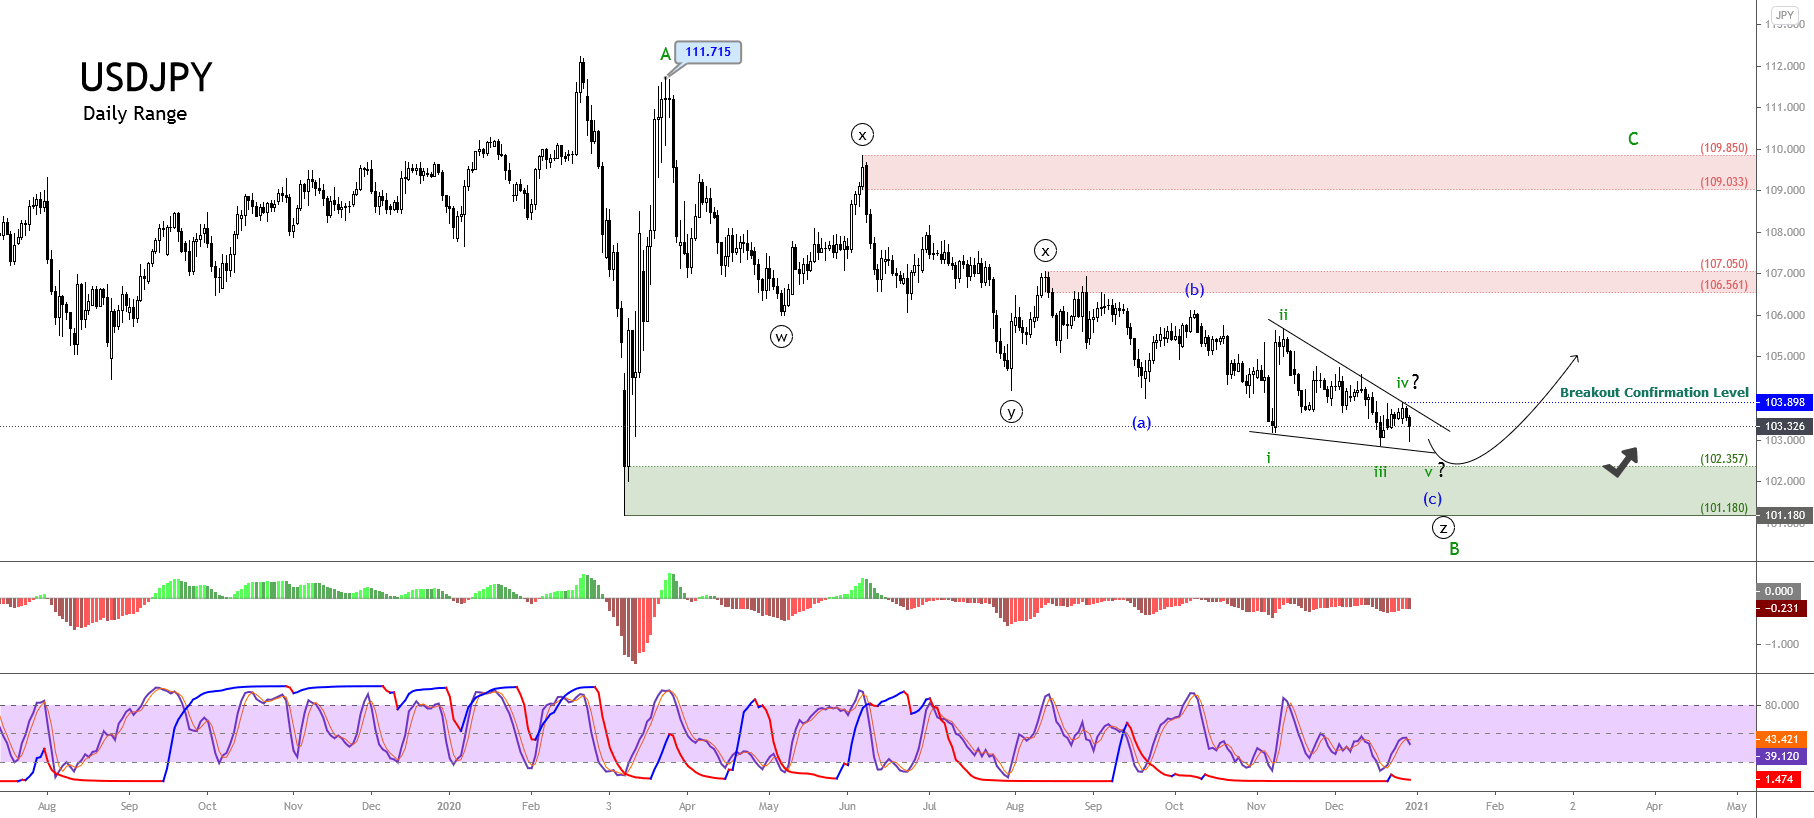
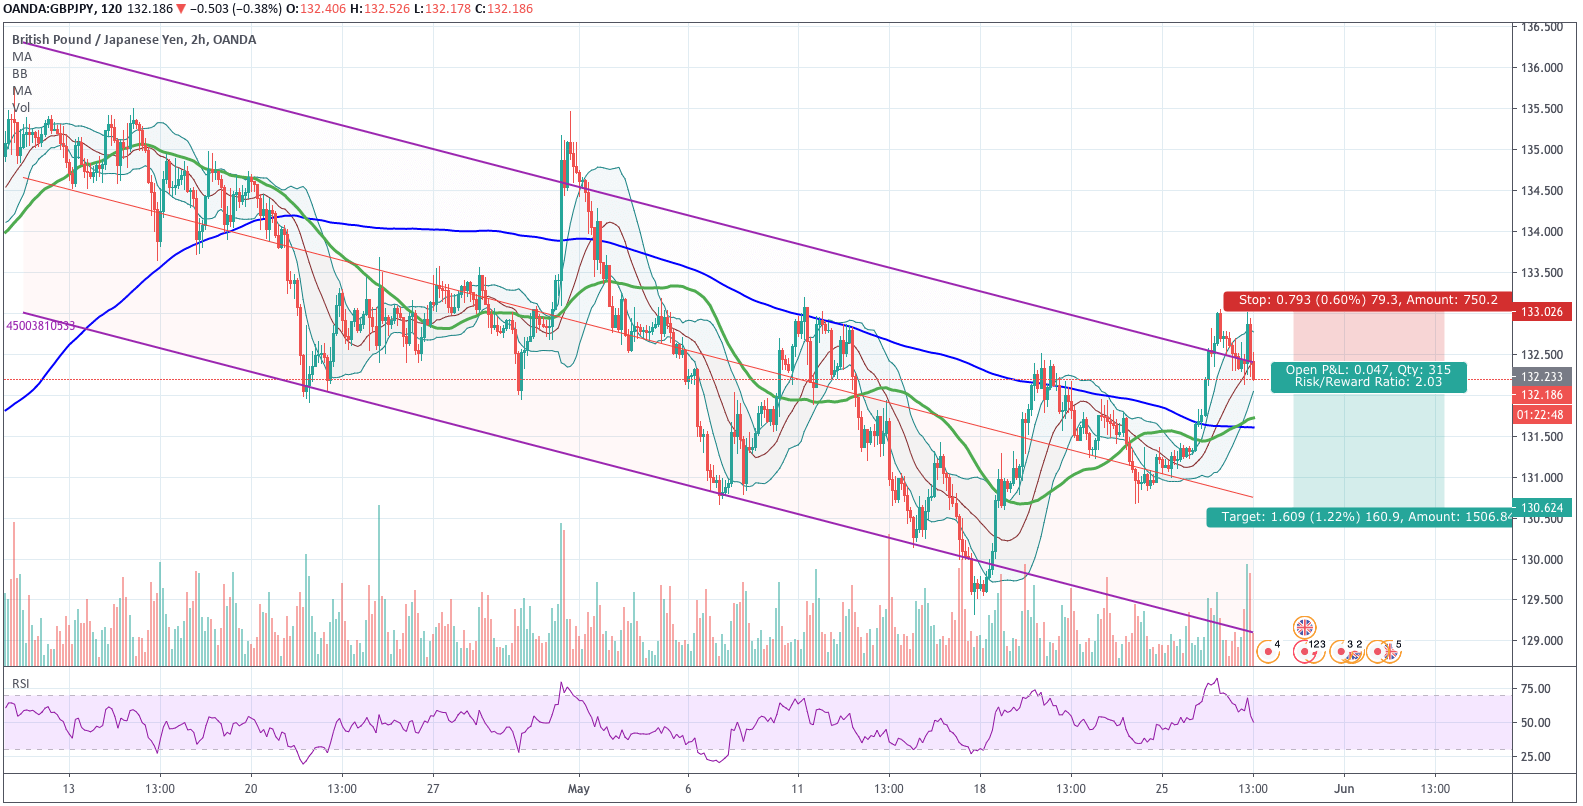
In the upcoming article, you can find the Exogenous analysis of the GBP/JPY currency pair where we have forecasted its price movements. All the best.

Categories
Forex Market Analysis

USD/JPY Complex Correction, What does that mean for Traders?

The USDJPY pair is progressing in an Elliott wave complex correction identified as a triple-three pattern (3-3-3-3-3) of Minute degree, labeled in black. The completion of this downward corrective formation suggests the start of a new rally of the same degree.

Technical Overview

The following daily chart shows the USDJPY pair advancing in a corrective structure of Minor degree labeled in green, which began on last March 09th when the price found support at 101.180, from where the price started an aggressive rally that has found resistance and completed wave A in green at 111.715 on March 24th.

According to the Elliot Wave theory’s alternation principle, if the first move is aggressive, the next path should be a slow move elapsing more time than the previous leg. Likely, the second leg will be a triangle or a complex corrective formation. In this regard, the second leg corresponding to wave B in green shows the progress in a triple-three pattern, which follows an internal sequence subdivided into 3-3-3-3-3, where each three is a simple corrective formation.

On the other hand, the MACD oscillator endorses the downward corrective sequence that remains in progress. Likewise, the momentum and timing oscillator confirms the bearish pressure in play. It suggests the possibility of a new decline completing the ending diagonal pattern in progress corresponding to wave (c) of Minuette degree labeled in blue.

Technical Outlook

The long-term outlook for the USDJPY pair under the Elliott Wave perspective, shown in the following daily chart, foresees a potential limited decline until the demand zone, between 102.357 and 101.180, where the price could find fresh buyers expecting to join in the next rally.

The confirmation of its recovery would occur if the USDJPY breaks and closes above the 103.898 level, which corresponds to the end of wave iv of Subminuette degree labeled in green. This potential next rally corresponding to wave C of Minor degree should follow an internal sequence subdivided into five waves. Likewise, if the price extends its gains, USDJPY could continue rallying toward the next supply zone bounded between 109.033 and 109.850. On the other hand, the invalidation of this bullish scenario occurs if the price extends its drops below 101.180.

In summary, the USDJPY pair advances in an incomplete complex corrective pattern identified as a triple-three formation, which currently moves in its third internal segment of wave ((z)). In this regard, the price could decline toward the next demand zone between 102.357 and 101.180. If the price confirms the bottom and starts the rally, the wave C will be confirmed if the price breaks and closes above 103.898. The first potential target is located between 106.561 and 107.050; the second potential target zone is placed between 109.033 until 109.850. Finally, the bullish scenario’s invalidation level is set at 101.180, which corresponds to the March 09th low.

Categories
Forex Market Analysis

Daily F.X. Analysis, June 9 – Top Trade Setups In Forex – European GDP in Highlights! 

On the news front, the Eurozone is due to release series of high impact events that may drive movements in the Euro related currency pairs. The events like trade balance, GDP, and final employment change will be in the highlights.

Economic Events to Watch Today


EUR/USD – Daily Analysis

The EUR/US prices were closed at 1.12937 after placing a high of 1.3196 and a low of 1.12680. Overall the movement of the EUR/USD pair remained flat throughout the day.

On Monday, the President of the European Central Bank, Christine Lagarde, said that the central bank’s measure to fight the coronavirus crisis was proportionate to the severe risks facing its mandate.

Lagarde said during a hearing at the Committee on economic and monetary affairs of the European Parliament, which was conducted via video conference, that the crisis-related measures were temporary, targeted, and proportionate.

On Thursday in its monetary policy decision, ECB announced an additional 600 billion euros in its pandemic emergency purchase program (PEPP) and scaled up its previous 750 billion Euro, to extend the program till mid-2021.

According to Lagarde, ECB continuously monitors the proportionality of its instruments, and she said that the net effects to be gained by PEPP expansion were overwhelmingly positive. The need for expansion was to avoid any deeper recession and quickening the pathway towards normalization.

When asked about the German court ruling of the ECB’s massive public sector purchase program, she said she was confident that a solution could be found because it was addressed to the German federal government and the German Parliament.

On the data front, at 11:00 GMT, the German Industrial Production showed a decline of 17.9% in April against the expectations of 16% and weighed on shared currency euro. AT 13:30 GMT, the Sentix Investor Confidence from the Eurozone for June decline to 24.8 from the expected reduction of 22.0 and weighed on Euro.

The depressed Euro after inferior to expected German Industrial Production dragged the pair EUR/USD with itself to the low of 1.12680.

Meanwhile, Lagarde’s Speech explaining the benefits of ECB’s latest expansion in PEPP provided strength to Euro, which pushed the EUR/USD pair higher.

Lagarde’s Speech and economic data from Eurozone moved in the opposite direction, and hence, the pair EUR/USD remained flat throughout the day as it closed at the same level it was started with. No data was to be released from the American side, so the pair followed Euro’s directions.

Daily Support and Resistance

  • R3 1.1357
  • R2 1.1338
  • R1 1.1327

Pivot Point 1.1308

  • S1 1.1296
  • S2 1.1278
  • S3 1.1266

EUR/USD– Trading Tip

The EUR/USD is consolidating in a narrow trading range of 1.1370 – 1.1276 level, and right now, it seems to break out of this trading range. On the lower side, the next target level seems to be 1.1185. Currently, the pair is facing immediate support around 1.1274 level, and closing of candles below this level may lead the EUR/USD prices further lower towards 1.1185 level, which is extended by the 50 EMA level. On the higher side, resistance holds at 1.1315 level today. Odds of bearish bias remains solid today.


GBP/USD – Daily Analysis

The GBP/USD pair was closed at 1.27235 after placing a high of 1.27358 and a low of 1.26278. Overall the movement of GBP/USD remained bullish throughout the day. The broad-based U.S. dollar selling bias after the positive tone around greenback followed by Friday’s job report vanished pushed the pair GBP/USD higher on Monday. The currency pair GBP/USD raised for the 8th consecutive day on Monday and continued its bullish rally.

The weakness of the U.S. dollar was attributed to weak U.S. yields. The U.S. dollar index (DXY) turned negative on the day and fell back to below 97.00 level. The U.S. stock was high on the back of increased risk appetite.

On the other hand, the E.U. chief negotiator, Michel Barnier, was supposed to present a compromise proposal on access to British waters during the latest round of talks, but at the last minute, he was blocked to present the proposal by its member states with large fishing communities.

E.U. now expects the talks to drag into October, but the U.K. has ruled it out and said that it was unacceptable. E.U. wanted to intensify and accelerate its work to make progress with the negotiations, and the U.K. need to prepare its businesses for a new trading environment.

On the fishing issue, the E.U. wants the U.K. to follow the structures of standard fisheries policy (CFP) from the end of 2020. But British fishing communities claim that the policy left the U.K. with far too few fish to catch, so they want to be an independent coastal state from the end of 2020. On the data front, there was no macroeconomic data to be released from both sides so, the pair continued following its previous day’s trend and posted gains on the back of the risk-on market sentiment.

Daily Support and Resistance

  • R3 1.28
  • R2 1.2765
  • R1 1.2742

Pivot Point 1.2707

  • S1 1.2684
  • S2 1.2649
  • S3 1.2627

GBP/USD– Trading Tip

The GBP/USD’s overall trend is bullish as the pair continues to reach 1.2690 levels, having violated the triple top level on the 4-hour timeframe. The pair is retracing a bit; perhaps, investors are doing some profit-taking before taking any additional buying position in Sterling. Bullish trend continuation leads to GBP/USD prices towards the next resistance level of 1.2760 level. Above this, the next resistance holds around 1.2795 level. Conversely, the support is likely to be found around 1.2665 and 1.2601 level today. Let’s look for selling below 1.2707 and buying above this level today. 


USD/JPY – Daily Analysis

 The USD/JPY pair was closed at 108.426 after placing a high of 109.691 and a low of 108.232. Overall the movement of the USD/JPY pair remained strongly bearish throughout the day. The pair USD/JPY posted a steeper loss on Monday amid the broad-based U.S. dollar weakness and improved Japanese economic outlook. The pair dropped on Monday after posting gains for the previous four consecutive days.

On the data front, at 4:50 GMT, the Bank Lending for the year from Japan increased to 4.8% in May from 2.9% in April. The Final GDP for the quarter decreased by 0.6% against the expected decline of 0.5% and weighed on Yen. At 4:52 GMT, the Current Account Balance for April came short of expectations of 0.33T as 0.25T and weighed on Japanese Yen. The Final GDP Price Index for the year came in line with the expectations if 0.9%. At 10:02 GMT, the Economy Watchers Sentiment, however, came in favor of Japanese Yen as 15.5 against the expected 12.6.

The preliminary reading of Japan’s Q1 GDP moved from -0.9% to -0.6% and came in better, which indicated the readiness of Japanese policymakers with extra stimulus if needed to fight against the pandemic.

Moreover, the better outlook of Japan’s current economic condition supported the Japanese Yen on Monday and weighed on the USD/JPY pair.

On the other hand, despite upbeat economic data from the U.S., the greenback lost its demand due to the drop in risk barometer that day. The rush of traders’ return from riskier assets weighed on the U.S. dollar and made it weak. 

Daily Support and Resistance    

  • R3 110.81
  • R2 110.25
  • R1 109.34

Pivot Point 108.79

  • S1 107.88
  • S2 107.33
  • S3 106.42

USD/JPY – Trading Tips

The USD/JPY fell dramatically to violate the narrow trading range of 109.800 – 109.255, and now it’s trading somewhere around 107.900. On the 4 hour timeframe, the USD/JPY is likely to find support at 107.900, and below this, the upward trendline may extend support around 107.600 level. The Japanese currency pair has already crossed below 50 EMA, favoring selling bias in the pair today. Let’s consider taking selling trades below 108.50 today. Good luck! 

Categories
Forex Market Analysis

Daily F.X. Analysis, June 8 – Top Trade Setups In Forex – Dollar Strengthens Over NFP! 

On the news front, the eyes will remain on the German Industrial Production m/m and ECB President Lagarde Speaks. Both of these may have an impact on the Euro related currency pairs.

Economic Events to Watch Today


EUR/USD – Daily Analysis

The EUR/USD pair was closed at 1.12911 after placing a high of 1.13835 and a low of 1.12781. Overall the movement of EUR/USD remained bearish throughout the day. The EUR/USD pair rose to 1.13835 near 13-weeks highest level but failed to remain there and broke its nine days bullish streak and fell on Friday amid U.S. dollar strength across the board after the release of US Non-Farm Employment Change.

The pair EUR/USD was on bullish track after the announcement of an additional 600 billion euros in the emergency package from the European Central Bank on Thursday. The package was announced to cover up the losses faced after the coronavirus induced lockdowns across the globe and its impact on the global economy.

The additional 600 billion euros by ECB in its pandemic emergency purchase program (PEPP) made the total size of aid provided after the coronavirus crisis to 1.35 trillion euros. ECB also said that the updated forecast about GDP showed a contraction of 8.7% this year, and the inflation expectations were to rise by 0.3% this year and 0.8% in next year. EUR/USD moved in an upward direction after the ECB’s PEPP announcement and continued to follow the trend in early sessions on Friday and rose above 13-weeks higher level.

However, after the release of US Non-Farm Employment Change, the pair EUR/USD started to move in the opposite direction at the ending day of the week. At 17:30 GMT, the Non-Farm Employment Change from the United States showed that 2.509M people were hired in May against 7.750M of job loss expectations. A stronger than expected job report from the U.S. gave strength to the U.S. dollar across the board and weighed on EUR/SD pair.

Adding in the strength on the U.S. dollar was the Unemployment Rate, which came in as 13.3% against the expectations of 19.4% and further dragged down the pair EUR/USD pair.

On the other hand, from the Europe side, at 11:00 GMT, the German Factory Orders for April were also released which showed that factory orders were reduced by 25.8% in April against the expected drop of 20% and weighed on Euro which ultimately dragged the pair in a downward trend.

Daily Support and Resistance

  • R3 1.1357
  • R2 1.1338
  • R1 1.1327

Pivot Point 1.1308

  • S1 1.1296
  • S2 1.1278
  • S3 1.1266

EUR/USD– Trading Tip

The EUR/USD is also following a bearish trend on the back of a stronger dollar. Currently, the pair is facing immediate support around 1.1284 level, and closing of candles below this level may lead the EUR/USD prices further lower towards 1.1244 level, the support, which is extended by the 50 EMA level. On the higher side, resistance holds at 1.1315 level today. Odds of bearish bias remains solid today.


GBP/USD – Daily Analysis

The GBP/USD was closed at 1.26689 after placing a high of 1.26901 and a low of 1.25828. Overall the movement of GBP/USD pair remained bullish throughout the day. The pound rose for 7th consecutive day on Friday amid the rising hopes for a deal between E.U. & U.K. but lost some of its daily gains after the release of U.S. on-Farm Employment Change.

Matt Hancock, the Cabinet Minister of the U.K., said that a trade deal with the E.U. was still possible on very reasonable demands. In the latest rounds, both sides admitted that a little progress was made, and they were very hopeful that no-deal outcomes to the talks could be avoided.

The U.K. & E.U. differences have remained under four key points of fisheries: competition rules, governance, and police cooperation. UK PM Boris Johnson and President of European Commission, Ursula von der Leyen, are expected to meet later this month.

The U.K. has only until the end of June to apply for the extension of the transition period, but Johnson has ruled it out. However, the hopes that U.K. & E.U. will reach a deal after the described little progress in talks from both sides increased, and hence, the pair GBP/USD found traction in the market.

Whereas, the investors think that chances for no-deal Brexit were more than ever because the coronavirus pandemic will lead to one of the worst recessions in modern history, and investors think that hardcore Brexiteers will use the recession as a perfect distraction to get to a no-deal Brexit done.

On the data front, at 12:30 GMT, the Halifax Housing Price Index for May from the United Kingdom was declined by 0.2% against the expected decline of 0.7% and supported British Pound which ultimately pushed the GBP/USD pair on bullish track on Friday and added in the pair gains.

Meanwhile, the U.S. dollar strength after the release of US Non-Farm Employment Change exerted pressure on the rising prices of GBP/USD pair on Friday and made it lose some of its daily gains.

Daily Support and Resistance

  • R3 1.28
  • R2 1.2765
  • R1 1.2742

Pivot Point 1.2707

  • S1 1.2684
  • S2 1.2649
  • S3 1.2627

GBP/USD– Trading Tip

On Monday, the technical side of the GBP/USD seems bullish as the pair continues to reach 1.2690 levels, having violated the triple top level on the 4-hour timeframe. The GBP/USD pair has formed an upward regression trend channel, and it’s driving further buying trend in the Cable. Bullish Continuation of a bullish trend can lead to GBP/USD prices towards the next resistance level of 1.2760 level. Above this, the next resistance holds around 1.2795 level. Conversely, the support is likely to be found around 1.2665 and 1.2601 level today. Let’s look for selling below 1.2707 and buying above this level today


USD/JPY – Daily Analysis

The USD/JPY was closed at 109.573 after placing a high of 109.848 and a low of 109.042. Overall the movement of USD/JPY remained bullish throughout the day. The USD/JPY pair surged for the fourth consecutive day on Friday and gained some strong follow-through traction after the release of surprisingly stronger than expected U.S. monthly jobs data. The headline data of Friday, NFP, showed that 2.509M jobs were added in May, whereas the forecast was about 8M job loss.

Adding in the optimism was the unemployment rate, which beat the market expectations and was reported as 13.7% against 19.4% of expectations. Better than expected, data from the U.S. economy raised the bars for recent optimism over the sharp V-shaped recovery for global economic recovery. This increased the already stronger risk appetite In the market and hence, the USD/JPY pair gained for the 4th consecutive day on Friday.

At 4:30 GMT, the Household Spending for the year from Japan was declined by 11.1% against the expected decline of 12.8% and supported the Japanese Yen. At 10:00 GMT, the Leading Indicators from Japan remained flat with the expectations of 76.2%.

From the American side, the Average Hourly Earnings in May was declined by 1.0%, whereas it was expected to rise by 1.0%. The US Non-Farm Employment Change showed that 2.509M people were hired back in May, which were expected to show job loss of 7.750M people. The Unemployment Rate in April fell short of 19.4% expectations and came in as 13.3% and supported the U.S. dollar.

Daily Support and Resistance    

  • R3 109.79
  • R2 109.74
  • R1 109.67

Pivot Point 109.62

  • S1 109.56
  • S2 109.5
  • S3 109.44

USD/JPY – Trading Tips

The USD/JPY is consolidating in a narrow trading range of 109.800 – 109.255. The stronger than expected NFP figures drove buying in the USD/JPY pair on Friday, but now the traders seem to capture retracement in the market. A bearish breakout of 109.280 level can drive selling until the next support level of 109, which marks 38.2% Fibonacci retracement. The 50 EMA and MACD both are supporting the buying trend in the USD/JPY pair, and it can lead the USD/JPY prices further higher today. On the higher side, the resistance holds around 109.850. Let’s wait for a breakout of 109.800 – 109.255 to determine further trends in the USD/JPY pair. All the best for today! 


Categories
Forex Market Analysis

Daily F.X. Analysis, June 01 – Top Trade Setups In Forex – ISM Manufacturing PMI In Highlights

On Monday, the fundamentals side is likely to drive no major movement during the European session. Still, the U.S. session may offer some price action on the release of ISM manufacturing PMI figures today.

Economic Events to Watch Today


EUR/USD – Daily Analysis

The EUR/USD pair was closed at 1.11032 after placing a high of 1.11450 and a low of 1.10676. Overall the movement of the EUR/USD pair remained bullish throughout the day. The EUR/USD continued its previous trend and finally crossed above 1.11 level on Friday and rose for the 5th consecutive day this week. The pair showed the longest run since late March at the end of this week on the back of Euro’s strength.

At 11:00 GMT, the German Import Prices for April were released as -1.8% against the -1.5% forecasted and weighed on Euro. The German Retail Sales dropped less than expected 12% as5.3% in April and supported single currency Euro. At 11:45 GMT, the French Consumer Spending for April was declined by 20.2% against the forecasted 14.5% and weighed on Euro. The French Prelim CPI for May dropped by0.05 from the expected drop of 0.1% and weighed on Euro.

However, the French Prelim GDP for the quarter dropped less than the expectations of 5.8% decline and came in as 5.3% and supported shared currency Euro. At 13:00GMT, the M3 Money Supply for the whole bloc surged to 8.3% from the forecasted 8.1% and supported Euro.

The Private Loans from the whole bloc for the year dropped to 3.0%from the forecasted 3.5%. At 14:00 GMT, the CPI Flash estimate for the year for the whole Eurozone came in line with the expectations of 0.1%.  

However, the Core CLPI Flash estimate of the whole bloc for the year increased to 0.9% from the expected 08% and supported Euro. The Italian CPI for May came in line with the expectations of -0.1%.

Better than expected GDP and CPI data from Eurozone gave strength to the Euro against the U.S. dollar and supported the upward trend of EUR/USD pair on Friday.

On the other hand, the United States’ economic data was gloomy and weighed on the U.S. dollar, which added in the upward movement of EUR/USD pair. At 17:30 GMT, the Core PCE Price Index for April was dropped more than the expected -0.3% as -0.4% and weighed on the U.S. dollar. Personal Spending also declined more than expectations of 12.6% decline as 13.6% in April and weighed on the U.S. dollar. The Goods Trade Balance for April showed a deficit of 69.7B against the forecasted deficit of 64.8B and weighed on the U.S. dollar. The Prelim Wholesale Inventories for April surged to 0.4% from the expected -0.5% and added in U.S. dollar weakness.

The Chicago PMI at 18:45 GMT came in as 32.3 points against 40.1 of expectations and weighed the U.S. dollar. The Revised Consumer Sentiment from the University of Michigan for May dropped to 72.3 from the expected 73.7 and weighed on the U.S. dollar. The Revised Inflation Expectations from the University of Michigan for May were reported as 3.2% from the previous 3.0%.


Daily Support and Resistance

  • R3 1.1158
  • R2 1.1141
  • R1 1.1129

Pivot Point 1.1113

  • S1 1.1101
  • S2 1.1085
  • S3 1.1073

EUR/USD– Trading Tip

The bullish bias of the EUR/USD continues to prevail in the market as the EUR/USD is heading north towards the next target level of 1.1150 level. A bullish breakout of 1.1150 level may lead the pair towards 1.1220 level today while support holds around 1.1080 level. Bullish bias seems dominant today. Consider taking buying trades over 1.1140 level to target 1.1199. 


GBP/USD – Daily Analysis

The GBP/USD pair was closed at 1.23459 after placing a high of1.23940 and a low of 1.22902. Overall the movement of GBP/USD pair remained bullish throughout the day. The pair GBP/USD reached above its two-week high level on Friday near 1.2400 level but could not stay there and dropped back to 1.2300 level. The drop in sterling was caused by the awaiting speech of U.S. President Donald Trump.

Sterling started its day on firm tone and extended its previous day’s gains on the back of broad-based U.S. dollar weakness due to poor than expected U.S. economic data release. The decline in U.S. Treasury bond yields also added to the fault of the U.S. dollar. The Chicago PMI for May dropped to 32.3 from the expected 40.1 and weighed on the U.S. dollar. The Revised Consumer Sentiment from the University of Michigan for May also dropped to 72.3 against the expected 73.7 and added negative pressure on USD.

Other than economic data, the comments from Fed Chair Jerome Powell also exerted pressure on the U.S. dollar. Powell said that the U.S. economy had crossed many red lines that had never crossed before. He also stated that the Fed was launching Main Street Lending Program, which had not used since the Great Depression. After these comments, the GBP/USD pair started to move upward.

Investors became cautious before U.S. President Donald Trump’s speech on Friday and started selling Sterling, who made the pair lose its early daily gains. However, after his speech, the pair continued its bullish trend and ended its day with a bullish candle. The heat between China and the United States was enhanced after the strong response from U.S. President Donald Trump over the new security bill in Hong Kong by China, which was highly awaited as Trump had announced it before earlier this week.

Daily Support and Resistance

  • R3 1.2388
  • R2 1.2371
  • R1 1.2358

Pivot Point 1.2341

  • S1 1.2328
  • S2 1.2311
  • S3 1.2298

GBP/USD– Trading Tip

The GBP/USD continues trading bullish as it has violated the double top resistance area around 1.2364 level. Bullish crossover of this level is now likely to extend the buying trend until 1.2458, but on the way, the upward channel’s upward trendline is likely to provide resistance around 1.2410, while the support level stays at 1.2370 today. 

On the 4-hour timeframe, the 50 EMA is suggesting bullish bias, and now the MACD is suggesting buying trend in the GBP/USD pair as the histograms are forming above zero levels. Consider taking buying trades over 1.2370 and selling below the same level today.


USD/JPY – Daily Analysis

The USD/JPY was closed at 107.767 after placing a high of 107.894 and a low of 107.077. Overall the movement of USD/JPY remained bullish throughout the day. At 4:30 GMT, the Tokyo Core CPI for the year came in as 0.2% against -0.2% and supported the Japanese Yen. The Unemployment Rate from Japan also decreased in April to2.6% from the expectations of 2.7% and supported Yen.

However, the Prelim Industrial Production for April dropped by 9.1% against the expected drop of 5.5% and weighed on Yen at 4:50 GMT. The Retail Sales for the year from Japan also dropped by 13.7% against the expected drop of 11.2% and weighed on Yen. At 10:00 GMT, the Housing Starts for the year dropped by 12.9% against the drop of 12% expected and weighed on Yen. At 10:02 GMT, the Consumer Confidence for April increased to 24.0 from the expected 213 and supported Yen.

The increased confidence in Japan’s economy and better than expected CPI and Unemployment Rate supported Yen and made it stronger against the U.S. dollar, which dragged the USD/JPY currency pair in earlier Asian trading session on Friday.

 The pair dropped to its two weeks lowest level on Friday at 107.077 on the back of increased demand for safe-haven Yen amid escalating tensions between the U.S. and China. On Friday, the President of the United States, Donald Trump announced to revoke its relationship with WHO due to its mishandling of coronavirus pandemic. The U.S. had warned the WHO to be independent of China, change its reforms, and give it 30 days to do so. However, when on Friday, 30 days ended, and no response came back from WHO, the U.S. declared to end its relationship with it.

Trump said that the U.S.’s funds to transfer to WHO will be given to more deserving other nations where urgent help will be required. The decision came in after China issued and passed a new security bill on Hong Kong, and the U.S. said that it would retaliate.

Categories
Forex Market Analysis

Daily F.X. Analysis, May 29 – Top Trade Setups In Forex – Fed Chair Powell Speech in Focus! 

The European Commission will post May CPI (+0.1% on-year expected). The European Central Bank will publish the eurozone’s M3 money supply in April (+8.2% on-year expected). The German Federal Statistical Office will report April retail sales (-12.0% on month expected). France’s INSEE will release final readings of 1Q GDP (-5.4% on year expected) and May CPI (+0.3% on-year expected). The U.S. Commerce Department will post April wholesale inventories (-0.7% on month expected), advance goods trade balance (65 billion dollars deficit expected), personal spending (-12.8% on month expected), and personal income (-6.0% on month expected). The Market News International will release May Chicago PMI (40.0 expected). The University of Michigan will report its final data of the May Consumer Sentiment Index (74.0 expected).

Economic Events to Watch Today


EUR/USD – Daily Analysis

The EUR/USD pair was closed at 1.10771 after placing a high of 1.10934 and a low of 1.09915. Overall the movement of the EUR/USD pair remained bullish throughout the day.

The EUR/USD pair continued its bullish streak for the 4th consecutive day on Thursday and rose near 1.1100level, highest since March 30. On Wednesday, the European Commission proposed an additional $18.2Billion for the European Union’s foreign spending as part of its COVID-19 recovery package. The proposed package gave relief to NGOs that had feared further rate cuts.

This proposal by the European Commission must be approved by E.U. states and would allocate 86 billion euros to the bloc’s development for 2021-2027. The additional resources would be drawn from the 750 billion euro recovery fund, which was also announced on Wednesday, which will be raised by borrowing on financial markets.

On the data front, the German Preliminary Consumer Price Index for May declined by -0.1% against the expected 0.1% and weighed on single currency Euro. While at 12:00 GMT, the Spanish Flash Consumer Price Index for the year came in line with the expectations of -1.0%.

The European Commission indicated that the Consumer Confidence Index in Eurozone edged higher to -18.8 from -22. Still, the Business Climate Index fell to -2.43 from -1.99 and stopped the shared currency from gathering strength against its rivals.

However, the risk-on market sentiment of the market continued to support the EUR/USD pair and weighing on the U.S. dollar. The potential coronavirus vaccines, reopening of economies across the globe, and potential risk for the second wave of corona kept the risk appetite in the market and continued weighing on the U.S. dollar. The weakness of the U.S. dollar gave a push to EUR/USD pair.

On American economic docket, the poor than expected data also kept the U.S. dollar under pressure on Thursday. The jobless claims from the United States for last week rose to 2.123M from the expected 2.1M and weighed on the U.S. dollar. At 19:00 GMT, the Pending Home Sales for April dropped more than expectations and weighed on the U.S. dollar. The actual figure came in as -21.8% against the expected -15%. The closely watched Prelim GDP for the quarter from the United States also weighed on the U.S. dollar when it was released as -5.0% against the expected -4.8%. The EUR/USD pair rose to its 12 weeks highest level on the back of broad-based U.S. dollar weakness on Thursday.

Daily Support and Resistance

  • R3 1.122
  • R2 1.1157
  • R1 1.1117

Pivot Point 1.1054

  • S1 1.1014
  • S2 1.0951
  • S3 1.0911

EUR/USD– Trading Tip

The bullish bias of the EUR/USD continues to prevail in the market as the EUR/USD is heading north towards the next target level of 1.1150 level. The pair have already violated the triple top resistance level of 1.09985, and bullish crossover of 1.1146 level may lead the EUR/USD prices further higher towards 1.12118 level. The closing of three white soldiers in the daily timeframe is also supporting an upward trend in the market.


GBP/USD – Daily Analysis

The GBP/USD pair was closed at 1.23222 after placing a high of 1.23443 and a low of 1.22336. Overall the movement of GBP/USD pair remained bullish throughout the day.

According to the policymaker of Bank of England, Michael Saunders, easing too much rather than easing a little by Bank of England was easier in response to the coronavirus pandemic. He said that the U.K. was at risk of relatively slow recovery than other countries from the coronavirus crisis, and it could prove damaging to the U.K.’s economy.

On Thursday, Saunders added that if Bank of England failed to add more stimulus measures in the economy, than it could slip the economy into an “inflation trap.” Saunders was one of two policymakers of BoE that wanted an expansion inn asset purchases in May. While the other majority wanted to wait, though accepted, more stimulus would be required.

The first speech of Saunders after COVID-19 was encouraging the central bank to cut interest rates to a record low of 0.1%, increase the bond-buying, and boost the capital. However, in response to his speech, British Pound came under pressure on Thursday and fell by 0.2%. On the other hand, the U.S. dollar also remained weak during the day because of risk-on market sentiment along with the poor economic data. The broad-based U.S. dollar weakness overshadowed the drop in GBP and raised the GBP/USD pair.

The closely watched Prelim GDP for the second quarter from the United States was dropped by -5.90% against the expected drop by -4.8% and weighed on the U.S. dollar. At 17:30 GMT, the Unemployment Claims from last weeks also reported higher than expectations of 2100K as 2123K and weighed on the U.S. dollar. At 19:00 GMT, the Pending Home Sales for April also declined by 21.8% against the expected decline by 15%.

Despite reopening all 50 states from coronavirus induced lockdowns, unemployment claims still showed higher than expected figures, which resulted in the broad-based U.S. dollar weakness on Thursday.

On Brexit front, the final round of talks between the U.K. & E.U. before a summit in June will be held next week. Because of the last negotiations that went bad after the exchange of letters between the British negotiator, David Frost, and his E.U. counterpart, Michel Barnier, the hopes for the success of final round talks have decreased. This has raised the bars for no-deal Brexit possibility.

U.K. Prime Minister, Boris Johnson will travel to Brussels for talks with European leaders next month to attempt to revive the negotiations. The two sides were still far apart on fisheries, and the U.K. has said that it would abandon the talks if “shape of a deal” has not emerged by the end of June. The U.K. traders will keep an eye onus data and Brexit updates for further actions.

Daily Support and Resistance

  • R3 1.259
  • R2 1.2477
  • R1 1.2405

Pivot Point 1.2292

  • S1 1.222
  • S2 1.2107
  • S3 1.2035

GBP/USD– Trading Tip

On Friday, the GBP/USD is trading with a slightly bullish bias, facing a double top resistance area around 1.2364 level. Bullish crossover of this level may extend the buying trend until 1.2458. On the 4-hour timeframe, the 50 EMA is suggesting bullish bias, and now the MACD is suggesting buying trend in the GBP/USD pair as the histograms are forming above zero levels. 

Today, the Sterling may find immediate support around 1.2245 levels along with resistance at 1.2360 while the closing of candles above the 1.2360 level may drive buying until 1.2450 level. The violation of support is likely to push the cable further lower until 1.2160 level. Consider taking buying trades over 1.2162 and selling below the same level today.


USD/JPY – Daily Analysis

The USD/JPY currency pair extended its previous 2-days winning streak. They rose to 107.90 marks mainly due to the risk-on market sentiment, which undermined the Japanese yen’s safe-haven demand and exerted some bullish impact on the currency pair. On the other hand, the broad-based U.S. dollar weakness turned out to be one of the main factors that kept a lid on any additional gains in the pair. At this particular time, the USD/JPY currency pair is currently trading at 107.83 and consolidating in the range between 107.69 and 107.91.

However, the reason for the upbeat market sentiment could be attributed to the recent optimism about a possible COVID-19 vaccine and hopes of a global economic recovery, which eventually sent the currency pair higher.

Despite the bullish trend in the currency pair, the USD/JPY pair held well within a near two-week-old trading range. The reason behind the confined trading range could be the escalating tensions between the U.S. and China relations, which kept investors cautious about placing any strong position.

The intensifying tension between the United States and China was further bolstered by the U.S. Secretary of State Mike Pompeo’s statement in which he denied Hong Kong’s special status and said that it was no longer autonomous from China. 

At the USD front, the broad-based U.S. dollar erased its previous day gains and slipped 0.16% to 98.900 on the day due to the rise in Asian shares and U.S. stock futures, which eventually limited the additional gains in the pair. Whereas, The U.S. Dollar Index that tracks the greenback against a basket of other currencies dropped 0.16% to 98.900 by 11:26 AM ET (4:26 GMT). 

Daily Support and Resistance    

  • R3 108.39
  • R2 108.16
  • R1 107.86

Pivot Point 107.63

  • S1 107.33
  • S2 107.1
  • S3 106.79

USD/JPY – Trading Tips

The safe-haven Japanese yen continues to gain bullish momentum in the wake of increased safe-haven appeal for JPY, and it’s dragging the USD/JPY pair lower at 107.120. The odds of selling in pair remains strong as the pair is likely to drop towards the next support level of 106.850. The recent strong selling candle also suggests odds of further selling in the USD/JPY pair today. 

All the best for today! 

Categories
Forex Signals

GBPJPY Bearish Engulfing after double top at the upper edge of the descending channel

GBPJPY has been moving in a descending channel since April 10. The action created a lot of volatility, driving prices back and forth from top to bottom of the channel. The last iteration drove its price to surpass the upper limit, a +2 sigma event, which means the pair was overpriced if we compare it with what we may call the fair price, which is the linear regression channel, the red mid-line.

After the double top, a large bearish engulfing candle was drawn, confirming the reversal signal; thus, we can set up a short trade with entry at the current level, an invalidation point beyond the last top and a target at the projected linear regression point. The Reward/risk ratio of 2 is a conservative value that will ensure our long-term profitability.

Key levels:

Short-Entry:132.175

Take.profit:130.575

Stop-Loss: 132.965

Reward Ratio: 2.03

Risk:735 USD per lot, 73.5 USD per mini-lot.

Reward: 1,491USD per lot, 149 USD per mini-lot.

Position sizing: 2% Risk equals 3 micro-lots for every $1,000 balance in the trading account.

Categories
Forex Market Analysis

Daily F.X. Analysis, May 27 – Top Trade Setups In Forex – ECB President Lagarde Speaks! 

The U.S. dollar, which behaves like a safe-haven asset during political uncertainty & market turmoil, rose to a one-week high against the basket of 6 currencies, but it started to erase its daily gains in late London Session. Tensions between U.S. &China have increased since the coronavirus outbreak, over which both countries have exchanged accusations of cover-ups and lack of transparency with the world. The signs for easing tensions between the two biggest economies of the world are decreasing day by day and have created an uncertain environment in the market weighing on the market.

Economic Events to Watch Today


EUR/USD – Daily Analysis

The EUR/USD pair was closed at 1.09821 after placing a high of 1.09956 and a low of 1.08913. Overall the movement of EUR/USD remained bullish throughout the day. On Tuesday, EUR/USD prices surged and recovered its previous three days’ losses and regained strength in the market on the back of the renewed risk-on market sentiment. The risk appetite after easing of lockdown throughout the world gave strength to the riskier assets like EUR/USD pair and rose them across the board.

The rising hopes for potential coronavirus vaccine added in the risk sentiment and increased expectations for a quick economic recovery. A bid pharmaceutical company, which was the first to make the Ebola vaccine revealed its plans on Tuesday and said that it was working on two potential vaccines and one drug to cure the virus’s infection. The CEO of the company was cautious that it might take a long time to deliver vaccines across the globe.

This raised optimism around the market and raised the bars for riskier assets and moved EUR/USD pairs to recover its previous day’s losses.

On the other hand, in the economic docket, EUR found extra support after the German Consumer Climate from Gfk came in as -18.9 against the expectations of -19.1.

Furthermore, the European Central Bank said that the coronavirus pandemic had amplified the existing vulnerabilities of the financial sector, which will make Eurozone banks face significant losses.

ECB reported that the pandemic had caused one of the sharpest economic contraction in recent history. Still, a wide range of policy measures has been proved helpful in averting a financial meltdown.

Daily Support and Resistance

  • R3 1.1126
  • R2 1.1061
  • R1 1.1021

Pivot Point 1.0956

  • S1 1.0915
  • S2 1.0851
  • S3 1.081

EUR/USD– Trading Tip

On the 4 hour timeframe, the EUR/USD pair is testing triple top level, which is providing resistance around 1.0995 level. Closing of candles below this level may drive selling trades until 38.2% Fibonacci retracement level of 1.0970, and below this, the next support holds around 1.0920, which marks 61.8% Fibonacci area. Overall, 1.0995 is a crucial trading level as above this; the EUR/USD pair may lead it’s prices further higher towards 1.1137. Bullish bias seems dominant today.

GBP/USD – Daily Analysis

The GBP/USD pair was closed at 1.23373 after placing a high of 1.23630 and a low of 1.21807. Overall the movement of GBP/USD pair remained bullish throughout the day. The Pound outperformed on Tuesday and rose to a level 1.236 highest since May 12 on the back of raised optimism about the EU-UK trade deal.

The next round of Brexit talks are due next week, and there have been headlines revolving that British negotiators could seal their first victory in next talks with the E.U. Reports suggested that the European Union was willing to shift its stance on fisheries in the next round of talks with Great Britain next week. If that happens, it would be a significant concession from the bloc in talks with the U.K. on their new relationship after Brexit.

The fisheries were important to the E.U. as most of the fishing takes place in U.K. waters, but the catch goes to E.U. fishers. U.K. wanted to ensure that after Brexit, which will take effect from next year, the U.K. as a newly independent coastal state could be solely in control of its waters and fish.

So far, the European Union has been reluctant to give up U.K. waters and demanded the things to remain the same as they were before in fisheries. However, on Tuesday, an E.U. official said that the bloc’s executive committee, which will negotiate with the U.K. in the name of all 27 E.U. member states, could ease its demand if the U.K. were to move as well.

According to Michel Barnier, surrendering the access to Britain’s fishing waters would be just one of the costs the British government must pay for a trade deal with the bloc. However, he faced pressure from other officials not to surrender to Britain too soon.

Daily Support and Resistance

  • R3 1.259
  • R2 1.2477
  • R1 1.2405

Pivot Point 1.2292

  • S1 1.222
  • S2 1.2107
  • S3 1.2035

GBP/USD– Trading Tip

The GBP/USD prices traded sharply bullish soaring from 1.2200 level to place a high around 1.2360 level. The resistance level of 1.2360 is extended by an upward channel, which can be seen on the 4-hour timeframe. The 50 EMA is bullish, but the MACD is suggesting odds of selling bias in the GBP/USD pair, perhaps because the Sterling is in the overbought zone. Bullish crossover of 1.2360 level may lead Sterling prices further higher towards 1.2460, while support is likely to be found around 1.2289 and 1.2165. Consider taking buying trades over 1.2292 and selling below the same level today.


USD/JPY – Daily Analysis

The USD/JPY pair was closed at 107.539 after placing a high of 107.921 and a low of 107.399. Overall the movement of the USD/JPY pair remained bearish throughout the day. The USD/JPY pair showed a bearish trend on Tuesday but consolidated in a range between 107.3 and 107.9.

At 18:00 GMT, the Housing Price Index for March from the United States was dropped to 0.1% against the forecasted 0.6% and weighed on the U.S. dollar. The S&P/CS Composite-20 HPI for the year advanced to 3.9% against the expectations of 3.4% and supported the U.S. dollar. At19:00 GMT, the Consumer Confidence from Conference Board for May decreased to 86.6 from the forecasted 87.1 and weighed on the U.S. dollar. The New Home Sales for April were recorded as 623K against the expected 429K and supported the U.S. dollar.

The closely watched Consumer Confidence from the United States declined and made the U.S. dollar weak across the board and ultimately dragged the USD/JPY pair on Tuesday. From the Japanese side, at 4:50 GMT, the Services Producer Price Index (SPPI) for the year was dropped to 1.0% against the forecasted 1.3%and weighed on Japanese Yen. At 9:30 GMT, All Industrial activities for March came in line with the expectations of -3.8%. At 10:00 GMT, the Core CPI for the year from Bank of Japan also dropped to -0.1% from the expected 0.0% and weighed on Japanese Yen.

The Governor of Bank of Japan, Haruhiko Kuroda, said that the central bank was ready to ease monetary policy further. To add more stimulus measures, the bank decided to expand its loan programs, cut the rates further, and ramp up the risky asset purchases. In his semiannual testimony to parliament, Kuroda said that Bank of Japan was ready to do whatever it can to ensure markets were stable. He added that the stability of markets was its first importance now because once the pandemic was over, Japan’s economy could resume a solid recovery path.

Daily Support and Resistance    

  • R3 108.39
  • R2 108.16
  • R1 107.86

Pivot Point 107.63

  • S1 107.33
  • S2 107.1
  • S3 106.79

USD/JPY – Trading Tips

The USD/JPY pair continues to trade choppy sessions within the same trading 107.950 – 107.350. Above 107.950 level, we may see USD/JPY prices heading towards the next resistance level of 108.330. The 50 EMA is currently supporting the USD/JPY around 107.350. Breakout of USD/JPY support area of 107.35 can lead the USD/JPY prices towards 106.850. So let’s consider taking buying trades over 107.63 and selling below the same level today. 

All the best for today! 

Categories
Forex Market Analysis

Daily F.X. Analysis, May 22 – Top Trade Setups In Forex – ECB Monetary Policy Meeting Accounts Ahead! 

The U.S. Dollar Index (DXY) fell about 0.25% on the day to post the lowest close since May. Powell said that Fed might need to introduce more stimulus measures if the economic lockdown remains there for a long time. He also added that banks should prepare themselves for the bankruptcies of nonfinancial companies. Let’s keep an eye on U.K. Retail sales and ECB Monetary Policy Meeting Minutes.

Economic Events to Watch Today


EUR/USD – Daily Analysis

The EUR/USD prices were closed at 1.09777 after placing a high of 1.09988 and a low of 1.09185. Overall the movement of EUR/USD remained bullish throughout the day. The EUR/USD pair remained near 1.1000 after the release of FOMC meeting minutes. The surge in the EUR/USD pair suggested that the pair might break its 7-week range and move further to earn more gains.

The FOMC minutes failed to impress the market as there was no surprise element in Powell’s presentation and was ignored by market participants. It was widely expected that the coronavirus outbreak would continue to weigh on the economy, and the economic outlook would remain somewhat pessimistic. Greenback holds onto its losses as there was no room for surprises in the minutes of the meeting. 

The U.S. Dollar Index (DXY) fell about 0.25% on the day to post the lowest close since May. Powell said that Fed might need to introduce more stimulus measures if the economic lockdown remains there for a long time. He also added that banks should prepare themselves for the bankruptcies of nonfinancial companies.

On the data front, at 13:00 GMT, the Current Account Balance from the Eurozone showed a balance of 27.4B during March against 37.8B of February. At 14:00 GMT, the Final CPI from Eurozone for the year declined to 0.3% against the expectations of 0.4% and weighed on EUR. The Final Core CPI for the year came in line with the hopes of 0.9%. 

At 19:00 GMT, the Consumer Confidence on the Eurozone economic condition showed a decline to 19 forms the forecasted decline of 23 and supported EUR. The market participants ignored the poor than expected CPI from Eurozone, and EUR got its support after the release of consumer confidence, which showed less decline than expected.

Furthermore, the latest Franco-German proposal for a 500 euros fund to fight coronavirus crisis helped EUR pair to gain traction in the market and remain stronger than other currencies; this ultimately supported the upward trend of EUR/USD pair.

Daily Support and Resistance

  • R3 1.1067
  • R2 1.1038
  • R1 1.0994

Pivot Point 1.0965

  • S1 1.092
  • S2 1.0892
  • S3 1.0847

EUR/USD– Trading Tip

On Friday, the EUR/USD prices are holding at 1.0940 as these were facing strong resistance around 1.0993, which marks the triple top resistance level and can trigger selling in the pair. Conversely, the EUR/USD pair may find support around 1.0883, once the 1.0993 level gets violated. The MACD is recently forming selling candles, which suggests the trend of the sale in the pair. So the overall trading range can be from 1.0994 level to 1.0886. On Friday, we can look for selling trades under 1.0965 for 40/50 pips profit. 


GBP/USD – Daily Analysis

The GBP/USD pair was closed at 1.22225 after placing a high of 1.22495 and a low of 1.21855. Overall the movement of GBP/USD pair remained bearish throughout the day. The GBP/USD pair continued to follow its previous day’s trend of downward movement and dropped on Thursday as well. The decline in currency pair could be attributed to the increasing speculations that the Bank of England will consider to ease monetary policy further. The Governor of Bank of England, Andrew Bailey, said that he had changed his position into negative interest rates given the crisis.

He added that more easing measures from the Bank of England were more likely, but the interest rates were below on his priorities. He said that though it was not the time for negative interest rates, they could not be excluded from options.

Furthermore, on the lack of progress on trade talks with the European Union, the U.K. was driving its way towards no-deal Brexit. This raised fear amongst investors and raised uncertainty about the future relationship of Great Britain with E.U., making GBP weaker on the board. In the current context of coronavirus shutdown, the U.K. economy was already disturbed, and chances for an unfriendly exit from E.U. along with coronavirus would impact highly negative on the common currency. 

On the data front, at 13:30 GMT, the Flash Manufacturing PMI from Great Britain showed a surge in Index with 40.6 points against the 35.1 of forecast and supported GBP. Sterling was also supported by Flash Services PMI, which exceeded the expectations of 24.1 and came in as 27.8. From the U.S. side, the increased Jobless Claims last week by 2.43M weighed on the U.S. dollar. However, the Flash Manufacturing PMI, which was key data on Thursday from the American side, came in support of the U.S. dollar when released as 39.8 against the expectations of 39.3.

The strong U.S. dollar on Thursday amid better than expected PMI data added in the downfall of GBP/USD pair.

Daily Support and Resistance

  • R3 1.232
  • R2 1.2285
  • R1 1.2255

Pivot Point 1.222

  • S1 1.219
  • S2 1.2155
  • S3 1.2124

GBP/USD– Trading Tip

The GBP/USD continues to trade within the same technical levels, which we discussed a day before. The Cable is facing resistance around 1.2269 level, and it continues to develop doji and bearish engulfing candles below 1.2269 zones, which has driven a bearish retracement in the Cable. On the lower side, the Sterling may find support against the U.S. dollar around 1.2170 level. The MACD and 50 EMA are supporting selling bias in the pair. Today, the release of U.K. Retail Sales m/m may help drive further movement in the market. Therefore, the bullish breakout of 1.2270 level can lead the Sterling prices towards 1.2360. While breakout of the support level of 1.2169 may lead the Sterling pair towards the 1.2080 support zone. 


USD/JPY – Daily Analysis

The USD/JPY pair was closed at 107.604 after placing a high of 107.847 and a low of 107.415. Overall the movement of the USD/JPY pair remained bullish throughout the day. At 4:50 GMT, Japan’s Merchandise Trade Balance for April showed a deficit of 1.0 Trillion Japanese Yen on Thursday. At 5:30 GMT, the Flash Manufacturing PMI came in as 38.4 during May compared to 41.9 of April.

The exports from Japan showed a decline of 21.9% and imports by 7.2%, while overall trade balance showed a deficit and weighed on Japanese Yen. The weak JPY gave strength to the USD/JPY pair on Thursday.

On the American side, the U.S. jobless Claims for the past week exceeded over 2.43M from the expectations of 2.4M and weighed on the U.S. dollar at 17:30 GMT. The Philly Fed Manufacturing Index for May declined by 43.1 against 40.0 expected and weighed on the U.S. dollar.

However, at 18:45 GMT, the Flash manufacturing PMI from the U.S. for the month of May surged to 39.8 against the expected 39.3 and supported the U.S. dollar. The Flash Services PMI for May also exceeded to 36.9 from 32.6 of expectations. 

The C.B. Leading Index for April was expected to be declined by 5.5%, but in actual, it showed a decline of 4.4% and supported the U.S. dollar. The Existing Home Sales remain flat with expectations of 4.33M.

Better than expected economic data from the United States gave strength to the U.S. dollar and moved USD/JPY pair in an upward direction to post daily gains. On the other hand, Fed Chairman Jerome Powell showed concerns about the economic indicators to hit their bleakest levels since the Great Depression. He said that the U.S. economy was facing a whole new level of uncertainty amid the coronavirus crisis. 

Daily Support and Resistance    

  • R3 108.21
  • R2 108.04
  • R1 107.83

Pivot Point 107.65

  • S1 107.44
  • S2 107.26
  • S3 107.05

USD/JPY – Trading Tips

On Friday, the USD/JPY continues trading sideways in between 107.630 – 107.350. Above 107.650 level, we may see USD/JPY prices heading towards the next resistance level of 108.130. The ascending triangle pattern was already violated, and the upward trendline is expected to keep the USD/JPY supported around 107.350. Breakout of USD/JPY support area of 107.35 can lead the USD/JPY prices towards 106.850. So let’s consider taking buying trades over 107.350 today. 

All the best for today! 

Categories
Forex Market Analysis

Daily F.X. Analysis, May 15 – Top Trade Setups In Forex – U.S. Retail Sales in Highlights!

On the news front, the economic calendar remains busy on Friday. Today’s releases may trigger some price action in the Euro and U.S. related pairs, especially on the release of German GDP, Eurozone Flash GDP, and U.S. core retail sales figures, which are due to come out during European and U.S. session respectively.

Economic Events to Watch Today 


EUR/USD – Daily Analysis

During the early Asain trading session, the EUR/USD currency pair flashing green, but remains trading in the confined range around above the 1.0800 level ahead of Germany’s preliminary gross domestic product (GDP) for the first quarter. The broad-based U.S. dollar modest weakness helping the currency pair to stay positive and kept a lid on any additional losses, at least for now. For example, the currency pair is looking directionless as the S&P 500 is sidelined, and the Asian stocks are adding in a mixed performance. 

The EUR/USD is trading at 1.0806 and consolidates in the range between the 1.0798 – 1.0809. However, the traders are keenly awaiting Germany’s preliminary gross domestic product ahead of a strong position.

At the data front, Germany’s preliminary gross domestic product (GDP) for the first quarter, which is scheduled to publish at 06:00 GMT, is anticipated to show the old continent’s biggest economy declined by 2.2%, having increased by 0.4% in the final 3-months of 2019. It should be noted that the GDP prints of -2.2% or lower would be considered the worst reading since the ist-quarter of 2009. 

Germany had declared a secure national lockdown on March 22, which meant the economic activity came to a stop only in the last 8 or 9 of the 1st-quarter. In contrast, Germany is dependent on the dragon nation, which had already faced a sharp recession in the activity in the first two months of the year, mainly due to the coronavirus pandemic.

Therefore, there are many chances that Germany reporting a bigger-than-expected recession in the first quarter will not be rejected. As we already mentioned, the economists are expecting a 2.2% decrease, as per Germany’s DIW economic institute, the economy expected declined by 2% in the first quarter. Alternatively, the DIW expects a 10% decline in the GDP in the second quarter. 

Moving on, the EUR/USD currency pair may not pay any significant attention if the GDP prints in line with estimates as the market already priced in the worst condition of significant economies during the March and more so in April caused by coronavirus outbreak.

The currency pair could be able to take bids only if prints would be a surprise beat on expectations, but the gains would be temporary or short-lived if the risk sentiment turns heavy. Looking forward, market participants now look forward to Germany’s preliminary gross domestic product (GDP) for the first quarter, which is scheduled to publish at 06:00 GMT. The trade/virus updates could also entertain market traders.

Daily Support and Resistance

  • S1 1.0673
  • S2 1.0758
  • S3 1.079
  • Pivot Point 1.0843
  • R1 1.0874
  • R2 1.0928
  • R3 1.1013

EUR/USD– Trading Tip

On Friday, the EUR/USD is trading at 1.0807, bouncing off over the double bottom support level of 1.07756. On the 4 hour chart, the EUR/USD is closing bullish candles above upward channel trendline, but at the same time, the 50 EMA and horizontal resistance seem to drive bearish sentiment for the EUR/USD pair. Extension of selling below 1.0843 level may lead the EUR/USD prices towards 1.07782 level, and below this, the next support is likely to be found around 1.0730. Consider staying bullish above and bearish below 1.0770 level today. 


GBP/USD – Daily Analysis

The GBP/USD currency pair failed to stop its 5-day losing streak and dropped below the 1.2210 level while representing 0.15% losses on the day mainly due to the Brexit worries and coronavirus crisis. The broad-based U.S. dollar over-all bullish sentiment also weighed on the currency pair and kept the pair down. The GBP/USD is trading at 1.2208 and consolidates in the range between the 1.2203 – 1.2237. However, the traders are cautious about placing any strong position as they are keenly awaiting today’s U.S. consumer-centric data.

At the Brexit front, the European Union (E.U.) and the United Kingdom moderators are still pushing to cancel Brexit talk, which decided to happen through video conferences. At the same time, the European Commission’s (E.C.) took legal action against the U.K., which made talks tougher to happen. The European Commission initiated legal proceedings against the U.K. on Thursday, while accusing the U.K. about failing to comply with E.U. law on free movement which eventually keeps the cable currency under pressure and contributes to the pair’s declines.

On the flip side, the UK PM Boris Johnson keeps its preference high toward border checks at the Northern Ireland (N.I.) while the N.I. Secretary Brandon Lewis has repeatedly said there shall not be a border down the Irish Sea.

At the coronavirus front, the infected cases by coronavirus reached around 233 thousand overall in England, including 25 thousand in London,

as per the latest research by the Public Health England (PHE) and Cambridge University. In the meantime, the United Kingdom is talking with Swiss drugmaker Roche Holding AG about to buy an accurate COVID-19 antibody test after getting preliminary approval by the European Union and the United States.

Apart from this, the Bank Of England governor Andrew Bailey showed a willingness to take further action but denied rate cuts. The reason for the pairs bearish moves could also be attributed to the statement of the British central bank’s citizen panel in which they expect COVID-19 to have a large and enduring influence on the economy and society more broadly.

At the USD front, the broad-based U.S. dollar bolsters by the receding expectations of negative Fed rate and the increased probabilities of further stimulus from the government. While the Dollar Index (DXY), a gauge of the greenback versus significant currencies, remains mildly bid around 100.30 by the press time.

Daily Support and Resistance

  • R3 1.2577
  • R2 1.2508
  • R1 1.2422

Pivot Point 1.2353

  • S1 1.2268
  • S2 1.2198
  • S3 1.2113

GBP/USD– Trading Tip

On the last trading day of the week, the GBP/USD is trading sideways at 1.2200 after breaking below the narrow trading range of 1.2320 – 1.2245. The Cable has formed a new range of 1.2245 – 1.2186, however it’s still holding below 50 EMA, which is extending resistance around 1.2260 level today. On the 4 hour chart, the GBP/USD is gaining support at 1.2180 level while the 50 EMA and horizontal resistance stay at a level of 1.2245. 

The violation of the sideways trading range of 1.2245 – 1.2180, and the release of U.S. retail sales may help drive breakout in the GBP/USD pair. 

The GBP/USD pair may lead its prices towards an immediate support level of 1.2190 and 1.2150 in case of positive date; elsewhere, the GBP/USD pair may soar towards 1.2240 and 1.2310. 


USD/JPY – Daily Analysis

The USD/JPY pair was closed at 107.224 after placing a high of 107.363 and a low of 106.773. Overall the movement of the USD/JPY pair remained bullish throughout the day. After dropping below 107 level on Thursday, the USD/JPY pair regained its strength and posted gains for the day on the back of the improved market sentiment. The increased claims for jobless benefits from the United States during the last week failed to weigh on the U.S. dollar. A total of 2.9M Americans applied for unemployment benefits in the previous week against the expected 2.5M.

At 17:30 GMT, the Unemployment Claims for last week exceeded the expectations of 2500K and came in as 2981K and weighed on the U.S. dollar. The Import Prices for April were declined by 2.6% against the forecasted decline by 3.1% and supported the U.S. dollar.

The U.S. Dollar Index ignored the job data from the United States and moved above 100.40 level on Thursday, which helped USD/JPY pair to stretch its gains. Another factor adding in the upward trend of the USD/JPY pair was the comments from Donald Trump in support of the dollar. He said that a strong dollar was a great thing that could help in fast economic recovery after the coronavirus, this triggered the U.S. dollar buying wave and extended USD/JPY pair’s gains.

From the Japan side, at 4:50 GMT, The M2 Money Stock for the year from Japan was recorded as 3.7% against the forecast of 3.4% and supported Japanese Yen. At 10:59 GMT, the Prelim Machine Tool Orders for the year showed a decline of -48.3% in comparison to the previous -40.7%. 

Daily Support and Resistance    

  • R3 109.37
  • R2 108.57
  • R1 108.12

Pivot Point 107.33

  • S1 106.88
  • S2 106.09
  • S3 105.64

USD/JPY – Trading Tips

The safe-haven Japanese yen continues to trade in line with our previous forecasts. On Friday, the USD/JPY traded bearishly to trade below the support level of 107, which marked the 50% Fibonacci retracement level. The USD/JPY is holding at 107.05, where the 50 EMA is supporting the pair, and it may drop further below the 107 level. At the moment, the 4-hour candle appears to close below 107 support become resistant, and this may drive more selling in the USD/JPY pair. The pair may extend selling until 106.600 level, whereas the closing of buying candles above 107 can trigger bullish bias until 107.50. By the way, bearish bias seems solid today. All the best for today! 

Categories
Forex Market Analysis

Daily F.X. Analysis, April 22 – Top Trade Setups In Forex -U.K. Inflation Stabilises! 

On the forex front, the U.S. dollar gained traction against other major currencies, with the Dollar Index climbing 0.3% on the day to 100.20. The U.S. official data showed that Existing Homes Sales fell to an annualized rate of 5.27 million units in March (5.25 million units expected).

The British Consumer Prices Index (CPI), including owner-occupiers’ housing inflation rate, came out at 1.5% in March 2020. Although it’s down from 1.7% in February 2020, it’s not as bad as investors were expecting considering the lockdown in global markets. 

Economic Events to Watch Today     


 EUR/USD – Daily Analysis

The EUR/USD fell by nearly 0.1% to trade at 1.0865. While Spain’s central bank announced, the country’s GDP could fall by 6.8% to 12.4% this year. Later in the today, the major focus will stay on the German ZEW Current Situation Index for April will be released (-75.0 estimated).  

After the Eurozone divided on community debt, most of the analytes are worried that the finance ministers’ may unable to provide a suitable fiscal stimulus to support growth. So, the shared currency could remain under pressure ahead of the Thursday summit.

At the coronavirus front, as per the latest report, the number of confirmed coronavirus cases grew to 145,694, with 4,879 deaths reported in Germany so far. As the cases increased by 2,237 in Germany, a 1.6% rise picking-up pace from Tuesday’s 1.3% increment, the death toll moved sharply up by 281 vs. 194 a day before.

Looking forward, the upbeat Eurozone Consumer Confidence, which is scheduled to release at 14:00 GMT, may put a bid under EUR/USD currency pair. However, the pair trend will remain sluggish until the pair break the trading range of 1.0897 to 1.08616. 

Daily Support and Resistance

  • S1 1.0724
  • S2 1.0788
  • S3 1.0823

Pivot Point 1.0852

  • R1 1.0887
  • R2 1.0916
  • R3 1.098

EUR/USD– Trading Tips

On Wednesday, the EUR/USD is trading sideways at 1.0825, as investors seem to wait for a solid reason to enter the market. The overall bias remains bearish as the EUR/USD prices are holding below 50 EMA, which is extending resistance around 1.08945 level. Continuation of a selling trend below 1.08945 level can continue selling until the next support area of 1.0772, but on the way, the pair may find support around 1.0815 level. 

The EUR/USD is likely to find support around 1.0772, but below this, the next support prevails around 1.0652 level. The pair may find an immediate resistance level of around 1.09230, where the bullish breakout of this level can extend buying until the next resistance level of 1.1036. Conversely, we should look for selling trades below 1.0894.  


GBP/USD – Daily Analysis

The GBP/USD soared 0.3% to trade at 1.2318 as the British Consumer Prices Index (CPI), including owner-occupiers’ housing inflation rate, came out at 1.5% in March 2020. Although it’s down from 1.7% in February 2020, it’s not as bad as investors were expecting considering the lockdown in global markets. 

 At the USD front, investors prefer to choose the U.S. dollar because of its safe-haven-demand in the market due to the fears of economic fallout, which is caused by the coronavirus outbreak. The dollar index, which measures the worth of the greenback against majors, rose 0.20% to levels above 100.00.

The reason behind the decline in GBP/USD pair could also be the immediate rise in COVID-19 cases, with the curve still not notably peaking. It indicates that there is still a high chance that lockdowns could last longer than expected, while the Bankruptcy and bad loans will likely boost the risk-off sentiment in the market and provide further support to the U.S. dollar again.

Apart from the U.K., U.S. President Donald Trump suggested that approximately 20 states ready for re-open while also showing a willingness to sign the bill that stops immigration into the U.S. for 60 days. As in result, the risk sentiment remains under pressure.

The reason behind the risk-off market sentiment could also be the early Asian news surrounding the U.S. Senate’s passage of $484 billion COVID-19 relief package and BOJ’s likely decline of economic and price forecasts. Moreover, statements from the BOE’s Bailey were also necessary to remark during the early Asian session.

As in result, the U.S. 10-year Treasury yields declined by 2-basis points (bps) to 0.55%, after dropping 4-bps on Tuesday, while the most stocks in Asia-Pacific flashing losses by the pres time.


Daily Support and Resistance

  • S1 1.1974
  • S2 1.2148
  • S3 1.2223

Pivot Point 1.2322

  • R1 1.2397
  • R2 1.2496
  • R3 1.2671

GBP/USD– Trading Tip

Yesterday, the GBP/USD fell sharply to trade at 1.2250 after violating the horizontal support level of 1.2424. On the 4 hour chart, the Cable has closed Doji candle above 1.2250 level can drive bullish bias until 1.2350. On the upper side, the Sterling may find next resistance around 1.2426, it’s the same level that supported the pair previously, and now it’s likely to drive selling bias in the GBP/USD pair. On the lower side, the violation of the 1.2265 level can lead the GBP/USD prices towards 1.2175. The 50 EMA and MACD are both are suggesting selling bias in the Cable. So let’s look for selling trades below 1.2322 and bullish above the same level today. 

USD/JPY – Daily Analysis

On Wednesday, the USD/JPY is trading around 107.500 level, mostly exhibiting sideways trading due to a lack of major economic events in the market. The U.S. dollar index slipped to the fresh lows of 100.07 ahead of recovering some ground, still bearish by 0.15% on the day.

The Japanese yen seems to suffer due to a lack of confidence when the state of emergency is being lifted in Japan. While drop-in, the domestic macroeconomic indicators are expected to keep the Japanese yen’s in a bearish mode while maintaining the USD/JPY bullish. Lately, the uptrend in the JPY could be limited due to the forecast of the Bank of Japan (BOJ) support measures to boost funding for the companies due to be announced next week. 

The U.S. Treasury prices advanced as investors continued to seek safe-haven assets. The benchmark 10-year U.S. Treasury yield declined to 0.571% from 0.625% Monday.

On the negative side, the greenback gained ground due to the oil price crash triggered a dash for cash. The high uncertainty in the market also boosted the greenback demand. So, if that trend continues during the ay ahead, the yellow metal could come under pressure.

Daily Support and Resistance    

  • S1 105.92
  • S2 106.84
  • S3 107.44

Pivot Point 107.76

  • R1 108.36
  • R2 108.69
  • R3 109.61

USD/JPY – Trading Tips

The USD/JPY is trading mostly sideways within a narrow trading range of 108.020 – 107.300 zones. At the moment, it’s holding at 107.597, having formed a descending triangle pattern on the 4-hour timeframe. The triangle pattern is extending resistance around 107.850, along with support around 106.980.  

In case, the USD/JPY violates the descending triangle pattern; we may see pair dropping towards 106.200. While on the upper side, a bullish breakout of 108 can lead USD/JPY prices towards 109.100. The leading indicator, such as MACD and 50 EMA, are supporting bearish bias in the market today. Let’s wait for a breakout before taking more trades today.

All the best for today! 

Categories
Forex Market Analysis

Daily F.X. Analysis, April 21 – Top Trade Setups In Forex – Economic Sentiment in Highlights! 

On the forex front, the U.S. dollar firmed against its major peers, with the Dollar Index gaining 0.2% on the day to 99.95. The ZEW survey results of April will be released for Germany (current situation at -75.0, expectations at -42.0 expected) and the Eurozone.

The U.K. Office for National Statistics will report a jobless rate for the three months to February (steady at 3.9% expected). While in the U.S., the National Association of Realtors will report March existing home sales (5.30 million units expected).

Economic Events to Watch Today     


EUR/USD – Daily Analysis

The EUR/USD fell by nearly 0.1% to trade at 1.0865. While Spain’s central bank announced, the country’s GDP could fall by 6.8% to 12.4% this year. Later in the today, the major focus will stay on the German ZEW Current Situation Index for April will be released (-75.0 estimated).  

European stocks were mostly trading higher, with the Stoxx Europe 600 Index surging 0.7%. Both Germany’s DAX and the U.K.’s FTSE 100 added 0.5%, and France’s CAC was up 0.7%, which are somehow supporting the Euro, the single currency. 

As of now, the market participants seem very concerned about the negative impact of the oil prices Monday’s declines and keeps their eyes on it. As in result, the U.S. dollar could continue to gain ground during the Europan trading hours ahead while the S&P 500 futures are now reporting a 0.65% drop. 

The additional bearish pressure could arise from President Trump’s decision to delay immigration to the U.S. to control the coronavirus outbreak. Let’s brace to trade ZEW survey results of April will be released for Germany (current situation at -75.0, expectations at -42.0 expected) and the Eurozone. 

Daily Support and Resistance

  • S1 1.0758
  • S2 1.0813
  • S3 1.084

Pivot Point 1.0869

  • R1 1.0896
  • R2 1.0924
  • R3 1.098

EUR/USD– Trading Tips

Technically, the EUR/USD is trading with a slightly bearish bias at 1.0825, exhibiting a bearish crossover below 50 EMA, which is now extending resistance around 1.0903 level. Continuation of a selling trend below 1.0903 level can extend selling until the next support area of 1.0772, but on the way, the pair may find support around 1.0815 level. The EUR/USD is likely to find support around 1.0772, but below this, the next support prevails around 1.0652 level. The pair may find an immediate resistance level of around 1.09230, where the bullish breakout of this level can extend buying until the next resistance level of 1.1036. Conversely, we should look for selling trades below 1.0870.

GBP/USD– Daily Analysis

The GBP/USD slid 0.5% to 1.2442. Investors will focus on the U.K. jobless rate for the three months to February due later in the day (steady at 3.9% expected). The United Kingdom and European Union Brexit drama keep moving while the latest news recommending to keep a check of Britain’s £39 billion has also been underlined by the cost of dealing with coronavirus, especially the economic £250 billion rescue package announced by Chancellor Rishi Sunak to protect jobs and businesses.

At the USD front, investors prefer to choose the U.S. dollar because of its safe-haven-demand in the market due to the fears of economic fallout, which is caused by the coronavirus outbreak. The dollar index, which measures the worth of the greenback against majors, rose 0.20% to levels above 100.00.

Later today, the U.S. dollar could continue to gain ground during the Europan trading hours ahead due to high safe-haven demand in the market in the wake of intensifying coronavirus fears while the S&P 500 futures are now reporting a 0.65% drop. 

On the other hand, the reason behind the cable’s pair declines could also be the immediate rise in COVID-19 cases, with the curve still not notably peaking. It indicates that there is still a high chance that lockdowns could last longer than expected, while the Bankruptcy and bad loans will likely boost the risk-off sentiment in the market and provide further support to the U.S. dollar again.

Looking forward, traders are keenly waiting for the key U.K. data which is scheduled to release during this day ahead As well as, the coronavirus related headlines also will be key to watch for taking fresh directions in the U.S. dollar.


Daily Support and Resistance

  • S1 1.2298
  • S2 1.2374
  • S3 1.2407

Pivot Point 1.245

  • R1 1.2483
  • R2 1.2526
  • R3 1.2601

GBP/USD– Trading Tip

Taking a look at the 4-hour timeframe, the GBP/USD is trading at 1.2394 level, violating the support level of 1.2400 level. A bearish breakout of 1.2400 support area is expected to trigger a sell-off until 1.2310. The 50 periods EMA is also keeping the GBP/USD pair under pressure while extending resistance around 1.2430. Thus, the bounce off above this level can lead the GBP/USD pair towards the next resistance level of 1.2657. While bearish breakout of 1.2460 can open up further room for selling until the next support area of 1.2220. 

USD/JPY – Daily Analysis

On Tuesday, the USD/JPY is trading with a selling bias around 107.350, due to intensifying coronavirus fears as increased risk sentiment is driving the demand for the safe-haven currency. The slump in the Japanese exports for March keeps Japanese yen down, which also supports the currency pair to stay at the upside. 

The U.S. dollar extends taking bids mostly due to its safe-haven demand in the wake of intensified coronavirus fears. Considering the fresh report that the United States death toll surged over 40,000, whereas SkyNews mentions the U.K. has a bit over 16,000 people who died from the virus.

Looking forward, the North Korean leader’s health and oil moves will be key to watch, and coronavirus updates could be the driver seat for taking fresh directions. Alongside, the trader will keep their eyes on the U.S. dollar dynamics.

Daily Support and Resistance    

  • S1 105.92
  • S2 106.84
  • S3 107.44

Pivot Point 107.76

  • R1 108.36
  • R2 108.69
  • R3 109.61

USD/JPY – Trading Tips

The USD/JPY is trading slightly bearish at 107.339, having formed a descending triangle pattern on the 4-hour timeframe. The triangle pattern is extending resistance around 107.850 along with resistance around 106.980. As we know, the descending triangle pattern usually breakout on the lower side, and if this happens, the violation of 106.980 level may send the USD/JPY currency pair towards 105.850 level. 

All the best for today! 

Categories
Forex Assets

What Should You Know Before Trading The CHF/JPY Currency Pair

Introduction

CHFJPY is a symbolic representation of the Swiss franc against the Japanese yen. Here, CHF is the base currency, and JPY is the quote currency. Since it does not have USD involved, it is classified as a cross-currency pair.

Understanding CHF/JPY

The market price of this pair is the number of JPY that are required to purchase one CHF. It is quoted as 1 CHF per X JPY. For example, it’s current value is 112.31, then 112.31 yen are needed to buy one Swiss franc.

Spread

Spread in forex is the difference between the bid price of a currency and the ask price of it. And this pip difference is used up by the brokers as a form of fee. However, it is not a fixed value. It varies from brokers to brokers.

ECN: 1.3 | STP: 2.1

Fees

Spread is not the only form of fee that is levied by the brokers. There is a commission on the trade as well. The commission is nil on STP accounts, but pips on ECN accounts.

Slippage

When entering a trade using market orders, the trader does not get the exact price he intended when he executed it. There might be a difference in pips. This difference is referred to as slippage. Slippage may be in favor of or against the trader.

Trading Range in CHF/JPY

The trading range is simply a representation of the minimum, average, and maximum pip movement in a currency pair. With these values, one can assess how much money a trader will be risking in a particular timeframe. For example, if the average pip movement on the 4H in this pair is 15 pips, then a trader can expect to win or lose $150.6 in about 4H or so.

Procedure to assess Pip Ranges

  1. Add the ATR indicator to your chart
  2. Set the period to 1
  3. Add a 200-period SMA to this indicator
  4. Shrink the chart so you can determine a large time period
  5. Select your desired timeframe
  6. Measure the floor level and set this value as the min
  7. Measure the level of the 200-period SMA and set this as the average
  8. Measure the peak levels and set this as Max.

CHF/JPY Cost as a Percent of the Trading Range

Apart from knowing the profit or loss can one can incur in a given timeframe, it is necessary to assess the cost of these trades as well. Below is a table that represents the cost variation in different volatilities. And these costs are determined by finding the ratio between the total cost and the volatility.

ECN Model Account

Spread = 1.3 | Slippage = 2 |Trading fee = 1

Total cost = Slippage + Spread + Trading Fee = 2 + 1.3 + 1 = 4.3

STP Model Account

Spread = 2.1 | Slippage = 2 | Trading fee = 0

Total cost = Slippage + Spread + Trading Fee = 2 + 2.1 + 0 = 4.1

The Ideal way to trade the CHF/JPY

The forex market is open 24hours. However, it is not ideal to enter the market at any time. There are times when the costs are low, and times when it’s high.

The percentages in the table are directly proportional to the costs of the trade. It is seen that the percentages are high in the minimum column, and low in the maximum column. Hence, we can conclude that costs are inversely proportional to the volatility of the market. Now, when it comes to choosing the right time to trade, it is best to enter during those times when the volatility of the market is around the average values. This will ensure enough volatility in the market and low costs as well.

In addition, placing orders using limit/pending orders reduces costs too because this will completely nullify the slippage on the trade and will bring down the total cost significantly.

Categories
Forex Assets

Analyzing The CAD/JPY Forex Asset Class

Introduction

CADJPY is the abbreviation for the currency pair, the Canadian dollar against the Japanese yen. This pair is one of the most extensively traded cross currency pairs. In CADJPY, CAD is referred to as the base currency and JPY as the quote currency.

Understanding CAD/JPY

The value of CADJPY is the value of JPY, which is required to purchase one CAD. It is quoted as 1 CAD per X JPY. For example, if the current market price of this pair is 82.651, then these many units of Japanese yen are needed to buy one Canadian dollar.

Spread

The bid price is the price used to sell a currency, and ask price is the price used to buy a currency. There is always a difference between the two prices. This difference is called the spread. It varies from broker to broker and also the type of their execution model.

ECN: 1.1 | STP: 2

Fees

Similar to stockbrokers, there are forex brokers who charge a few pips of fee on each position a trader opens and closes. This fee is no different from the commission brokers levy. On STP accounts, the fee is nil, while on ECN accounts, it is between 6-10 pips depending on the broker one is using.

Slippage

Slippage in trading is the difference between the price requested by the trader and the price he actually received. The two factors responsible for slippage are,

  • The volatility of the market
  • Broker’s execution speed

Trading Range in CAD/JPY

A trading range is a tabular representation of the number of pips a currency pair moved in a given timeframe. It represents the minimum, average as well as the maximum pip movement in six different timeframes. These values prove to be important for assessing one’s risk on a trade. For example, if the minimum pip movement in CADJPY on the 4H timeframe is ten pips, then a trader can expect to lose $917 in about 4H.

Procedure to assess Pip Ranges

  1. Add the ATR indicator to your chart
  2. Set the period to 1
  3. Add a 200-period SMA to this indicator
  4. Shrink the chart so you can determine a large period
  5. Select your desired timeframe
  6. Measure the floor level and set this value as the min
  7. Measure the level of the 200-period SMA and set this as the average
  8. Measure the peak levels and set this as Max.

CAD/JPY Cost as a Percent of the Trading Range

As already mentioned, there is a fee for every trade you take. And knowing the percent fee on the trades you are taking is important, as it depends on the volatility of the market and the timeframe you are trading.

Below is a representation of the total cost variation on trade in terms of percentages. Since costs on ECN accounts are different from STP accounts, we have two separate tables for this concept.

ECN Model Account

Spread = 1.1 | Slippage = 2 |Trading fee = 1

Total cost = Slippage + Spread + Trading Fee = 2 + 1.1 + 1 = 4.1

STP Model Account

Spread = 2 | Slippage = 2 | Trading fee = 0

Total cost = Slippage + Spread + Trading Fee = 2 + 2 + 0 = 4

The Ideal way to trade the CAD/JPY

Before getting right into it, let us comprehend the above tables. The higher the values of the percentages, the higher are the costs on the trade. It is pretty evident from the table that, percentage values are on the higher side in the min column and comparatively lower in the max column. This means that the costs are high when the volatility of the market is low and vice versa. Also, the trades that are taken based on a long term perspective, the costs are considerably low.

One may trade the high volatility markets to minimize your costs, or trade during low volatility by paying high costs. However, it is ideal to enter during those times of the day when the volatility is close to the average values. During these times, one can expect comparatively low costs with enough volatility as well.

On a further note, another simple and effective way to reduce costs is by trading using limit orders. This entry method will take slippage out of the total costs and bring down its value considerably. An example of the same is given below.

Spread = 2 | Slippage = 0 | Trading fee = 0

Total cost = Slippage + Spread + Trading Fee = 2 + 0 + 0 = 2

Categories
Forex Assets

What Should Know About The AUD/JPY Currency Pair?

Introduction

AUDJPY is the abbreviation for the Australian dollar and the Japanese yen. It commonly referred to as “Aussie yen.” It is one of the cross-currency pairs in the forex market. AUD, being on the left, is termed as the base currency and JPY as the quote currency.

Understanding AUD/JPY

The market price of AUDJPY corresponds to the value of JPY that needs to be paid to buy one AUD. It is quoted as 1 AUD per X JPY. For example, if the value of AUDJPY is 74.571, then these many units of the yen are to be produced to purchase one Australian dollar.

AUD/JPY Specification

Spread

Spread is the medium through which brokers generate their revenue. They set different prices for buying a currency and selling a currency. The difference amount becomes their profit margin. The spread usually changes from time to time and varies on the type of execution model.

ECN: 0.7 | STP: 1.6

Fees

Apart from spreads, one needs to pay a charge for every execution a trader makes. It is essentially the commission levied by the broker on each trade. As a matter of fact, there is no fee on STP accounts. But, on ECN accounts, there is a fee of few pips.

Slippage

Going by the definition, slippage is the difference between the price executed by the trader and the price he actually received. It could be in favor of the trader or against him. It all depends on the broker’s execution speed and the change in the volatility of the market.

Trading Range in AUD/JPY

A trading range is a tabular representation of the minimum, average, and the maximum pip movement in a currency pair on different timeframes. These values help in determining the profit that can be made or loss one must bear in a given time frame. And this can be found out by simply finding the product between the pip movement and the value per pip ($9.15).

Procedure to assess Pip Ranges

  1. Add the ATR indicator to your chart
  2. Set the period to 1
  3. Add a 200-period SMA to this indicator
  4. Shrink the chart so you can determine a large time period
  5. Select your desired timeframe
  6. Measure the floor level and set this value as the min
  7. Measure the level of the 200-period SMA and set this as the average
  8. Measure the peak levels and set this as Max.

AUD/JPY Cost as a Percent of the Trading Range

Cost as a percent of the trading range is an illustration of the cost variation by considering the total cost and the volatility of the market in different timeframes. These values are expressed in a ratio that is converted to percentages. And the magnitude of these percentages helps in determining the cost variation in each trade.

ECN Model Account

Spread = 0.7 | Slippage = 2 |Trading fee = 1

Total cost = Slippage + Spread + Trading Fee = 2 + 0.7 + 1 = 3.7

STP Model Account

Spread = 1.6 | Slippage = 2 | Trading fee = 0

Total cost = Slippage + Spread + Trading Fee = 2 + 1.6 + 0 = 3.6

The Ideal way to trade the AUD/JPY

Though Forex is a 24/7 market, it is not ideal to enter any time in the market. There are certain times when you must enter the market, which can help reduce costs significantly. Let us determine that using the above tables.

Note that the higher the magnitude of the percentage, the higher is the cost of the trade. From the table, it can be ascertained that the values are high in the minimum column, implying that the costs are high when the volatility of the market is low. Similarly, the costs are low when the volatility is high. However, it is not ideal to trade during these times. To ensure optimum volatility and affordable cost, one must trade during those times when the volatility is around the average range.

Furthermore, there is another way through which you can reduce your costs. Trading using limit orders instead of the market orders brings down the total cost significantly, as the slippage becomes zero. The decline in the costs on the trade when slippage is made zero is shown below.

Categories
Forex Assets

What Should You Know Before Trading The NZD/JPY Currency Pair

Introduction

NZDJPY, or the NZD/JPY or the New Zealand dollar against the Japanese yen, is a cross-currency pair in the Forex market. The left currency (NZD) represents the base currency, and the one the right (JPY) represents the quote currency.

Understanding NZD/JPY

The market value of NZDJPY is a value of JPY that is required to buy one NZD. It is quoted as 1 NZD per X JPY. For example, if the CMP (current market price) of NZDJPY is 72.657, then it takes 72.657 yen to buy one New Zealand dollar.

NZD/JPY Specification

Spread

Spread is the difference between the bid price and the ask price controlled by the broker. It varies across brokers and their type of execution.

ECN: 0.8 | STP: 1.7

Fees

On every trade a trader takes, there are few pips of fee on it. And this is only on ECN accounts because the fee on STP accounts is nil.

Slippage

Slippage, which happens on market orders, is the difference between the price asked by the client and the price he actually received. There are two primary reasons for it, namely, the broker’s execution speed and the change in volatility of the market.

Trading Range in NZD/JPY

The average, minimum, and maximum pip movement is determined in the trading range table. This comprehensive table helps traders assess the profit they can generate and loss they can incur in a given timeframe. Moreover, this table is helpful in analyzing the cost variation in a trade, which shall be discussed in the next section.

Procedure to assess Pip Ranges

  1. Add the ATR indicator to your chart
  2. Set the period to 1
  3. Add a 200-period SMA to this indicator
  4. Shrink the chart so you can assess a large time period
  5. Select your desired timeframe
  6. Measure the floor level and set this value as the min
  7. Measure the level of the 200-period SMA and set this as the average
  8. Measure the peak levels and set this as Max.

NZD/JPY Cost as a Percent of the Trading Range

The cost of a trade is not the same throughout the trading day. It varies based on the volatility of the market. Hence, it is necessary to know during what times the cost is high and what times it is low. This could be found out from the table illustrated below.

ECN Model Account 

Spread = 0.8 | Slippage = 2 |Trading fee = 1

Total cost = Slippage + Spread + Trading Fee = 2 + 0.8 + 1 = 3.8

STP Model Account

Spread = 1.7 | Slippage = 2 | Trading fee = 0

Total cost = Slippage + Spread + Trading Fee = 2 + 1.7 + 0 = 3.7

The Ideal way to trade the NZD/JPY

The magnitude of the cost percentage is directly proportional to the cost of a trade. So, the higher the value of the percentage, the higher is the cost of a trade. From the table, it can be observed that the cost is highest in the min column compared to the other two columns. This means that the costs are highest when the volatility of the market is low and vice versa, irrespective of the timeframe you’re trading. It is neither ideal to trade when the volatility of the market is high, nor when the costs are high. The average column is on the one we focus on. Trading when the volatility is at the average value is when you can expect moderate volatility and decent costs.

Also, you may reduce your costs by trading using limit or pending orders instead of market orders. This will bring the slippage to ground zero. This, in turn, will reduce the total cost of the trade as well. An example of the same is illustrated below.

Spread = 1.7 | Slippage = 0 | Trading fee = 0

Total cost = Slippage + Spread + Trading Fee = 0 + 1.7 + 0 = 1.7

Hence, it is seen that the costs have reduced by around 50% of the previous value.

Categories
Forex Assets

Information About The GBP/JPY Forex Currency Pair

Introduction

The Great Britain pound versus the Japanese yen is a cross-currency pair in the forex market. It is a widely traded pair with great liquidity and volatility. In this currency pair, GBP is the base currency, and JPY is the quote currency.

Understanding GBP/JPY

The market price of GBPJPY shows the units of yens required to purchase one pound. It is quoted as 1 GBP per X JPY. For example, if the value of GBPJPY is 143.82, then 143.82 yen are to be produced by the trader to buy one pound.

GBP/JPY Specification

Spread

Spread is the difference between the bid price and the ask price set by the broker. These prices vary from broker to broker and type of account model as well. The approximate spread on ECN and SPT accounts is mentioned as follows.

ECN: 0.7 | STP: 1.6

Fees

There is a fixed round-trip fee on every trade a trader takes. On ECN accounts, the spread is around 6 to 10 pips. And on STP accounts, there is no fee as such. However, though there is no fee on STP accounts, the total fee is still compensated with the high spread on it.

Slippage

Slippage is another parameter that adds up to the total fee. It is the difference between price executed by the trader and price he actually received from the broker. This happens solely due to the change in volatility of the market and the broker’s execution speed.

Trading Range in GBP/JPY

The trading range is a pip depiction tool that determines the minimum, average, and maximum pip movement in a different timeframe. This volatility table is pretty useful in analyzing the amount of risk that is involved in a trade. For example, if the max pip movement on the 4H is 60 pips, then a trader can get an idea that he can gain/lose a max of $552.6 in a time frame of 4 hours.

Procedure to assess Pip Ranges

  1. Add the ATR indicator to your chart
  2. Set the period to 1
  3. Add a 200-period SMA to this indicator
  4. Shrink the chart so you can assess a large time period
  5. Select your desired timeframe
  6. Measure the floor level and set this value as the min
  7. Measure the level of the 200-period SMA and set this as the average
  8. Measure the peak levels and set this as Max.

GBP/JPY Cost as a Percent of the Trading Range

The cost as a percent of the trading range is again the volatility but combined with total cost on a trade. It is a tabular representation of the cost of trading in varying timeframes and volatilities. The percentages are obtained simply by finding the ratio between the total cost and volatility.

ECN Model Account

Spread = 0.7 | Slippage = 2 |Trading fee = 1

Total cost = Slippage + Spread + Trading Fee = 2 + 0.7 + 1 = 3.7

STP Model Account

Spread = 1.6 | Slippage = 2 | Trading fee = 0

Total cost = Slippage + Spread + Trading Fee = 2 + 1.6 + 0 = 3.6

The Ideal way to trade the GBP/JPY

The magnitude of the percentages basically determines how high or how low the costs are for each trade. If the percentage is high, the costs are high. If they are low, the costs are low. The very first observation that can be made is that the costs are high in the min column comparative to the average column and maximum column. Hence, the costs are high for low volatile markets, and low for high volatile markets. But, it is not ideal to trade in either of these markets. The best time to get into the pair is when the volatility is around the average values. As far as the timeframes are concerned, the cost decreases as the width of the timeframe increases.

Placing limit orders is another way to minimize your cost significantly. Because this will not take slippage into consideration for calculating the total costs. Thus, the total cost reduces greatly. An example of the same is illustrated below.

Hence, we can see that the percentages have reduced by around 50% or so.

Categories
Forex Assets

Understanding The EUR/JPY Asset Class

Introduction

The Euro area’s euro against the Japanese yen, in short, is termed as EURJPY. This pair, too, like the EURCHF, EURNZD, EURCAD, EURGBP, etc. is a minor or cross currency pair. It is one of the most traded currency pairs in the forex market. Here, the EUR is the base currency, and JPY is the quote currency. The value of this pair is quoted in terms of the quote currency.

Understanding EUR/JPY

This currency pair is precisely quoted as 1 EUR per X JPY. In simple terms, the value determines the units of the quote currency (JPY) required to buy one unit of the base currency (EUR). For example, if the market value of EURJPY is 121.00, it basically means that these many yen are required to purchase one euro.

EUR/JPY Specification

Spread

Spread is the difference between the bid price and the ask price set by the broker. This value is not constant and varies from broker to broker. It also varies on the type of account model.

Spread on ECN model: 0.6

Spread on STP model: 1.5

Fees

Spread is not the only way through which brokers generate their revenue. They charge some fee (commission) on each trade as well. Fees again vary from broker to broker and account model. Typically, there is no fee on an STP account. However, there are a few pips or fees on an ECN account as their spread is lesser than an STP account.

Slippage

Slippage is the difference between the trader’s asked price and the actual price given to him. Two factors majorly affect slippage on a trade; one, the volatility of the market, and two, broker’s execution speed. The slippage is usually within 0.5 to 5 pips. For major currencies, the slippage is much lower.

Trading Range in EUR/JPY

The trading range is the illustration of the minimum, average, and the maximum number of the pips the currency pair has moved in a given time frame. These values help assess the profit/loss potential of a trade. For instance, if the max volatility on the 1H is 10 pips, then one can expect to win or lose a maximum of $92 (10 pip x 9.20 value per pip) in an hour or two.

Procedure to assess Pip Ranges

  1. Add the ATR indicator to your chart
  2. Set the period to 1
  3. Add a 200-period SMA to this indicator
  4. Shrink the chart so you can determine an extensive period
  5. Select your desired timeframe
  6. Measure the floor level and set this value as the min
  7. Measure the level of the 200-period SMA and set this as the average
  8. Measure the peak levels and set this as Max.

EUR/JPY Cost as a Percent of the Trading Range

In addition to assessing the profit/loss in a timeframe ahead of time, we can use these values in determining the cost variation in different timeframes and volatility as well. The cost as a percent of the trading range tells the min, average, max costs by considering the timeframes and volatility as its variables.

ECN Model Account 

Spread = 0.6 | Slippage = 2 | Trading fee = 1

Total cost = Slippage + Spread + Trading Fee = 2 + 0.6 + 1 = 3.6

STP Model Account

Spread = 1.5 | Slippage = 2 | Trading fee = 0

Total cost = Slippage + Spread + Trading Fee = 2 + 1.5 + 0 = 3.5

The Ideal way to trade the EUR/JPY

Above are the costs of each trade in terms of percentages. Note that they do not represent the actual cost on trade in terms of dollars, but are magnitude values which can be used for comparing with other values. The higher the magnitude of the percentage, the higher is the cost on the trade for that particular timeframe and volatility. From the tables, it can be ascertained that the values are highest on the min column and lowest on the max column. This, in turn, implies that the costs are higher when the volatility is low and vice versa. Talking about the timeframe, the costs are high on the lower timeframes and low on the higher timeframes. So, a day trader may preferably trade on the 2H/4H when the volatility is around the average values. And long-term traders may trade the 1W/1M whatsoever be the volatility of the market.

Furthermore, a trader may reduce their costs by entering and exiting trades using limit order instead of market orders. This will completely erase the slippage on the trade. An example of the same is given below.

Total cost = Spread + trading fee = 0.6 +1 = 1.6

Categories
Forex Assets

Understanding The Fundamentals Of USD/JPY Forex Pair

Introduction

USDJPY is the abbreviation for the currency pair US dollar against the Japanese yen. This currency pair is very liquid and volatile. It is classified as a major currency pair. Here, USD is the base currency, and JPY is the quote currency. The currency pair shows how many JPY are required to purchase one US dollar.

Understanding USD/JPY

The exchange rate of USDJPY represents the units of JPY equivalent to one US dollar. For example, if the value of USDJPY is 109.550, then these many Japanese yen are required to buy one US dollar.

USD/JPY Specification

Spread

Spread is simply the difference between the bid price and the ask price. It depends on the account type. The average spread for ECN and STP account is shown below.

Spread on ECN: 0.5

Spread on STP: 1.2

Fees

The fee is basically the commission charged by the broker on each trade. Typically, the fee on STP accounts is nil, and there is some fee on the ECN account. There is no fixed fee on the ECN account and varies from broker to broker.

Slippage

Slippage is the difference between the price needed by the trader and the real price the trader was executed. Slippage happens when orders are executed as market orders. The slippage is usually within the range of 0.5 to 5 pips.

Trading Range in USD/JPY

The trading range is the representation of the minimum, average, and maximum volatility on a particular timeframe. It shows the range of pips the currency pair moved on a given timeframe. These values prove to be helpful in assessing a trader’s risk and controlling their cost on a trade.

USD/JPY PIP RANGES

Procedure to assess Pip Ranges

  1. Add the ATR indicator to your chart
  2. Set the period to 1
  3. Add a 200-period SMA to this indicator
  4. Shrink the chart so you can assess a large time period
  5. Select your desired timeframe
  6. Measure the floor level and set this value as the min
  7. Measure the level of the 200-period SMA and set this as the average
  8. Measure the peak levels and set this as Max.

USD/JPY Cost as a Percent of the Trading Range

Just knowing how many pips the currency pair moved is pointless. To bring it some value, it is clubbed with the total cost to understand how the cost varies based on the volatility of the market. It shows cost and volatility are dependent on each other.

The relation between Cost and Volatility

Cost and volatility are inversely proportional to each other. When the volatility of the market is low, the costs are high; and when the volatility is high, the cost is low. More on this is discussed in the subsequent section.

ECN Model Account

Spread = 0.5 | Slippage = 2 | Trading fee = 1

Total cost = Slippage + Spread + Trading Fee = 2 + 0.5 + 1 = 3.5

STP Model Account

Spread = 1.2 | Slippage = 2 | Trading fee = 0

Total cost = Slippage + Spread + Trading Fee = 2 + 1.2 + 0 = 3.2

The Ideal way to trade the USD/JPY

The above two tables are formed by finding the ratio between the total cost and the volatility. It is then expressed in terms of a percentage. Comprehending the values is simple. It is based on the relation between cost and volatility. If the percentage value is high, then the cost is high for that particular volatility and timeframe. It can be inferred that the min column has the highest values compared to the average and max column. This simply means that the costs are high when the volatility of the market is low. Hence, it is recommended to open/close positions when the volatility is at or above the average mark.

Furthermore, apart from volatility, the cost is heavily affected by the slippage. As mentioned, this happens due to market order executions. Hence, to reduce your cost by up to 50% on each trade, it is recommended to trade using limit orders and not market orders.

Categories
Forex Course

15. All About Trading The Tokyo Session!

Introduction

Japan’s capital Tokyo, is the most majorly traded market in the Asian continent. That is, in Asia, the highest volume comes from the Tokyo market. In fact, it is considered the financial capital of Asia. Moreover, it is the third-largest trading center in the world.

The Tokyo session, also referred to as the Asia session, opens at 8:00 PM EST and is traded until 5:00 AM EST. In terms of Japan’s local time, the trading happens between 9:00 AM to 6:00 PM. As ‘Yen’ is the currency of Japan, 16.50% of all the Yen transactions take place during this time. And as far as all currency transactions are concerned, the value lies at 21%.

The one that matters the most during any session is the pip movement in different pairs. Below is a table which represents the average pip movement for some of the major currency pair.

Now, the average of the above currency pairs turns out to be around 53 pips. This number is less when compared to the New York session and the London session.

Some facts about trading the Tokyo session

During this session, the market is seen to fade away its momentum. That is, the market is seen to be quite flat. In technical terms, the market usually goes through a consolidation state. This session might not be the ideal session for the ones looking for large pip movement. However, this session can be great for scalpers.

Tokyo market typically is known to correct the overbuying and selling in the New York session. The market makes drastic moves during the NY session and comes to slows down its pace during the Tokyo session. Therefore, the liquidity during this session is quite feeble.

It is not just the central banks and hedge funds that move the market. Since Japan is the largest exporter in the world, a large number of transactions come from the exporters as well.

Also, the Bank of Japan is an active participant in the forex market during the Tokyo session. This is because it intervenes the curb appreciation in the Yen regularly.

Which currency pairs should you focus on?

The market conditions and situations tend to change from time to time, so it becomes uncertain to predict the exact movement of pairs. However, if we were to consider the average rates, we can keep an eye on the news from countries like Australia, New Zealand, China, and Japan. The news from these countries comes during the Tokyo session or just before its open. And the news usually pumps up the volatility and liquidity of the market. Hence, one can have a focus on AUD, NZD, and JPY pairs.

When the Tokyo session comes to an end, the London markets open, which causes overlap between the two sessions. So, to be part of the significant movements, keep an eye on GBP, EUR, and CHF along with AUD, NZD, JPY, and USD.

This is a brief review of the Tokyo session. We shall discuss the other sessions as well in the upcoming lessons. Take the below quiz to know if you have learned the concepts right.

[wp_quiz id=”46800″]
Categories
Forex Market Analysis

Bullish Economy at a Crossroad: Free Trade against Protectionism


Underlying Events


Last week’s volatility was fueled early Monday by Italy’s political instability as Italian president Sergio Mattarella refused to appoint Giuseppe Conte, a Eurosceptic, as Finance Minister even though he has the backing of the majority of the parliament.

Then, on May 30, as fears about Italy eased the markets focused its attention on EU officials statements against the US imposed tariffs on steel and aluminium.

“The US is playing a dangerous game by slapping tariffs on European steel and aluminium,” said Cecilia Malmstrom, warning about the consequences for economic recovery on the EU as well as US industry. (source BBC)


 Last week’s Economic Calendar was full of interesting releases


US

May’s US Consumer Confidence figure is at its historic highs, at its estimated 128.0 level, non-farm unemployment is at 3.8%, and US GDP (QoQ) grew at 2.2% a tick below estimations, while US Advance Goods Trade Balance was below expectations at -68.2b.

On the consumer front, May 31 brought us the US PCE Core (YoY) that is stable at 1.8%, the Personal Income (APR) stable at 0.3%, and Pending Home Sales (MoM) below expectations at -1.3%, below the expected 0.4%.

On the Energy Front, crude oil inventories were -3620K well below the expected 450k, while the gasoline inventories were 634K, above the expected -1200K

Finally, the USD Manufacturing figures were a bit above expectations, at 58.7 over 58.2 expected.

Eurozone

German retail sales on April (MoM)grew 2.3% well above the expected 0.5% although the yearly figure fell to 1.2% growth, below the expected 1.6%.

On the unemployment front, Germany’s May unemployment change was -11K above the expectations, and the unemployment Claims rate dropped one centile to 5.2%.

Britain’s consumer credit grew to 1.84B, above the expected 1.3B, while the mortgage approvals slightly descended to 62.5K, below the expected 63.2K

Swiss’s main figure this week was its Gross Domestic Product (YoY) for the first quarter at 2.2%, slightly below the expected 2.3%.

Japan:

JPY retail trade (YoY) grew 1.6%, above the expected 1%, while JPY retail sales figure was down -0.8% below the expected 0.2%. Also, JPY industrial production for April was up 2.5%, below the expected 3.6%.

Canada:

Last week BoC kept its interest rate unchanged at 1.25%, as was expected. However, its GDP figure for the first quarter was a disappointing annualised 1.3%, below the expected 1.8%

The overall picture of this economic background is that of a strong US economy, a not so strong Eurozone, and a possible weakening of the Canadian economy. This is especially sensitive as both Europe and Canada have a potential tariffs war against the USA. We also see weakened Japanese industrial production.

All this make us think on the continuation of the strength of the US Dollar and a further weakening scenario for the Euro, the Pound, and the Yen.


Next Week


G7

Next week lacks major economic reports and no earnings news, so markets will possibly pay attention to political developments that will fill the headlines, such as President Trump’s trade wars, or the G7 summit by the end of the week in Canada. Mr Trump is expected to arrive on Friday and meet leaders from Germany, UK, France, Italy, and Japan. A statement of the other six members of the group showed their “unanimous concern” about US tariffs.


US Trade Data.

To be released on Wednesday (14:30 GMT+2). The forecasted deficit is 50.0 B from 49B in March.


China Trade Figures:

To be released in the early hours of Friday. The expectations are for an increase of the surplus figures to $32.5B, higher than last month’s $28.8 B.

It is expected that exports will grow by 6.3% and imports to rise 16%.


RBA Policy meeting:

Due on Tuesday early morning, it will likely keep its rates unchanged at 1.5%.

We should also pay attention to the New Zealand GDP release early Wednesday.


Technical Analysis


S&P 500

The S&P 500 behave very bullishly on a weekly basis, although it suffered some drawbacks during the week. Technically the price moves inside a very steep upward channel, but right now it is close to a resistance area that matches the opening of a large red candle drawn in March. We need to watch how the price reacts here. If it is crossed next week we see a free path to head for January highs, mid-term.


Ehlers Adaptive Moving Average MAMA and cycle indicator show a bullish momentum is developing. The only black cloud in the sky is that the price is facing a strong resistance area.


DAX

The weekly chart shows that the DAX and the Euro-zone are not confident of its economic outlook.  The Index has drawn two consecutive bearish candles and we see that it shows descending lows. Its Cycle Indicator also points to the downside.

We have to pay attention next week to the US index because the DAX is correlated to it, but if we only pay attention to the technical outlook, we are more in the side of the bearish scenario.


The daily chart doesn’t change its outlook. We see that the price broke the triangular formation to the downside and tested it three times last week without being able to break it. Last Friday, although the session closed with gains, the inside candle drawn shows indecision and doubt. The most probable scenario is for the DAX to head down to test the support at 12378 level.


US Dollar Index

The US Dollar Index weekly chart shows a Spinning Top candle, while Ehlers’ Cycle indicator has changed to bearish. This may indicate that last week’s correction isn’t finished yet and we may look for a test of the Fibo 0.38 or, even to a 50% retracement, although this is less probable.


The Dollar Index daily chart’s engulfing candle that happened on May 29 has been challenged but not successfully. The Cycle indicator also points to the bearish side. Therefore our expectation is for more drops next week.


This means the Euro and GBP could still be retracing their heavy drops that started mid-May.


USDJPY

On a weekly chart the pair made an engulfing candle two weeks ago, and last week it continues moving down toward its support zone, where it bounced sharply up creating a hammer.
The price is moving mainly by its fundamentals, and now it is heading to the resistance area (green rectangle ). We may see the pair moving between those two areas for some time.


Looking at the daily chart, the pair broke the triangle formation to the upside with a large candle. The cycle indicator also points upward.
The target level is at its recent highs.


Categories
Forex Market Analysis

US Trade Balance Deficit Reaches the Highest Level Since December 2008

Hot Topics:

  • US Trade Balance deficit reaches the highest level since December 2008.
  • PMI Markit Composite of the Eurozone shows signs of a slowdown.
  • PMI UK Services falls to the lowest value since 2016.
  • Yen fails in its attempt to approach the 108.
  • Aussie developing the second leg.
  • Loonie moves sideways while waiting for the employment data.
  • Dow Jones closes bearish on new tariffs to China.
  • Crude Oil performs a pullback towards the $64 level.

US Trade Balance deficit reaches the highest level since December 2008.

February 2018 Trade Balance, has reached its highest level since December 2008, as indicated by the Department of Commerce. The deficit in goods and services for the year to date has increased by 22.7% ($ 21.1 billion) compared to the same period of 2017. Exports, meanwhile, have increased 5.9% ($ 22.4 billion) and imports have risen 9.1% ($ 43.6 billion).

On the technical side, the Dollar Index has reached the control area we mentioned in the last Daily Update. Now we have to wait for a confirmation of the reversal zone to look for continuity in the bearish positions against the dollar.


PMI Markit Composite of the Eurozone shows signs of a slowdown.

The Purchasing Managers’ Index (PMI) published by the agency Markit Economics, has reported a sharp fall in March, reaching 55.2 points, below February’s  57.1 pts. This lower PMI Index level is a sign of deceleration in new orders growth. This situation may be the result of a combination between the consequences of inclement weather in some regions of northern Europe and a limitation in the capacities of the supply-chain to meet the number of orders that have been accomplished in previous periods. Despite these pessimistic signals, as reported by the latest Daily Update, the Euro has drilled 1.2240 control support, at which we began to assess potential purchases that could take us to levels close to 1.235.


PMI UK Services falls to the lowest value since 2016.

The Service Purchasing Managers’ Index has sunk to its lowest registered value since 2016, reaching 51.7 pts compared to the 54.5 pts reported in March. This index value is worse than its quarterly moving average of 53.07 pts. As a result of this data, the cable has perforated the psychological support of 1.40, reaching 1.3965. This break-down has activated a Head-Shoulders pattern, which level of invalidation is above the 1.42 level. However, our long-term vision is in favour of long positions of the pound due to the weakness expected in the Dollar Index.

Yen fails in its attempt to approach the 108.

The weakness of the dollar has caused the yen to fail in its attempt for the USD-JPY to reach 108. In the midst of trade tension between the United States and China over tariffs, the yen exceeded 107, the key resistance that we were reporting in the last Daily Update reaching 107.44. The Japanese currency is developing a bearish leg to 107.01, a level that could act as support in the future. In today’s session, in where the US employment levels will be announced, we expect it to build enough volatility to validate if the pair manages to overcome the long-term resistance at 108.


Aussie developing the second leg.

The oceanic currency is developing a corrective structure that began at the 1.8135 high level, starting in January. The price is currently approaching a long-term bullish trend-line, and the bearish guidelines of the current formation give us a potential reversal zone between 0.7620 and 0.7573, the invalidation level is below 0.7501.


Loonie lateralizes while waiting for the employment data.

The Canadian dollar is consolidating in the range of 1.2745 – 1.28 pending the employment data from the United States and Canada that will be announced in the last trading session of the week. Our view is that the USD-CAD could make a limited bearish movement until 1.2715 to begin a bullish move as a potential second shoulder. Our long-term outlook for the pair continues to be bearish due to the inverse correlation with crude oil.


Dow Jones closes bearish for new tariffs to China.

The escalation of volatility due to tariffs between the United States and China continues. During this Thursday, President Trump has instructed the Trade Representative to consider the application of $100 billion in additional tariffs against China. In a statement, Trump said: “In light of China’s unfair retaliation, I have instructed the USTR to consider whether $100 billion of additional tariffs would be appropriate under section 301 and if so, to identify the products upon which to impose such tariffs.” Once this statement was published, the Dow Jones index that started the bullish session collapsed more than 400 points testing 24,037 points. Our vision is a scenario in which the Dow Jones could perform a corrective process in the form of A-B-C, as long as the price does not close below 23,330 pts, we will maintain the view of bullish positions.


Crude Oil performs a pullback towards the $64.

Crude oil has retreated to the neckline of the Head-Shoulder pattern at $64.1 that has been activated with a profit target at $61.8. The falls could reach even $61.44, a level that could coincide with the base of the long-term uptrend line. The invalidation level of the long-term bullish scenario is $60.2.

©Forex.Academy


Categories
Forex Educational Library

Japan’s Economic Outlook

Japan’s economic outlook

Category: Fundamental analysis, Intermediate, Currencies, economic cycles, Monetary Policy, Economy, Macroeconomics, Central Banks.

Key Words: Central Banks, Monetary Policy, Bank of Japan, Projections.

At each meeting of the bank’s board, a review is made of the state of the Japanese economy, the projections for the current year and the next two years, and the risks to which the economy is exposed both internally and externally.

In the April 2017 report, the board concluded that the economy would continue its positive trend growing above the potential stipulated by the bank, due to better internal financial conditions, some government stimulus and greater global economic growth. The bank was explicit that the expected growth in 2017 and 2018 would be higher than in 2019 due to a cyclical slowdown in fixed investment in business and an increase in the consumption tax that had already been programmed.

As global growth had generally improved, Japanese exports had shown an upward trend, contributing to economic growth. Private consumption had also been resilient due to a better outlook in the labour market with better employment rates and higher wages.

As already mentioned, the bank expected that by 2019 the local economy would slow down a little due to a slowdown in domestic demand reflecting the closing of the cycle of expansion in business investment in addition to the increase in consumption tax since that year.

Regarding inflation, the annual change in the CPI (Consumer Price Index) excluding fresh food continued to show better figures than in 2016 with a clear upward trend thanks to a better performance of the economy and an increase in expectations medium and long term. But even the price growth is not as strong as the bank would like so they followed the price index with some caution.

The annual CPI for April excluding food and energy was close to 0%, so the bank was still expectant that the price index was far from the target rate of 2%.

Regarding monetary policy, the bank indicated that it would continue to apply Quantitative and Qualitative Monetary Easing with the Yield Curve control, with the objective of using it until inflation hit 2% so that the short-term interest rate would remain in negative territory.

Inflation could reach 2% in the medium and long-term, but not in the short term due to the weak behaviour of the main price indices. It was estimated that in the medium and long term it could reach  2% due to better economic growth rates added to energy prices that have been rising in recent years. In addition, the policy of monetary easing continued to drive the supply of credit and liquidity to the market so that inflation continued to rise to the bank’s target figure.

Also, the unemployment rate continued to decrease showing figures between 2.5 and 3%, so the labour market was narrowing which could generate an increase in the nominal wages of people, which in turn could lead people to consume more and this would boost inflation. The following two graphs show the main projections of the members of the committee and the expected behaviour of the CPI until 2019.

Graph 77. Forecasts of the majority of Policy Board Members. Retrieved 27th February 2018 from https://www.boj.or.jp/en/mopo/outlook/gor1704b.pdf


 Graph 78. CPI (ALL ITEMS LESS FRESH FOOD. Retrieved 27th February 2018 from https://www.boj.or.jp/en/mopo/outlook/gor1704b.pdf


In the July report, the committee stated that the path of economic growth was still positive due to the already exposed factors of a better global panorama and incentives created by the government to stimulate the local economy.

Regarding inflation, there were negative signals that showed a weak CPI (excluding food and energy prices), being in figures between 0 and 0.5%. The bank indicated that it could be due to the caution that the companies had at the time of fixing the prices and the wages of their workers. This behaviour of the companies caused expectations to decrease somewhat on inflation in the medium and long-term. The bank stressed that for inflation to reach 2% companies had to be more determined when setting prices and wages.

What was driving inflation in recent months were energy prices due to higher global demand for fuels and the agreements reached by OPEC to sustain oil prices, which is why the bank was concerned that the other components of the prices were not contributing to the rise of the recent CPI.

Due to the weakness of inflation, the bank decided that it would continue with its policy of monetary easing until inflation was close to levels close to 2%, so that short and medium-term interest rates would remain in negative territory. In addition, the financial market continued to offer credit facilities to the market.

Despite the weak performance, in the bank’s projections, it was estimated that in the medium and long-term the inflation rate would be at 2%, but the projections had fallen slightly on this variable for the next two years.

In the October 2017 report, the bank’s committee continued to observe a positive performance of the economy due to higher exports thanks to the better performance of the world economy throughout 2017.

In terms of domestic demand, fixed investment in business had followed a slight upward trend with better profits from companies and better expectations of entrepreneurs on the Japanese economy.

Private consumption continued to grow moderately, thanks to the better performance of the labour market. There were good rates of job creation and wages rose slightly. Public investment had also had positive behaviour during the last quarter, but not spending by households that had shown flat figures throughout the year.

Looking at the financial conditions, the outlook did not change with respect to the two previously issued reports, since the short and medium-term rates remained in negative territory. Financial institutions were still willing to lend to the market, and corporate bonds were still well received by the market, so the bank continued to observe the accommodative financial conditions.

Although inflation continued to rise slightly as in mid-2017, this behaviour was mainly explained by the rise in fuel prices and energy in general. The weak behaviour of the CPI excluding food and energy was due to the little increase in prices of companies as well as wages and a mobile phone market increasingly competitive in prices.

If you compare the projections that the bank had in October with the projections at the beginning of 2017, the CPI showed a weaker than expected behaviour, but it was expected that in 2018 and 2019 inflation would have more positive figures as shown in the following graph.

Graph 79, CPI (ALL ITEMS LESS FRESH FOOD, Retrieved 27th February 2018 from https://www.boj.or.jp/en/mopo/outlook/gor1710b.pdf


The reasons for a better performance of the CPI for the following years should be given thanks to better conditions in the labour market, better performance of the economy in general and better market expectations. The graph shows that inflation bottomed out at the end of 2016, showing deflationary signs.

The risks faced by the Japanese economy according to the bank were:

  • New regulations implemented in the United States and economic performance will directly affect global growth
  • Geopolitical risks
  • The Brexit negotiations
  • The problem of the European debt

These factors could affect the decline of the Japanese economy due to its direct involvement in world trade. The following graph shows the bank’s projections at the October meeting.

Graph 80. Forecasts of the majority of Policy Board members. Retrieved 27th February 2018 from https://www.boj.or.jp/en/mopo/outlook/gor1710b.pdf


If these projections are compared with those made at the beginning of the year and July, expectations for 2017 and 2018 improved and remained the same for 2019. That shows the good performance of the economy and a slight recovery of inflation, but as the bank reaffirmed that recovery was not robust since it was mainly based on energy prices. The other components of the CPI did not yet show positive figures, so the bank expected 2019 to be close to 2%.

As long as the inflation rate was not close to 2%, the monetary easing policy would continue. That would include negative interest rates and acquisitions, and corporate bonds to provide liquidity to the market and thus achieve better growth rates. This would encourage companies to be more aggressive in its increases in prices and wages of workers, which was not as strong as would be expected from a narrow labour market, although they did rise during 2017.

The following graph shows the CPI excluding food and energy which shows that the figure during 2017 was well below 0.5% which is negative and gives the reason why the bank committee was concerned because the basic items of the index showed a very weak behaviour.


Graph 81. Chart 38, CPI. Retrieved 27th February 2018 from https://www.boj.or.jp/en/mopo/outlook/gor1710b.pdf

©Forex.Economy