Categories
Forex Signals

AUD/JPY Gains Support Over Double Bottom – Is It Worth Holding Sell Trade?

The AUD/JPY pair traded bearish, falling from 79.77 level to trade low at 79.50. On the lower side, the AUD/JPY may find support at the 79.50 level, and a bearish breakout of this level can extend selling bias until the 79.14 level. The 10 & 20 periods EMA are supporting selling bias, along with the 50 MACD and RSI indicators. Let’s follow a trading plan below:

Daily Support and Resistance

S1 0.7547

S2 0.7632

S3 0.7668

Pivot Point 0.7717

R1 0.7753

R2 0.7802

R3 0.7887


Entry Price – Sell 79.678

Stop Loss – 80.078

Take Profit – 79.278

Risk to Reward – 1:1

Profit & Loss Per Standard Lot = -$400/ +$400

Profit & Loss Per Micro Lot = -$40/ +$40

Fellas, now you can check out forex trading signals via Forex Academy mobile app. Follow the links below.

iPhone Users: https://apps.apple.com/es/app/fasignals/id1521281368

Andriod Users: https://play.google.com/store/apps/details?id=academy.forex.thesignal&hl=en_US


Categories
Forex Signals

AUD/JPY Triple Top Pattern Offering Sell Trade – Quick Update! 

During Wednesday’s Asian trading session, the AUD/JPY currency pair failed to halt its modest bearish moves and remained depressed near below the 77.00 level due to Australia’s downbeat housing data, which tends to undermine the Australian dollar and contribute to the currency pair declines. Apart from this, the reason for the currency pair’s losses could also be attributed to the prevalent Brexit risks and trade tussles between China and the West, which keep challenging the upbeat market mood and undermining the perceived riskier Australian dollar. 

On the contrary, the market risk-on sentiment, backed by the optimism over a potential vaccine for the highly dangerous coronavirus infection, tends to undermine the safe-haven Japanese yen and becomes the key factor that helps the currency pair limit its deeper losses. Furthermore, the risk-on market sentiment could also be attributed to the reports suggesting that the U.S. presidential transition has finally started, which offers political certainty. Across the pond, the downbeat Japanese corporate service price index data added further burden around the Japanese yen and became the key factor that kept the lid on any additional losses in the currency pair. Currently, the USD/JPY currency pair is currently trading at 76.67 and consolidating in the range between 76.64 – 77.05.

Despite the lingering doubts about the U.S. economic recovery and the escalating tension between the world’s two biggest economies, the market players continue to cheering optimism over a potential vaccine for the highly dangerous coronavirus infection, boosts the hopes of global economic recovery and supporting the market trading sentiment. Thus, these further developments surrounding the covid vaccine favor the market’s risk-on mood. However, the perceived risk currency Australian dollar is relatively unaffected by the risk-on market sentiment and remains defensive amid downbeat housing data from Australia. At the data front, the Constriction Work Done for the 3rd-quarter (Q3) dropped below -2.0% forecast and -0.7% previous readouts to -2.3% QoQ.

Across the pond, the reason for the upbeat market mood could also be associated with the on-going optimism over the U.S. economy as President-elect Joe Biden has recently been allowed to receive the President’s Daily Brief, the collection of classified intelligence reports prepared for the national leader. This, in turn, undermined the safe-haven Japanese yen and became the key factor that helps the currency pair limit its deeper losses. Moreover, the currency pair’s losses were also capped by the downbeat Japanese corporate service price index data, which tends to undermine the Japanese yen and helps the currency pair to cap its downside momentum.

On the other hand, the intensifying coronavirus woes across the globe and intensifying lockdown restrictions in Europe and the U.S. keep challenging the upbeat market sentiment, which could also be considered one of the key factors the currency pair down. The reason could also be associated with the long-lasting delay in the much-awaited coronavirus (COVID-19) relief package, which also probes the bulls and contributes to currency pair declines.

Looking ahead, the market traders will keep their eyes on the U.S. economic calendar, which will show the releases of the U.S. Preliminary Q3 GDP, Initial Jobless Claims, Durable Goods, and Core PCE Index. This data will likely influence the USD price dynamics and help traders to take some fresh directions. All in all, the updates surrounding the Brexit, virus, and U.S. stimulus package will not lose their importance.


Daily Support and Resistance

S1 75.57

S2 76.15

S3 76.52

Pivot Point 76.73

R1 77.1

R2 77.31

R3 77.88

The AUD/JPY pair faced resistance at 77 levels, holding below an immediate support level of 76.58. A bearish breakout of the 76.58 level can extend selling bias until the 76.23 level. The MACD and RSI are holding below a double top level of 77, suggesting odds of a selling bias in the AUD/JPY. Continuing a selling trend can lead the AUD/JPY until 76.58 and 76.25 level today, thus we entered the sell trade signal. Stay tuned; good luck! 

Categories
Forex Signals Forex Technical Analysis

AUD/JPY Pair Failed to Gains Positive Traction – Brace for Selling!  

Today in the Asian trading session, the AUD/JPY currency pair failed to keep its early-day bullish momentum and dropped well below the 76.00 level despite the upbeat market sentiment. However, the reason for the prevalent bearish sentiment around the currency pair could be associated with the RBA’s announcement of no rate change, as well as, the RBA has a dovish view on the Australian economy, which could be considered as one of the key factors that undermine the Australian dollar and contributed to the currency pair losses. Across the pond, the currency pair declines were further bolstered after the US Secretary of State Mike Pompeo said Japan’s Prime Minister (PM) Yoshihide Suga would strengthen the relationship with the US. Thus, the Japanese yen got impressed by the above comments, which adds further downside pressure around the AUD/JPY currency pair. 

On the contrary, the upbeat market mood, backed by optimism over US President Trump’s health, could be considered one of the key factors that help the currency pair limit its deeper losses. The AUD/USD currency pair is currently trading at 75.64 and consolidating in the range between 75.60 – 76.16. As we already mentioned, the global risk sentiment got a strong boost after US President Trump leaves the hospital and feels “20-years younger”. Despite this, the doubts over Donald Trump’s remain high as a recent video from the American leader showed that he struggles while breathing. Besides, the doubts were further fueled after the White House’s recent confirmation that Trump will be under 24-hour care, and anybody nearing the President will need to wear the PPE kit. 

At the US-China front, the renewed US-China tussle also keeps challenging the market risk-on mood, adding further pessimism around the currency pair. As per the latest report, the Dragon Nation recently fueled the Sino-American tussle by criticizing the US ban on TikTok and WeChat at the World Trade Organization (WTO). 

At the AUD front, the Reserve Bank of Australia (RBA) held its cash rate, and the targeted yield on 3-year bonds unchanged at 0.25% during the latest announcement. In the meantime, the RBA has a dovish view of the Australian economy, which ten underpins the Australian dollar and contributes to the currency pair losses. It should be noted that the RBA confirmed that Unemployment and underemployment are expected to remain high for an extended period. They further added, “Wage and inflation pressures remain very depressed.”

Across the ocean, the currency pair losses got an additional boost after the US Secretary of State Mike Pompeo said Japan’s Prime Minister (PM) Yoshihide Suga is a ‘powerful force for good’, as well as Pompeo further added that he believes Suga will strengthen the relationship with the US. These positive comments tend to underpin the Japanese yen currency and drag the currency pair lower.


Daily Support and Resistance

S1 73.89

S2 74.62

S3 75.05

Pivot Point 75.36

R1 75.78

R2 76.09

R3 76.82

Looking forward, the market traders keeping their eyes on the crude oil supply data from the American Petroleum Institute (API) due later in the day. In the meantime, the updates surrounding the fresh Sino-US tussle, as well as the coronavirus (COVID-19), could not lose their importance.

Entry Price – Sell 75.862

Stop Loss – 76.262

Take Profit – 75.462

Risk to Reward – 1:1

Profit & Loss Per Standard Lot = -$400/ +$400

Profit & Loss Per Micro Lot = -$40/ +$40

Fellas, now you can check out forex trading signals via Forex Academy mobile app. Follow the links below.

iPhone Users: https://apps.apple.com/es/app/fasignals/id1521281368

Andriod Users: https://play.google.com/store/apps/details?id=academy.forex.thesignal&hl=en_US

Categories
Forex Signals

AUD/JPY Heading North to Complete 50% Fibonacci Retracement! 

Today in the early European trading session, the AUD/JPY extended its previous session bullish trend and took further bids around an intraday top closer to 75.10 level, mainly due to the risk-on market sentiment, backed by the on-going optimism over treatment for the highly infectious coronavirus. 

Moreover, the renewed hopes over the U.S. COVID-19 aid package also boosted the market risk tone, underpinning the Australian dollar’s perceived risk currency and contributed to the currency pair gains. Apart from this, the broad-based U.S. dollar selling bias, triggered by the combination of factors, also played its major role in supporting the currency pair. Besides this, the currency pair got an extra boost mainly after the analysts at Citigroup downplayed the possibilities of negative interest rates, which gave further support to the Aussie dollar and contributed to the currency par gains. 

On the contrary, the renewed tension between the US-China over the trade deal keeps challenging the upbeat market mood and becomes the key factor that keeps the lid on any additional currency pair gains. 


The AUD/JPY pair is trading with a bullish bias at 75.45 level on the technical front. Bullish crossover of 75 levels has opened further room for buying until 75.42 level. The closing of the bullish engulfing pattern may drive sharp buying in the AUD/JPY pair; therefore, we have opened a buy trade to target quick 40 pips. Check out a trading plan below… 

Entry Price – Buy 74.892

Stop Loss – 74.92

Take Profit – 75.292

Risk to Reward – 1:1

Profit & Loss Per Standard Lot = -$400/ +$400

Profit & Loss Per Micro Lot = -$40/ +$40

Fellas, now you can check out forex trading signals via Forex Academy mobile app. Follow the links below.

iPhone Users: https://apps.apple.com/es/app/fasignals/id1521281368

Andriod Users: https://play.google.com/store/apps/details?id=academy.forex.thesignal&hl=en_US

Categories
Forex Basic Strategies

Heard Of The ‘Good Morning Asia’ Forex Trading Strategy?

Introduction

In the previous article, we discussed a strategy that was in the European session. However, there are a fair number of traders who prefer the U.S. session as they feel the market tends to be more exciting and thrilling. These traders consider the Asian session to be boring and quiet most of the time.

Many part-time retail traders based in the United States and Europe miss out on opportunities in European and U.S. sessions because of work and other business commitments. The only time they are left with happens to fall in the apparent boring and quiet Asian session. Therefore, it becomes necessary to come out with a strategy that is exclusively meant for the Asia session.

The strategy we will be going to discuss today is suitable for trading during the early-morning Asian hours. This time period has numerous opportunities for traders in different time zones across the world, whether they are part-time or full-time traders. We hope that the strategy will greet everyone like the bright morning sun.

Time Frame

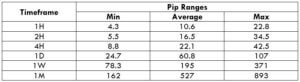
The good-morning Asia strategy works well on the 4-hour time frame. This means each candle represents one day of price movement.

Indicators

This strategy is based on pure price action, and hence no indicators will be used during the process.

Currency Pairs

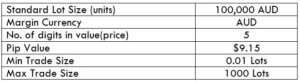
This strategy applies only to the AUD/JPY currency pair.

Strategy Concept

Opening hours of the Asian market begin a couple of hours after the U.S. market closes. The Asian market direction tends to take its cue from the previous day’s movement during the U.S. session because the U.S. market is the largest economy of the world, and most of the institutional banks are located in the U.S.

It is observed that when the U.S. market closes with the bullish sentiment, the Asian market usually starts the day bullish. If the U.S. market closes with the bearish sentiment, the Asian market remains bearish throughout the day.

During the early morning Asian hours, the best currency pair to take advantage of this phenomenon is none other than the AUD/JPY, as the Japanese Yen and the Australian dollar are the most active currency during the Asian session.

Looking at the price action, we take an entry right after the U.S. market closes at 05:00 PM. The first requirement of the strategy is that we need a ‘range’ or a ‘channel’ before the U.S. market closes. Depending on the position of the price and where the candle closes before the U.S., we take an entry. There are many rules that we need to follow before we can use the strategy profitably.

Stop-loss is placed above or below the technical levels, which is the easiest part of the strategy. The risk-to-reward ratio for this strategy is anywhere between 1.5 to 2, which is quite good.

Trade Setup

For this strategy, the closing of the 4-hour candle corresponding to 5:00 PM New York time is crucial for the strategy. Here are the steps to execute the strategy.

Step 1

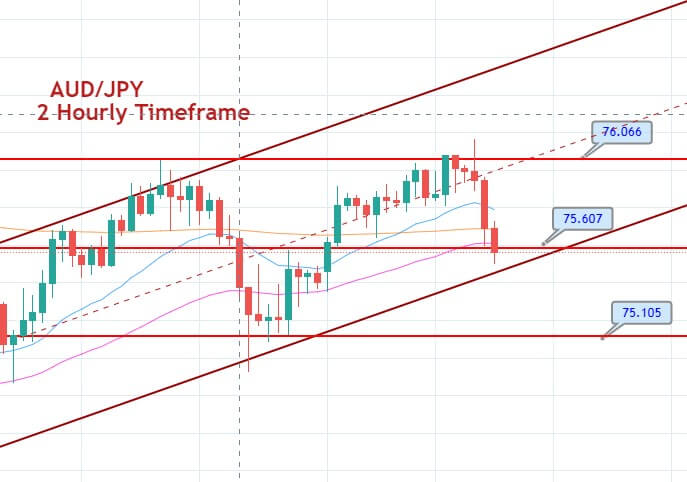
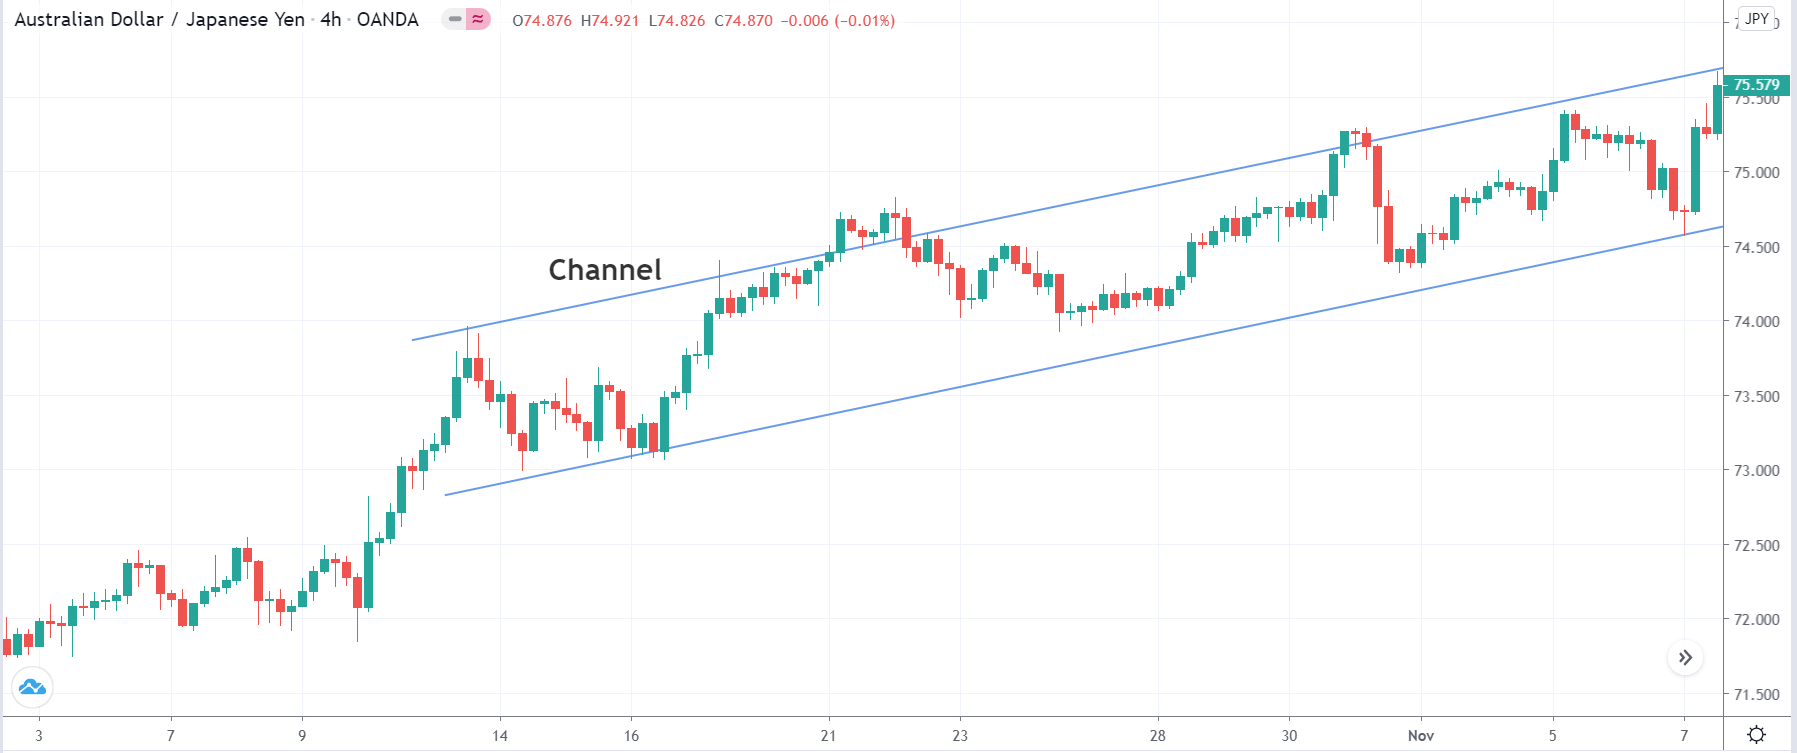
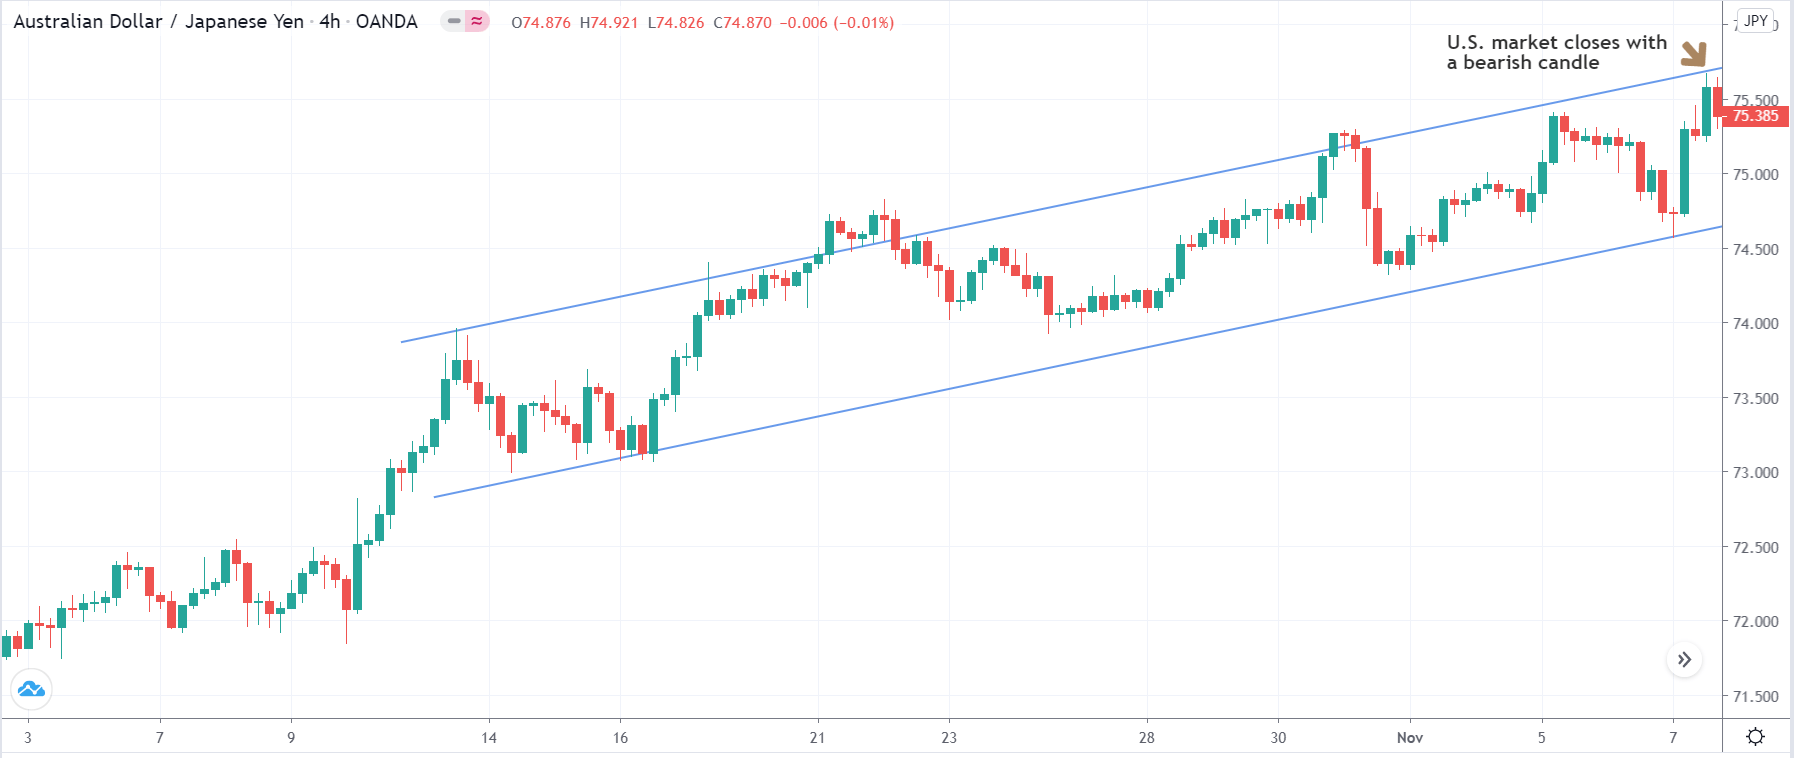
Firstly, we need to identify a ‘range’ or ‘channel’ on the chart of AUD/JPY. This becomes our trading region, where we will be carrying out all the trades. A ‘range’ or ‘channel’ is confirmed only if the price has reacted and reached the other end at least twice after touching the extremes.

We have considered an example of a trade where we will be applying the rules the strategy step by step. The below image shows the 4-hour time frame chart of the AUD/JPY pair, where we identified a ‘channel’ with multiple touches on either side.

Step 2

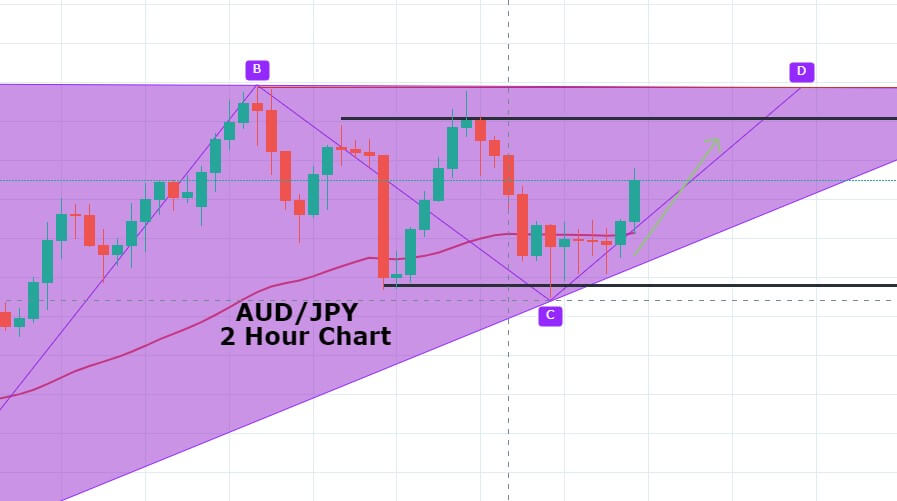
In this step, we need to pay close attention to the position of the price and the closing of the U.S. market. The most important part of the strategy is looking out for the price action taking place at the end of the range, which should be occurring at the close of the U.S. market. Depending on the signal we get from the market, we will take an appropriate currency pair position.

At the close (U.S.) if the price closes as a bullish candle from the support, we will enter for a ‘buy’ at the opening of the subsequent candle. If the price closes as a bearish candle from the resistance, we will enter for a ‘sell’ at the opening of the subsequent candle.
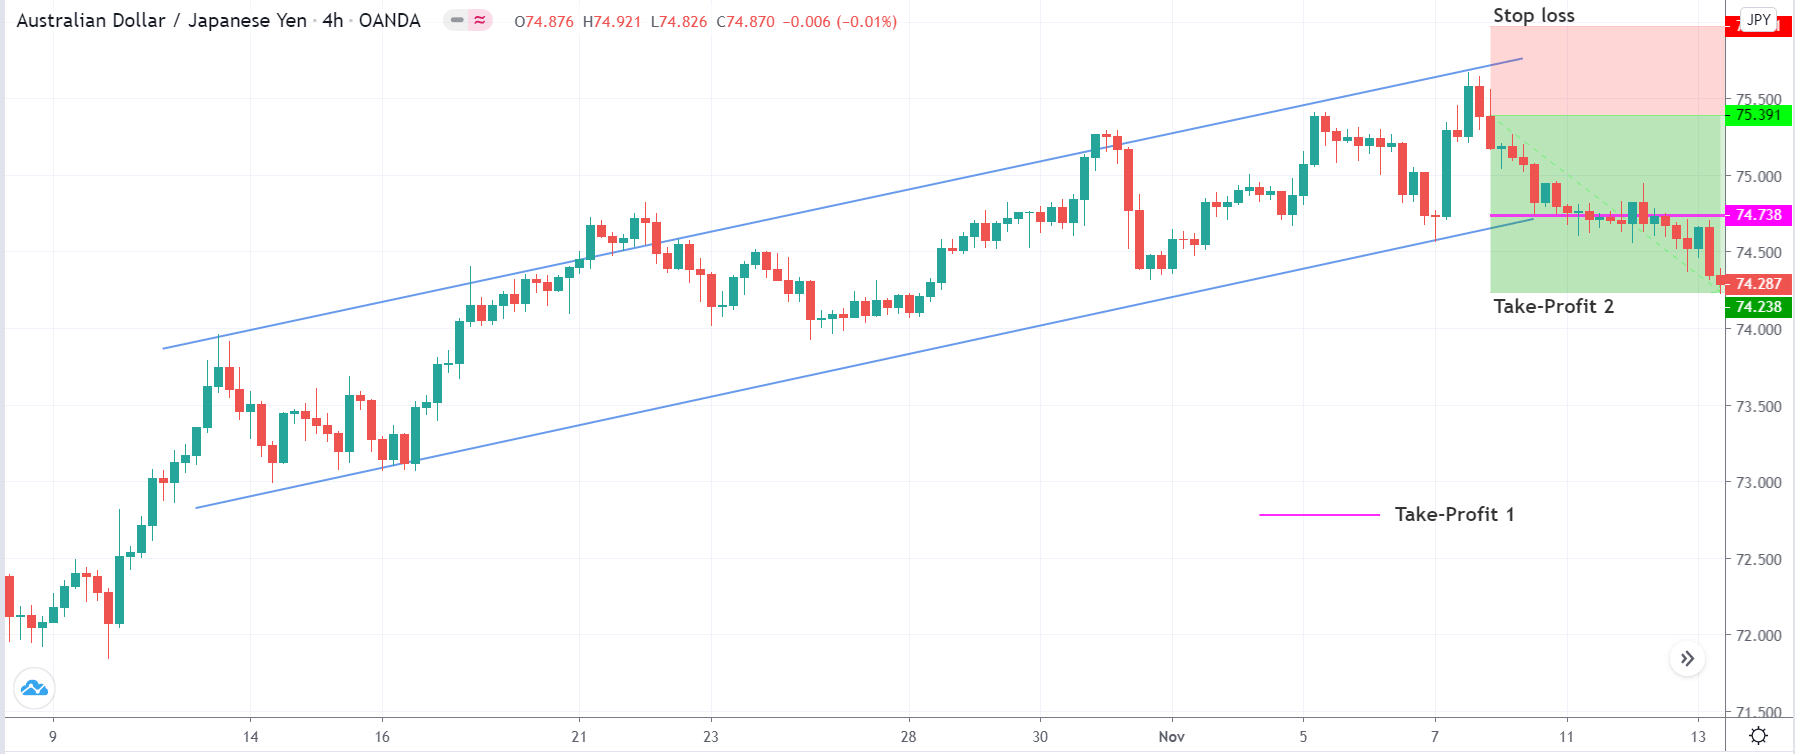
Step 3

In this step, we take an ‘entry’ with a suitable size and determine the stop-loss and take-profit for the trade. As mentioned earlier, we will enter for a ‘buy’ or ‘sell’ right after the U.S. market closes, and the next candle opens. This ensures that the risk to reward will be higher.

The stop-loss for the trade is placed a few pips below or above the key technical level of support or resistance. To increase the risk to reward ratio, we can also place it just above or below the previous candle. This would require some experience of using the strategy over a long time. The ‘take-profit’ is set at the other end of support or resistance. We can have a larger ‘take-profit’ if we are trading with the trend of the market. The ‘take-profit 1’ ensures that we lock in some profits if the trade goes against us.

Strategy Roundup

This strategy is suitable for traders with little time to trade. Furthermore, it does not require complex market analysis. It does have some strict rules which might reduce the creation of the trade setups. The ‘entry’ time of the trade is fixed at every morning. Since Japan and Australia are the first countries in Asia where markets open, there will be ample liquidity in the market that will allow traders to execute ‘long’ and ‘short’ positions very easily. All the best!

Categories
Forex Market Analysis

AUD/JPY Ascending Triangle Pattern – Stronger Aussie Lift the Pair! 

The AUD/JPY pair is flashing green and bounced off the 69.160 support level. The currency pair seems to come out of pressure, which was there on JPY due to the risk-off market sentiment. The wave 2.0 of the coronavirus (COVID-19) is eventually underpinning the safe-haven Japanese yen. 

At the same time, Australia’s Wage Price Index increased by 2.1% year-on-year in the first quarter, as expected, after the previous quarter’s 2.2% surge. The quarterly figure also came in line with the estimate of 0.5%. It should be noted that the data is representing the period before the coronavirus-led lockdown, which was caused by massive job destruction.


Technically, the AUD/JPY pair has formed a bullish engulfing pattern followed by a series of Doji candles above 69.15 support. Continuation of a bullish trend may drive the AUD/JPY prices towards the next resistance area of 70. The pair has also closed an ascending triangle on the 4-hour timeframe which may lead the pair on a higher side. 

Entry Price: Buy at 69.52    

Take Profit .70.12    

Stop Loss 68.92    

Risk/Reward 1

Profit & Loss Per Standard Lot = -$465/ +$465

Profit & Loss Per Micro Lot = -$$46.5/ +$$46.5

Categories
Forex Assets

What Should Know About The AUD/JPY Currency Pair?

Introduction

AUDJPY is the abbreviation for the Australian dollar and the Japanese yen. It commonly referred to as “Aussie yen.” It is one of the cross-currency pairs in the forex market. AUD, being on the left, is termed as the base currency and JPY as the quote currency.

Understanding AUD/JPY

The market price of AUDJPY corresponds to the value of JPY that needs to be paid to buy one AUD. It is quoted as 1 AUD per X JPY. For example, if the value of AUDJPY is 74.571, then these many units of the yen are to be produced to purchase one Australian dollar.

AUD/JPY Specification

Spread

Spread is the medium through which brokers generate their revenue. They set different prices for buying a currency and selling a currency. The difference amount becomes their profit margin. The spread usually changes from time to time and varies on the type of execution model.

ECN: 0.7 | STP: 1.6

Fees

Apart from spreads, one needs to pay a charge for every execution a trader makes. It is essentially the commission levied by the broker on each trade. As a matter of fact, there is no fee on STP accounts. But, on ECN accounts, there is a fee of few pips.

Slippage

Going by the definition, slippage is the difference between the price executed by the trader and the price he actually received. It could be in favor of the trader or against him. It all depends on the broker’s execution speed and the change in the volatility of the market.

Trading Range in AUD/JPY

A trading range is a tabular representation of the minimum, average, and the maximum pip movement in a currency pair on different timeframes. These values help in determining the profit that can be made or loss one must bear in a given time frame. And this can be found out by simply finding the product between the pip movement and the value per pip ($9.15).

Procedure to assess Pip Ranges

  1. Add the ATR indicator to your chart
  2. Set the period to 1
  3. Add a 200-period SMA to this indicator
  4. Shrink the chart so you can determine a large time period
  5. Select your desired timeframe
  6. Measure the floor level and set this value as the min
  7. Measure the level of the 200-period SMA and set this as the average
  8. Measure the peak levels and set this as Max.

AUD/JPY Cost as a Percent of the Trading Range

Cost as a percent of the trading range is an illustration of the cost variation by considering the total cost and the volatility of the market in different timeframes. These values are expressed in a ratio that is converted to percentages. And the magnitude of these percentages helps in determining the cost variation in each trade.

ECN Model Account

Spread = 0.7 | Slippage = 2 |Trading fee = 1

Total cost = Slippage + Spread + Trading Fee = 2 + 0.7 + 1 = 3.7

STP Model Account

Spread = 1.6 | Slippage = 2 | Trading fee = 0

Total cost = Slippage + Spread + Trading Fee = 2 + 1.6 + 0 = 3.6

The Ideal way to trade the AUD/JPY

Though Forex is a 24/7 market, it is not ideal to enter any time in the market. There are certain times when you must enter the market, which can help reduce costs significantly. Let us determine that using the above tables.

Note that the higher the magnitude of the percentage, the higher is the cost of the trade. From the table, it can be ascertained that the values are high in the minimum column, implying that the costs are high when the volatility of the market is low. Similarly, the costs are low when the volatility is high. However, it is not ideal to trade during these times. To ensure optimum volatility and affordable cost, one must trade during those times when the volatility is around the average range.

Furthermore, there is another way through which you can reduce your costs. Trading using limit orders instead of the market orders brings down the total cost significantly, as the slippage becomes zero. The decline in the costs on the trade when slippage is made zero is shown below.

Categories
Forex Market Analysis

Daily Market Update: Easing on Italy’s Politics, CAD Rate Statement, and Possible US Tariffs on EU


News Commentary


The Euro gained on Thursday as Italian parties renewed attempts to form a government, to calm down the concerns about the wider impact of a political crisis in Europe’s third-largest economy.

The two anti-establishment parties have made many efforts to form a coalition government, rather than force Italy into holding elections for the second time this year in September.

The CPI flash estimate enhanced the regains of the Euro after a reading of 1.9% more than the forecast, which was 1.6%, along with the core reading of 1.1% more than the forecast which was 1.0%.

Bank of Canada Governor Stephen Poloz left rates on hold for a third straight decision on Wednesday at 1.25%, but gave a hawkish statement for the economy and removed some cautious language.

The central bank also clarified that recent economic data bolsters its April outlook for a 2% growth in the first half of 2018.

All eyes will be on GDP at 12:30 GMT with the expectation of 0.2% after the last reading of 0.4%. Any higher than expected would reinforce the optimism bias.


Australia reported worse than expected Capex data. Private capital expenditures rose only 0.4% in the first quarter against 1.0% estimated and 0.2% from the fourth quarter of last year.


Negative data came from the US yesterday as ADP Non-Farm Employment Change released lower than expected figures with 178K. Along with prelim GDP which came in at 2.2%, lower than the forecast and the previous reading at 2.3%.


There’s some news that Washington will announce plans to put tariffs on Eurozone steel and aluminium imports, sources said.

They said the announcement was planned for Thursday morning in Washington but that the timing could still change. Commerce Secretary Wilbur Ross told the French daily newspaper, Le Figaro it would be announced either before markets opened or after they closed.

While not confirming for sure that the U.S. would decide to force tariffs, he said: “It’s up to the European Union to decide if it wants to take retaliatory measures. The next question would be: how will the U.S. President Donald Trump react? You saw his reaction when China decided to retaliate.”


Chart Analysis


USD/CAD

On the daily chart, as we expected the price had made its way into the resistance zone of 1.289-1.298, almost reaching the key resistance at 1.309, with an approach from the descending trend line starting from the high of 2015, and the upper edge of the horn pattern.

The price has already bounced beneath the key resistance and the resistance zone, to take the price firstly to the support level at 1.274.


AUD/USD

On the daily chart, the price had a false break beneath the support zone 0.75-0.7535 with a pin bar.

That enhances the AB=CD harmonic pattern, with breaking a descending channel.

The pair rose with an engulfing candle from the support zone.

Along with divergence in RSI, the price is ready for the next move up to 0.774 which is a level with a combination of the lower trend line from the high of 2018 and the broken uptrend.


AUD/JPY

On the daily chart, as we expected, the price reached the resistance zone at 84-84.35.

The price couldn’t break through this area to bounce back.

It reached the support levels at 81.25-80.5 (as we expected also) to pull back up again boosted by the ascending trend from the low of March.

As the pair is currently moving sideways. The price is expected to retest the resistance zone again.


Categories
Forex Market Analysis

Daily Market Update: US- North Korea Summit, Italian Politics, and Negotiations of NAFTA


News Commentary


The news has featured that the U.S.-North Korea summit is back on track. North Korea and the US are starting the preparations for the June 12 summit between Kim Jong-un and Donald Trump.

Separately, Trump contacted the Japanese prime minister, Shinzo Abe. He “affirmed the shared imperative of achieving the complete and permanent dismantlement of North Korea’s nuclear, chemical, and biological weapons and ballistic missile programs,” The White House claimed. And they would meet before the Kim-Trump summit.

Meanwhile, the U.S. 10-Year Treasury Yield fell at the beginning of the week to a six-week low at 2.89%.

Japan’s unemployment rate remained stable at 2.5% but the jobs ratio moved lower from 1.6% to 1.59%.


The political situation in Italy also blocked investor’s risk appetite. Italian President Sergio Mattarella refused to accept the nomination of a euroskeptic finance minister, motivating the anti-establishment Five Star Movement and far-right League party to give up trying to form an administration.


Canadian Foreign Minister Chrystia will fly to Washington to continue the NAFTA negotiations on Tuesday and Wednesday. “we’ve said all along we are ready to go (to Washington) at any time.” Said her spokesman Adam Austen.


Chart Analysis


AUD/USD

On the daily chart, the price had a false break beneath the support zone 0.75-0.7535.

That enhances the AB=CD harmonic pattern, with breaking a descending channel.

The pair had risen with an engulfing candle and pulled back with a hammer, one touching the support zone again.

Along with divergence in RSI, the price is ready for the next move up to 0.774 which is a level with a combination of the lower trend line from the high of 2018 & the broken uptrend.


USD/JPY

The price has reversed from a very strong short-selling area, rebounding from the key resistance level at 111.1 and the lower trend line from the high of 2015, also reversing from the top edge of the upward channel along with forming an AB=CD harmonic pattern with overbought on RSI.

The price has broken the key support level 110.05 along with the ascending channel.

So, the price is supposed to revisit the support level at 108.15.


AUD/JPY

On the daily chart, as we expected, the price reached the resistance zone at 84-84.35 affected by shaping a head & shoulders reversal pattern.

The price couldn’t break through this area to bounce back.

It could reach the support levels at 81.25-80.5 to pull back up again, as the pair is currently moving sideways.


USD/CAD

On the daily chart, the price had made its way into the resistance zone of 1.289-1.298, also reaching near the key resistance at 1.309.

With an approach from the descending trend line starting from the high of 2015 and the upper edge of the horn pattern.

If the daily candle closes beneath this zone again with suitable price action, it will prompt the price to be bearish to the support zone 1.2525-1.2415.