
In today’s article, we are going to demonstrate an example of a daily–H4 combination trade setup. On a strong bullish market, the daily chart produces a bearish reversal candle and offers a beautiful short entry for the sellers, the price gets exceptionally bearish, and it may remain bearish for a long time. Let us get started.

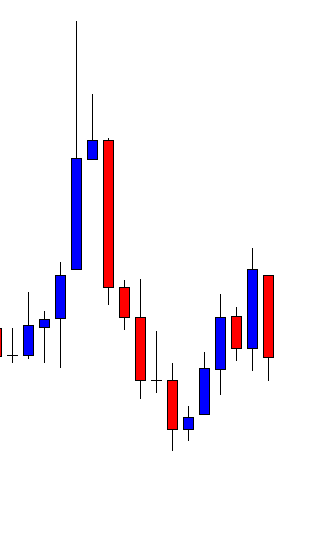
Look at the last candle, which closes as a bearish marubozu candle. Before that candle, the pair heads towards the North with strong bullish momentum. At some point, a bullish engulfing candle engulfs an inside bar bearish candle. This is an extremely good signal for the daily chart’s buyers to go long on the pair. Many daily buyers might have lost money here. However, the next candle (the last candle on this chart) changes the equation for daily-H4 combination traders. It is now time for them to flip over to the H4 chart.
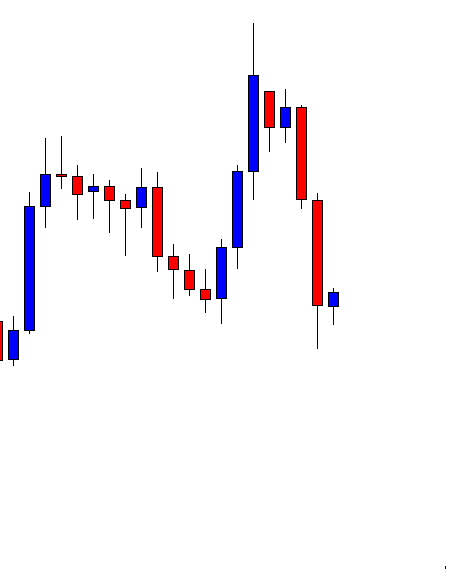
This is how the H4 chart looks after flipping over. The price starts having consolidation, as well. A bearish engulfing candle closing below the lowest low is the signal for the sellers to trigger a short entry.
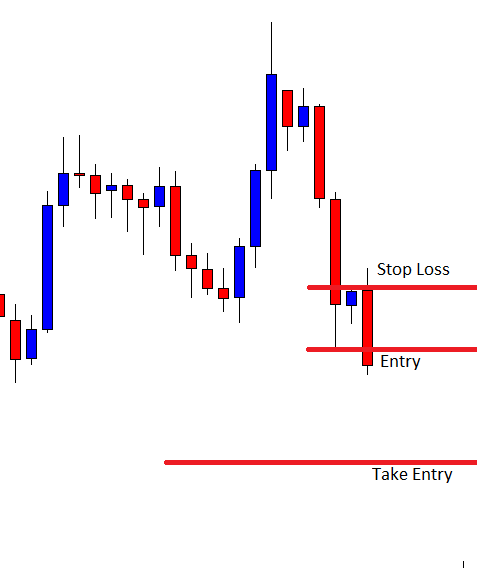
The next candle comes out as a bearish engulfing candle closing well below the lowest low of the bearish wave. The sellers may trigger a short entry right after the candle closes by setting stop-loss above the level of resistance (with some safety pips) and by setting take profit with 1:1 risk-reward.
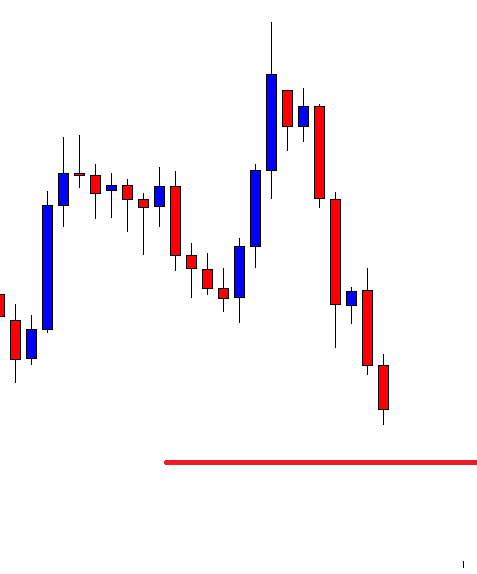
As expected, the price heads towards the North with good bearish momentum. It seems that the price is in a hurry to hit the target. It may hit the target within the next candle. Let us find out what it does.
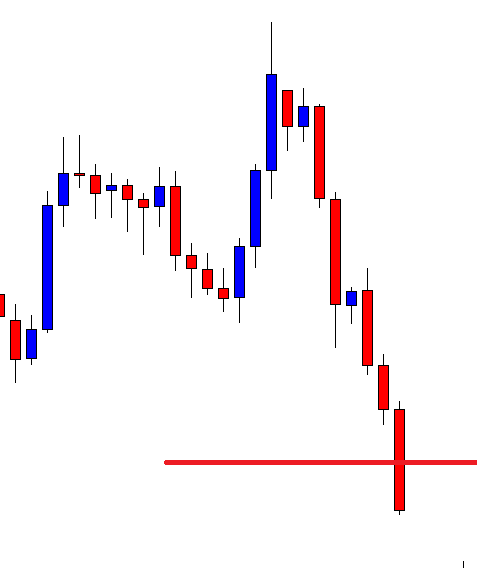
The price hits the target. The last candle comes out as a very strong bearish candle, which suggests that the price may head towards the North further. However, 1:1 risk-reward is achieved. This is what the first target as far as daily-H4 combination trading is concerned. Considering the last candle’s attributes, the price may produce at least one more bearish wave in this chart. Anyway, we have a lesson to learn from here. We are to wait for the daily chart to produce a strong reversal candle. It does not matter how strong the trend has been. As long as we get a strong bearish reversal daily candle, our job first job is to flip over to the H4 chart. We must wait for the H4 consolidation and the signal candle closing below the highest high/lowest low of the last wave to trigger entry.