Support/Resistance levels are one of the most important factors in trading. In today’s lesson, we are going to demonstrate an example of adjustment in determining the support/resistance level.
Forex market gets volatile from time to time. It often produces spikes. Sometimes traders have to count those spikes to determine support/resistance level, and sometimes they do not have to do that. We try to learn when we have to count, and when we do not have to count those.
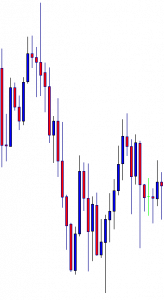
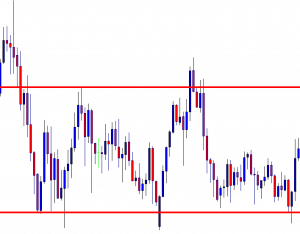
This is an H1 chart. However, any chart may look like this. If we are to draw support/resistance levels here, we may find out the two most significant points where the price bounces and where it gets a rejection from. Let us proceed to the next chart with those two lines.
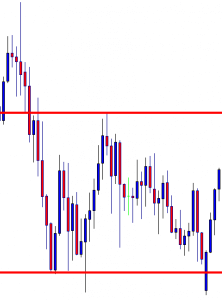
Look at the level of drawn support. The price bounces at the level and produces a bullish inside bar. It comes back at the level and bounces twice. At the second bounce, it produces a long lower shadow and heads towards the North. We may skip counting the spike here and draw the level of support at where the price produces a bullish inside bar and bounces twice later.
Look at the level of resistance. This is where we have counted spikes since the price reacts at the level earlier. However, we may have to adjust it later. We will be able to find this out later as far as price action is concerned.
When the price comes back down, it breaches the level of support and produces a good bullish candle. However, there is a gap, and the price goes back within the previous level of support. Thus, we may still consider the drawn level as a significant level of support.
The price heads towards the North and breaches the level of drawn resistance. The price comes back within the drawn level again. The drawn level is still a significant level of resistance since the price reacts to it. However, we have a new highest high, which must be counted.
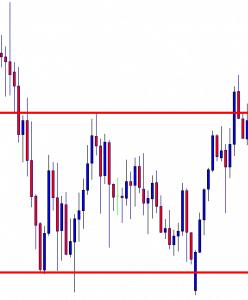
The price heads towards the South and reacts to the level of drawn support again. Upon producing a bullish inside bar, it heads towards the North again. Here are two questions.
- Where would you set your take profit level as a buyer?
- Do you have anything else to do here?
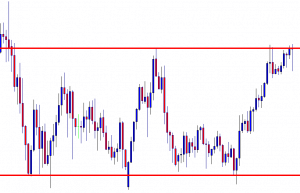
As a buyer, you may consider taking your profit at the previously drawn level. Here we have drawn the level of resistance with a little adjustment. Have you noticed it? Yes, this is what you have to do. Spotting out significant points and monitoring price action around them are two most important things to be able to make adjustments with the support/resistance level. To be able to trade accordingly, we often need to do this. Thus, we must learn the art of adjusting the support/resistance level.