Trading on the daily chart is very rewarding as well as hassle-free comparing to intraday trading. Trade management is different since it allows enough time for the traders to make a decision about their positions. This often allows the traders to earn more pips. In today’s article, we are going to demonstrate an example of price action trading on the daily chart, which allows the traders to hunt some extra pips. We find out how traders do it.

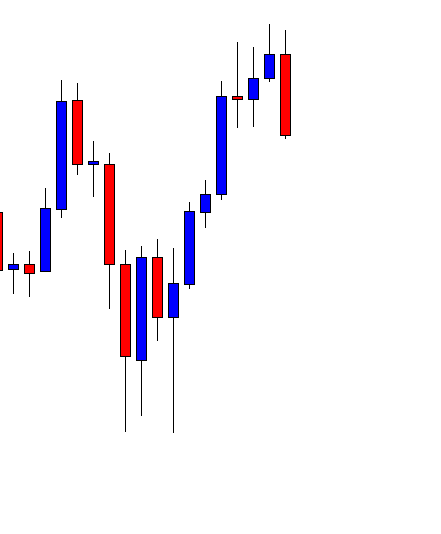
This is a daily chart. It shows that after being bullish for seven trading days, it produces a bearish engulfing candle. The Bearish engulfing pattern is one of the strongest bearish reversal patterns. The sellers are to wait for the price to consolidate and give them a level of resistance where they set Stop Loss above to ensure better risk-reward.
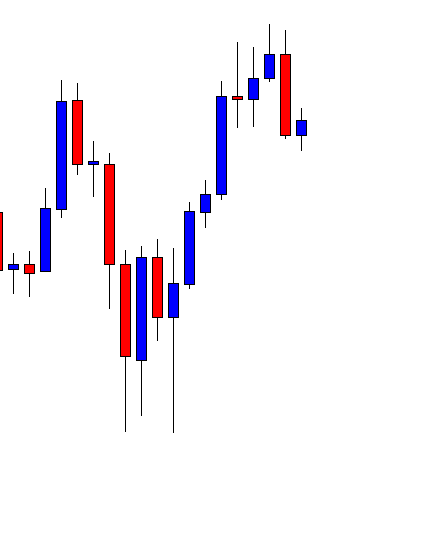
This is what the sellers want to see. The chart produces a bullish inside bar, which states that the sellers may take over the control upon getting another bearish engulfing candle closing below the level of support.
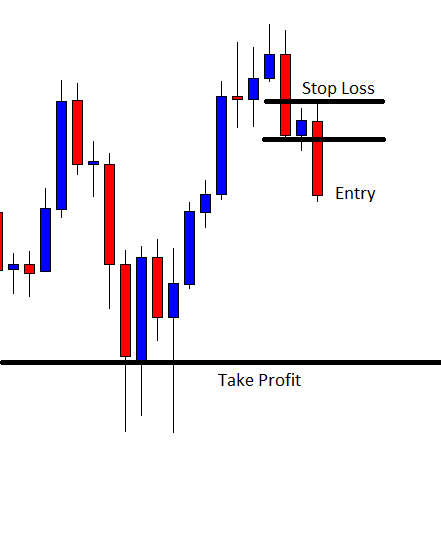
Look at the last candle. It comes out as a bearish engulfing candle closing below the level of consolidation support. The sellers may trigger a short entry right after the candle closes by setting the stop loss above the highest high of the signal candle. To set take profit, some traders may close the trade manually upon getting a bullish reversal candle; some may set at 1:1 risk-reward; some may set at the last significant lowest low. It depends on traders’ psychology and with the strategy (in terms of taking profit) they feel comfortable with.
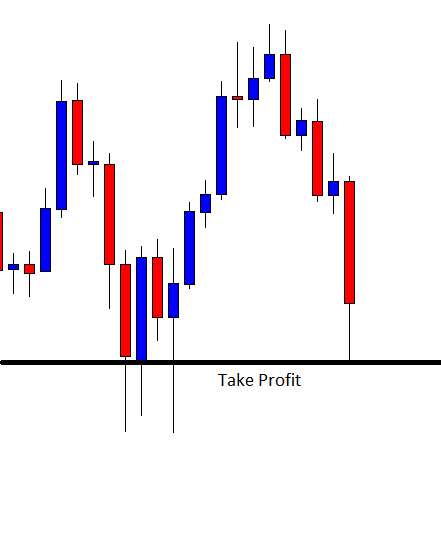
The price consolidates with one more candle after triggering the entry. However, the price hits the target, which is set at the level of the significant lowest low. As mentioned, some traders may keep holding the position since the price is still with the bear. Let us proceed to the next chart and find out what the price does in the next candle.

It makes a breakout as well. The sellers holding the position may dream big. It seems the price may keep heading towards the South further. This is the good thing about trading on the daily chart. Traders get enough time to decide about their positions. They get 1:1 risk-reward in almost every trade. If they understand daily price action well and get well acquainted with daily trading, it usually gets them very lucrative risk-reward. Imagine, if traders want to manage trade like this on the H4 or the H1 chart, how painful it could be. Moreover, the H4 or the H1 chart is not as consistent as the daily chart. In our fore coming articles, we will demonstrate more examples of how we can maximize our profit by trading on the daily chart. Stay tuned.