Usually, the Forex market gets sluggish in December. It gets tough for traders to find out a good entry on major charts as far as price action is concerned. However, the H4-H1 chart combination still offers a few entries. In today’s lesson, we are going to demonstrate an example of an entry based on the H4-H1 chart, which was offered in mid-December 2019.
Let us proceed.
We’re looking at the H4 chart. The last candle makes a strong breakout at the last swing low. Traders are to wait for consolidation and H1 breakout to go short on the pair. Let us find out whether it starts consolidating from right there or comes further down.
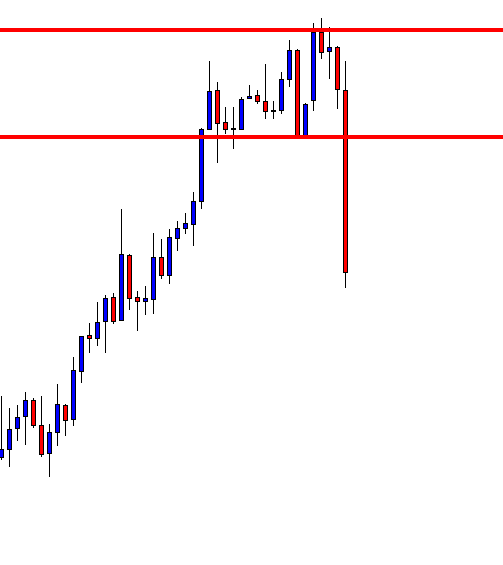
It comes down further for one more candle. It means traders are to wait longer. However, the nearest support is far enough. Thus, the price has a lot of space to travel towards the South.
The price starts consolidating and produces two bullish candles consecutively. The pair is to make a big decision from here. Does it continue its journey towards the North, or does it find its resistance nearby? Let us find out from the next chart.
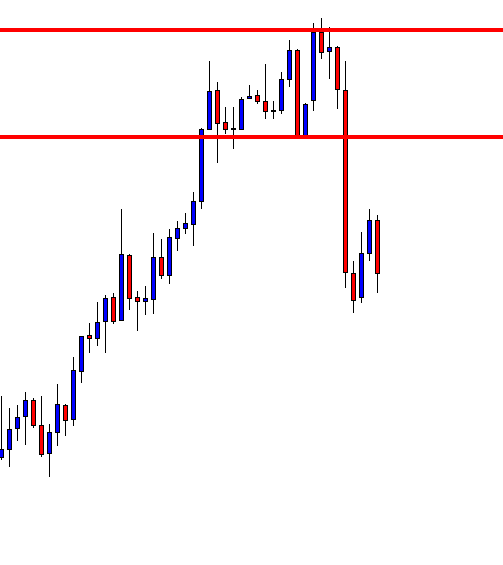
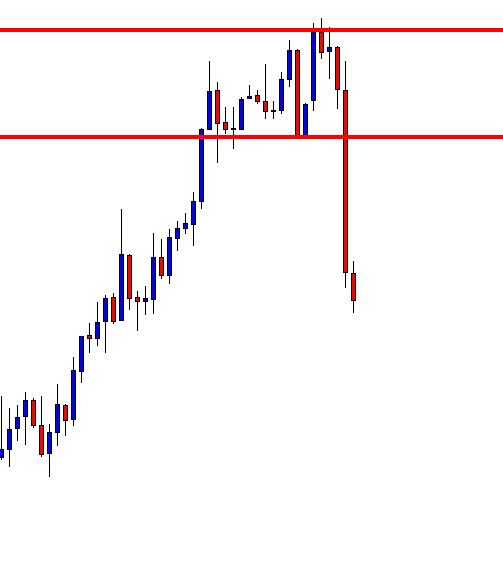
The price finds its resistance and produces a bearish engulfing candle. The sellers have been waiting for this. It is time for the traders to flip over to the H1 chart and wait for an H1 bearish breakout to take a short entry. Let us find out how the H1 chart looks.
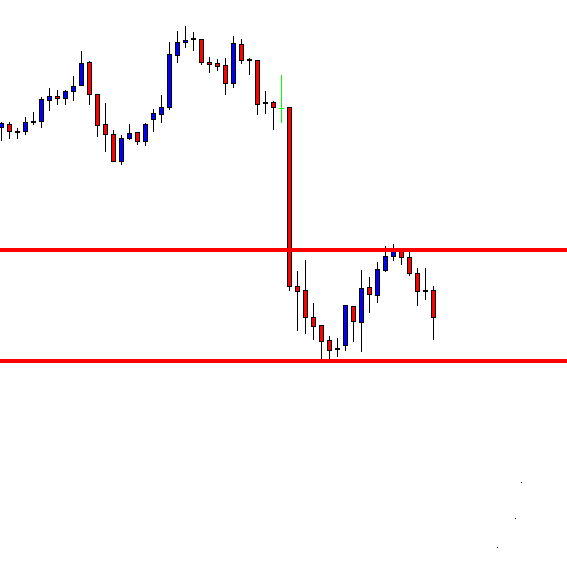
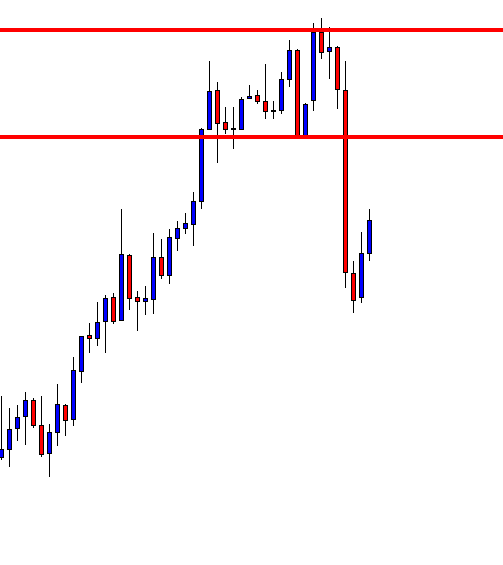
The H1 chart shows that the price produces an engulfing bearish candle and heads towards the South. The price on this chart makes a breakout at the red marked support level. It may make the traders wait for, or it may make a breakout straightway. Let us what the price does here.
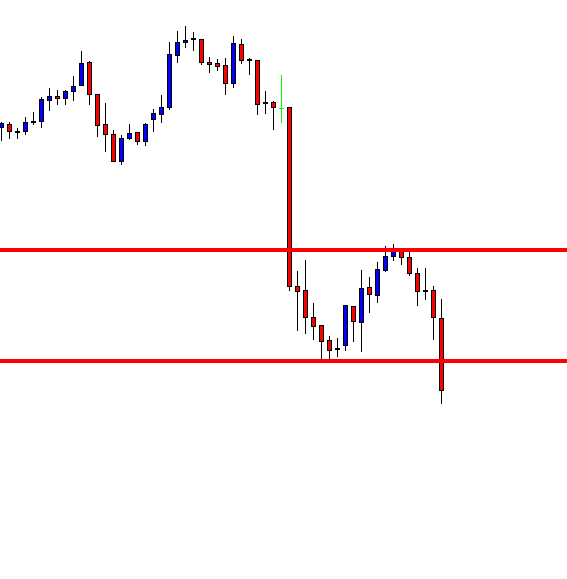
The price makes an explicit bearish breakout. The breakout candle looks very strong, barely having a lower shadow. A short entry may be triggered right after the candle closes by setting Stop Loss above the level where the H4 chart produces the bearish reversal candle. Let us now find out how it ends.
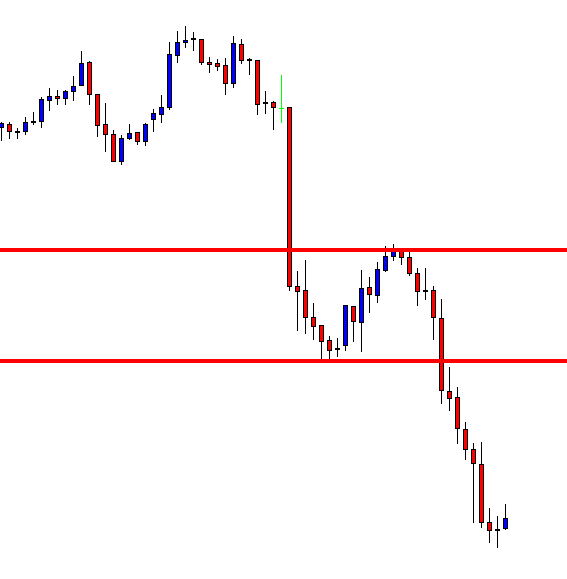
The price heads towards the South with good bearish momentum. It produces a bullish engulfing candle having a long upper shadow. It may be time for the sellers to close the whole entry since it is the month of December.
As mentioned, in December, traders do not get as many entries as they usually get. However, the H4-H1 chart combination may offer a few entries occasionally even when the market gets sluggish.