
The H1 chart is one of the most traded charts in the Forex market. This is a very consistent chart considering other intraday charts. In today’s article, we are going to learn a strategy to trade on the H1 chart in the Forex market.

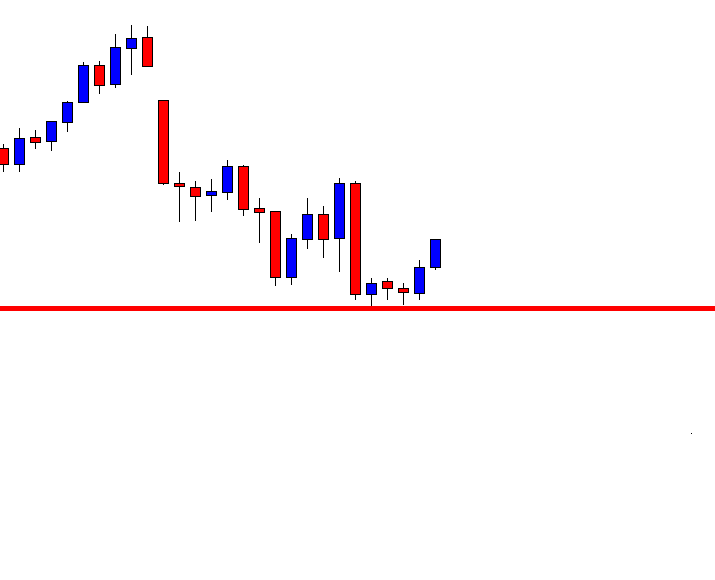
This is an H1 chart. The price after making a bearish move seems to have found its support. It produces two consecutive bullish candles. The buyers are to wait for the price to consolidate and create a bullish breakout to go long. On the other hand, the sellers are to wait for a bearish reversal candle and make a bearish breakout to go short on the pair. Let us find out what the price does next.

The chart produces a bearish engulfing candle, which is the strongest bearish reversal candle. The sellers have the upper hand here. A breakout at the level of support is the next thing to take a short entry here.
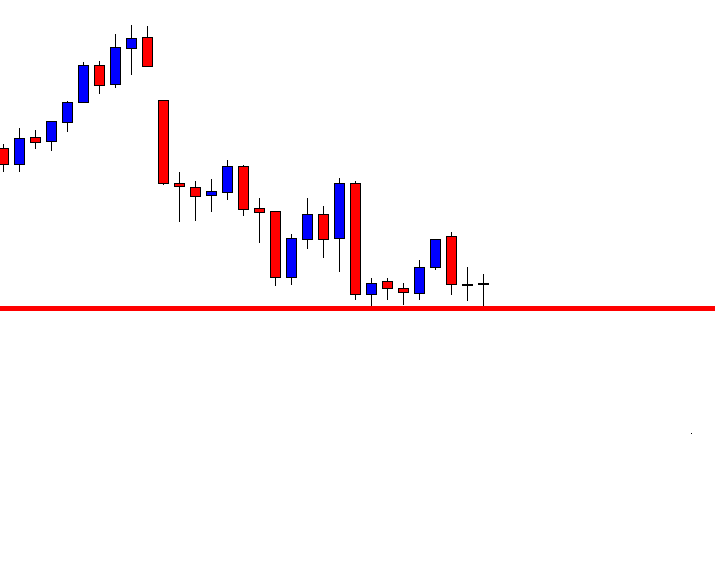
The price consolidates around the level of support. The level of support becomes double bottom support. A strong battle is going on between the buyers and the sellers. Traders must wait to find the next direction.
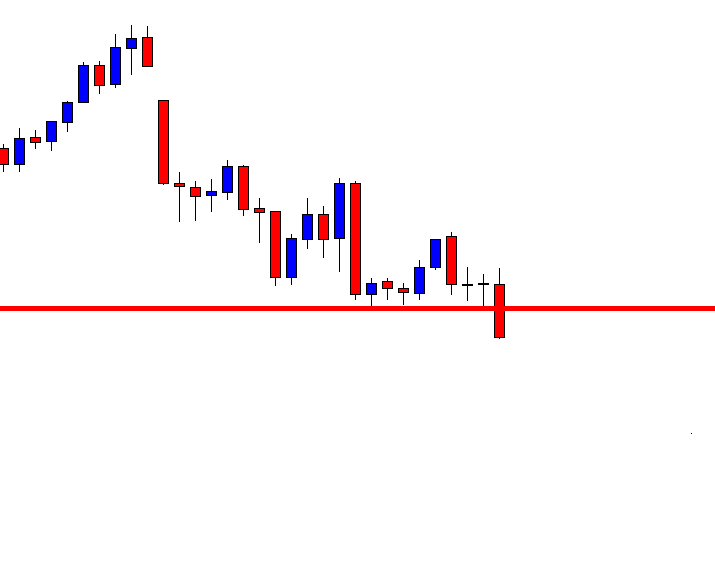
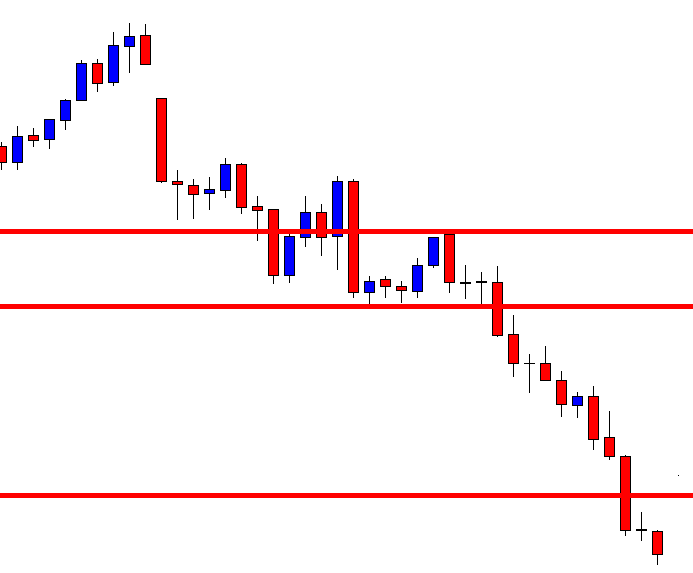
It makes an explicit bearish breakout. Admittedly, the sellers have outplayed the buyers. Traders shall get themselves ready to go short on the pair. The question is why they have to get themselves ready. Should not they trigger any entry right after the last candle closes? The answer is no. They must wait for the next candle to close below the breakout candle. This is the trickiest part of this strategy. Traders must wait for one more candle to make a new lower low (in a bearish market).
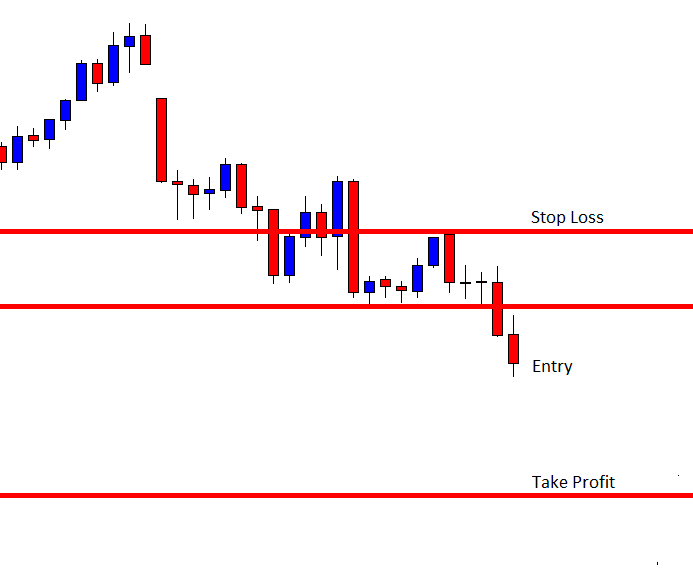
Here it comes. The next candle comes out as a bearish candle closing well below the breakout candle. An entry may be triggered right after the last candle closes. The stop loss level is easy to be found out. It is above the level where the trend initiates. We see that a red marked take profit level as well. However, the chart does not show that it is a significant level. How do we find this out then? We may set our take profit exactly with a 1:1 risk-reward ratio. It means the length of entry to stop loss equals to the length of entry to take profit in this strategy. Let us find out how the trade goes.
The trade goes well. We will demonstrate more examples of this strategy soon. Meanwhile, let us concentrate on the things to remember.
- The trend initiation candle is to be a strong reversal candle.
- The breakout is to be very explicit.
- The very next candle is to close below (in a bearish market) or close above (in a bullish market).
- Take Profit is to be set with no more than 1:1 risk-reward.