Categories
Forex Daily Topic Forex Price-Action Strategies

H1 Breakout Trading: Keep Holding Your Positions

Price action traders are to maintain discipline with their entry and trade management. As far as trade management is concerned, it varies on time frames. Trade management on the H4 chart and the H1 chart is different. A reversal candle on an H4 chart has more potential to change the existent trend. Thus, traders may need to think about an early exit. On the other hand, H1 breakout traders may keep holding their positions until it reaches the target. In today’s lesson, we are going to demonstrate an example of this.

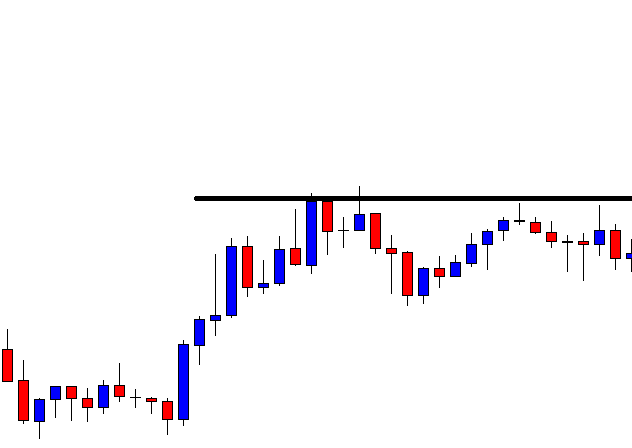
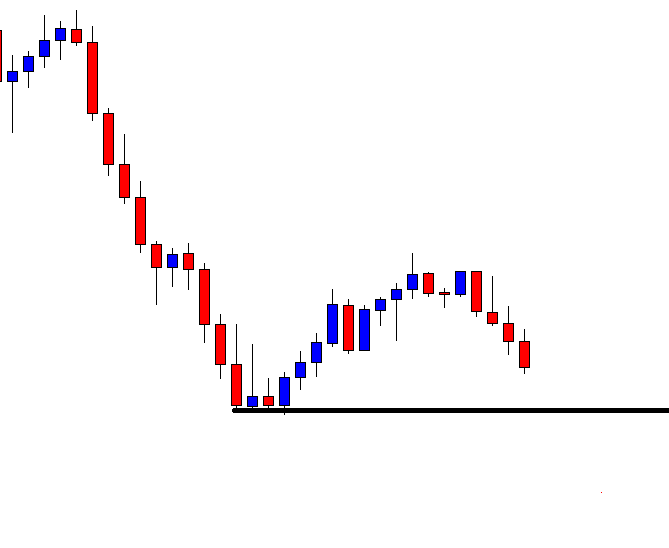
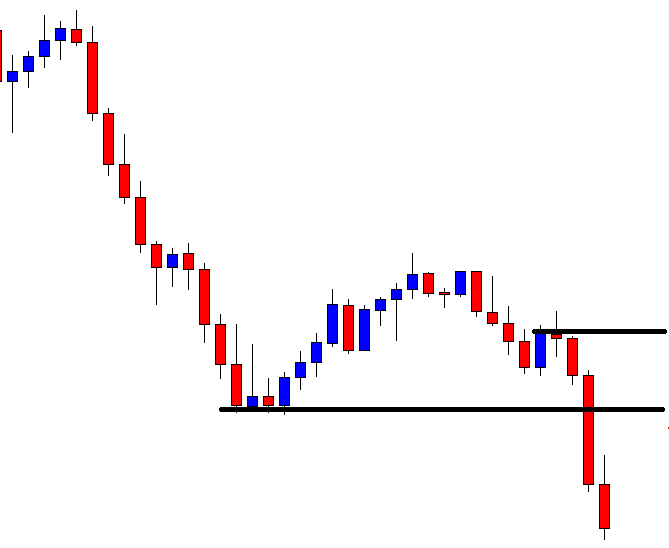
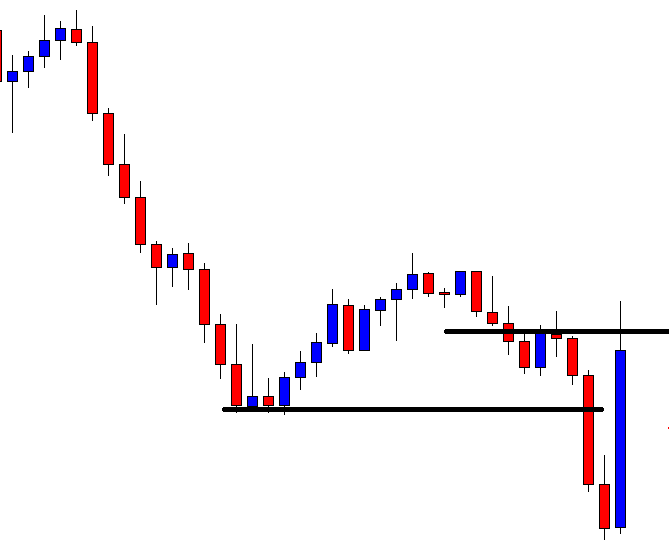
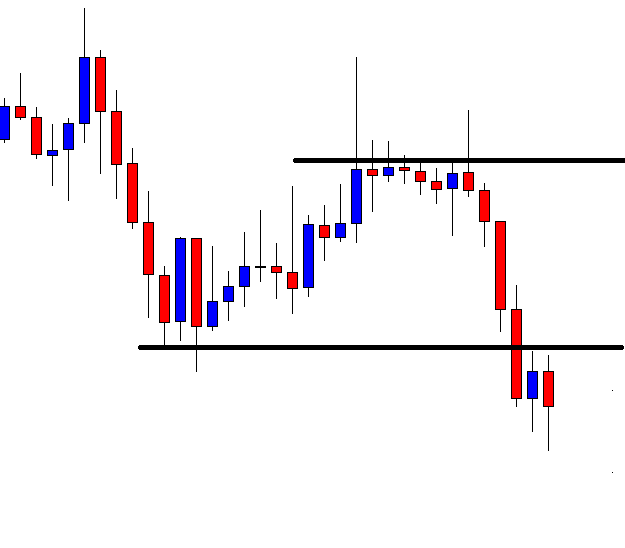
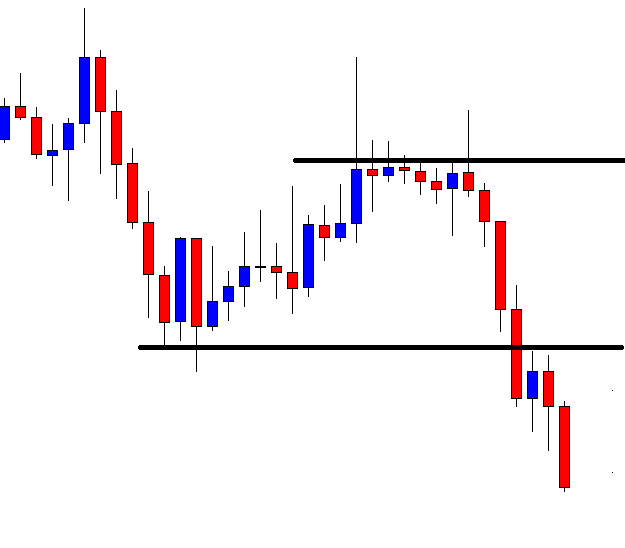
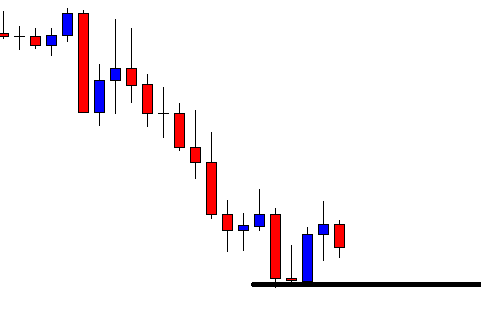
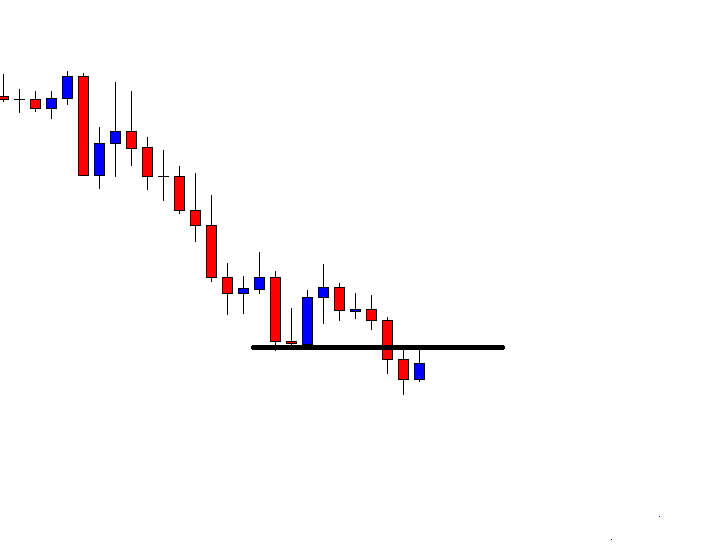
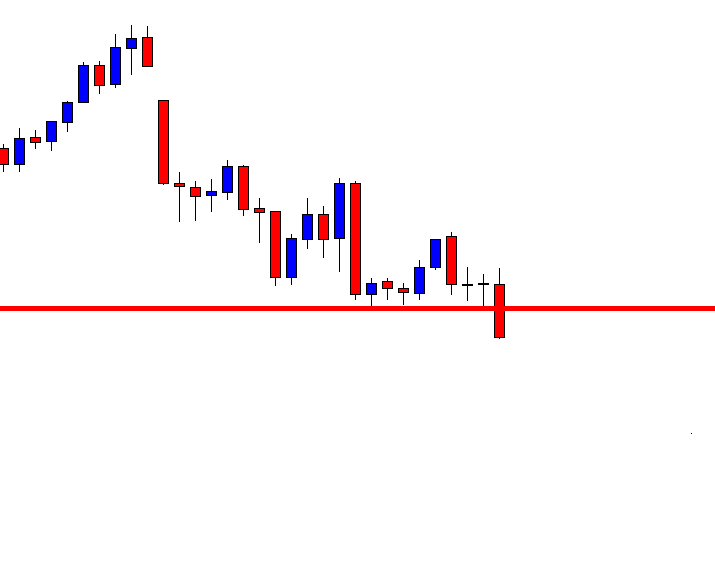
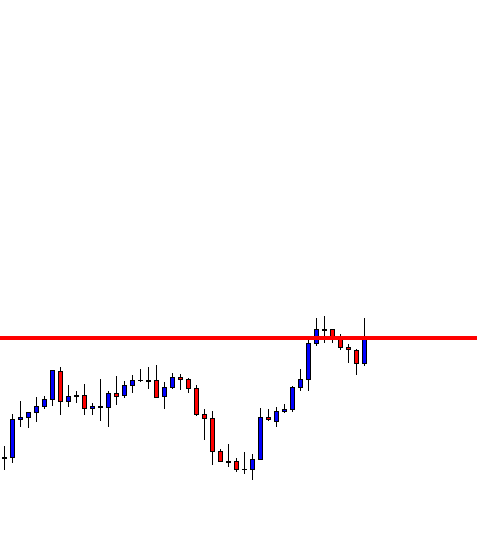
The chart shows that the price after being bullish has rejections at a level of resistance. The price heads towards the North but does not make any breakout. It has been in the bearish correction again. Let us see whether it finds its support and makes a bullish breakout or not.

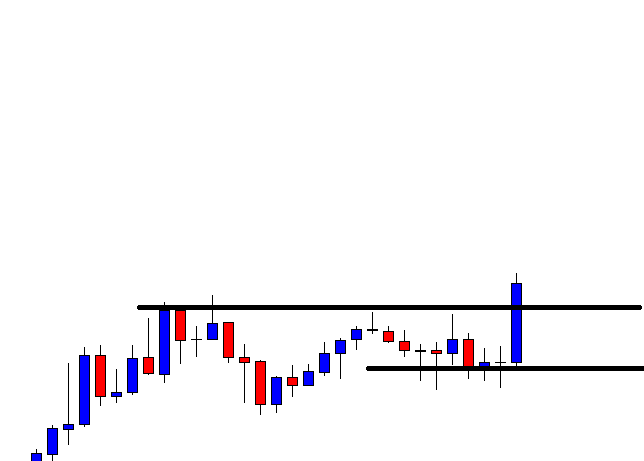
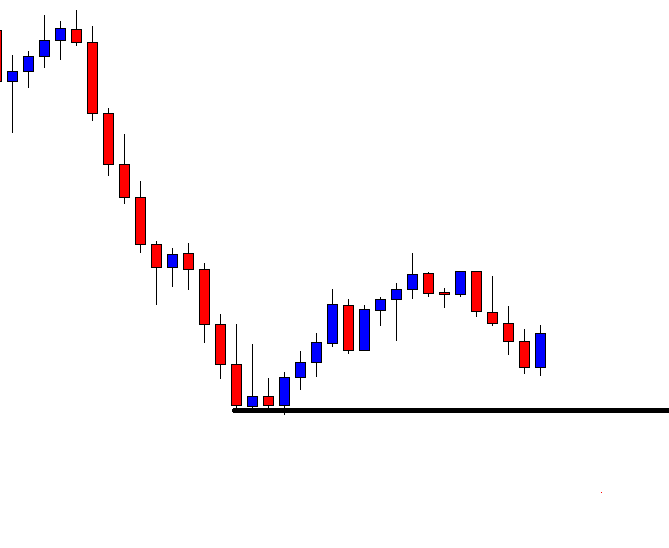
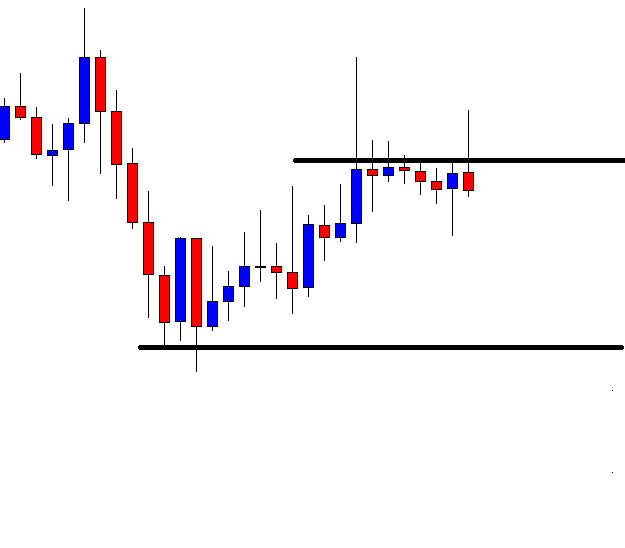
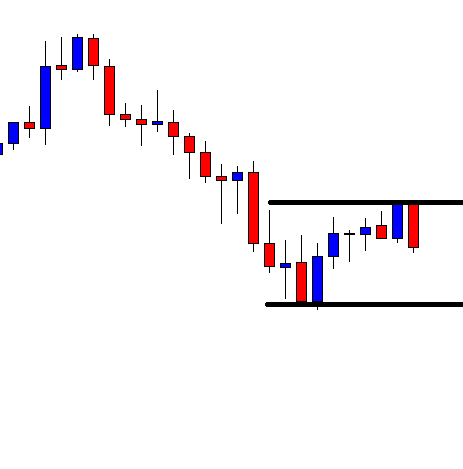
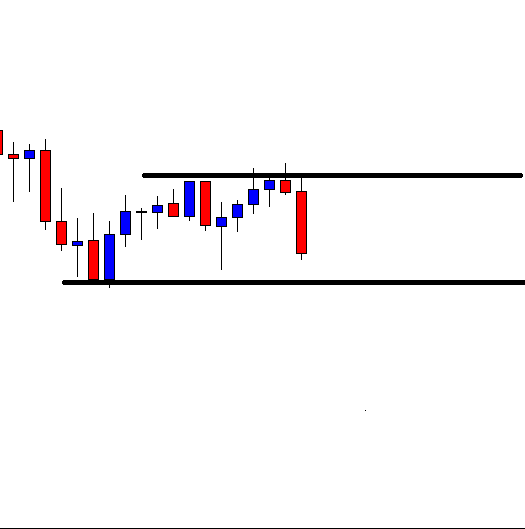
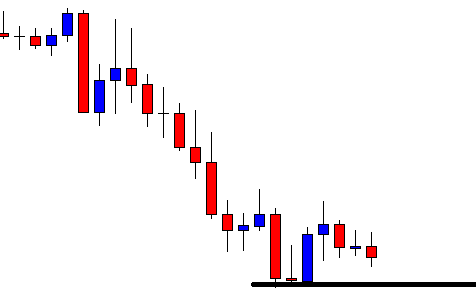
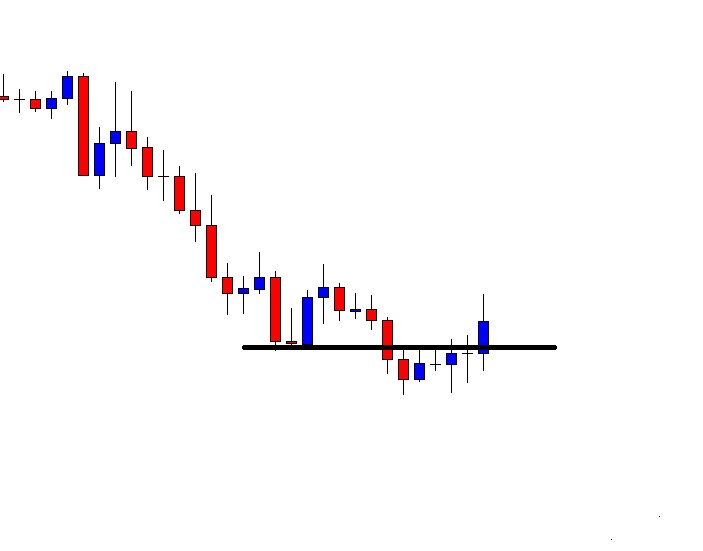
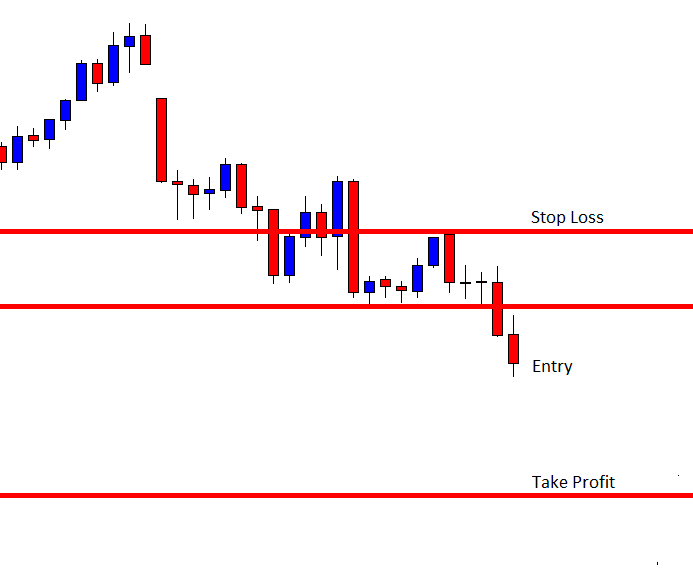
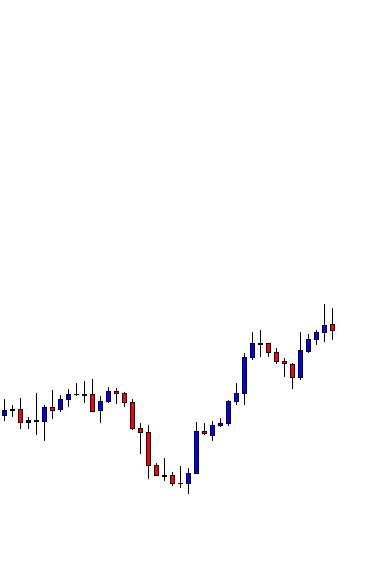
Here it comes. The price finds its support and produces a bullish engulfing candle breaching the level of resistance. This is an A+ breakout candle. The buyers are to wait for the next candle to close above the breakout candle to trigger a long entry.

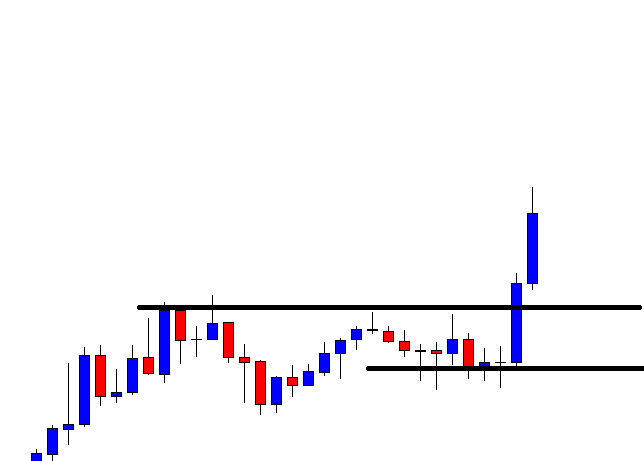
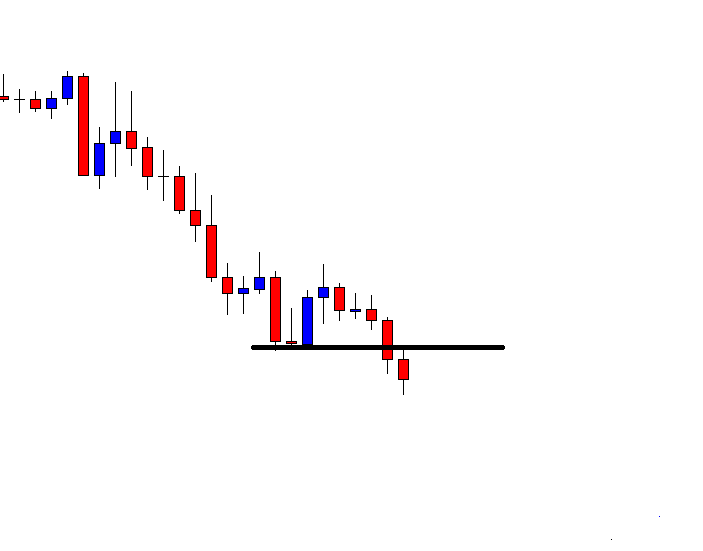
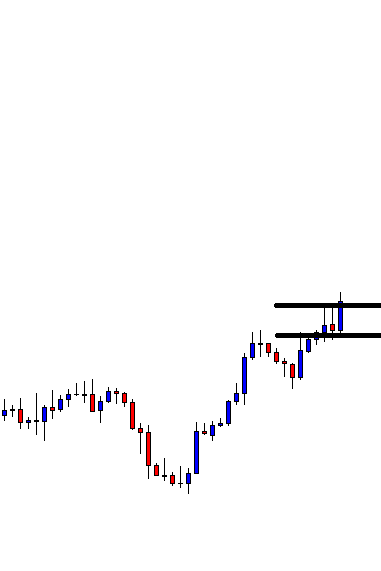
The next candle comes out as a bullish candle as well. It has an upper shadow, but the last 15 candle comes out as a bullish candle. The buyers may trigger a long entry right after the last candle closes by setting stop loss below the support level and take profit with 1R.

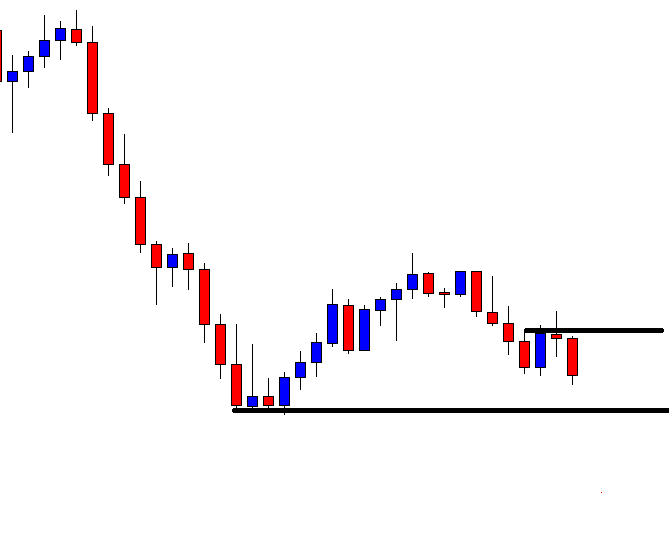
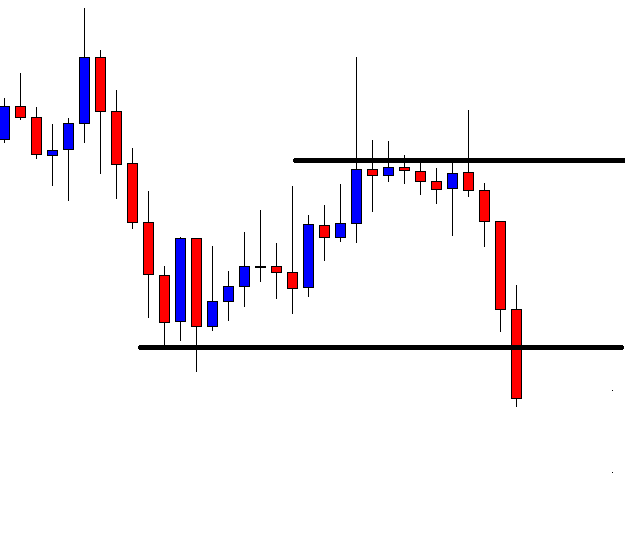
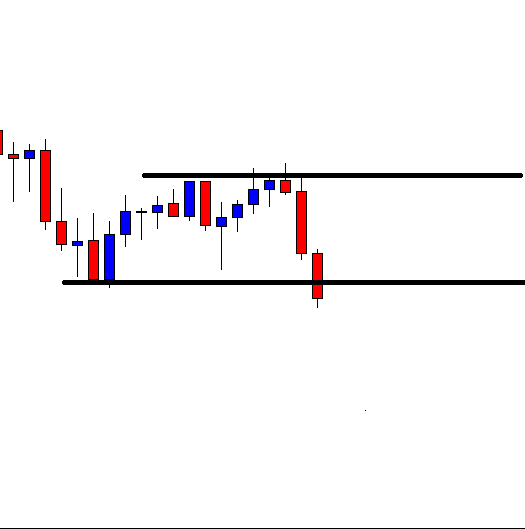
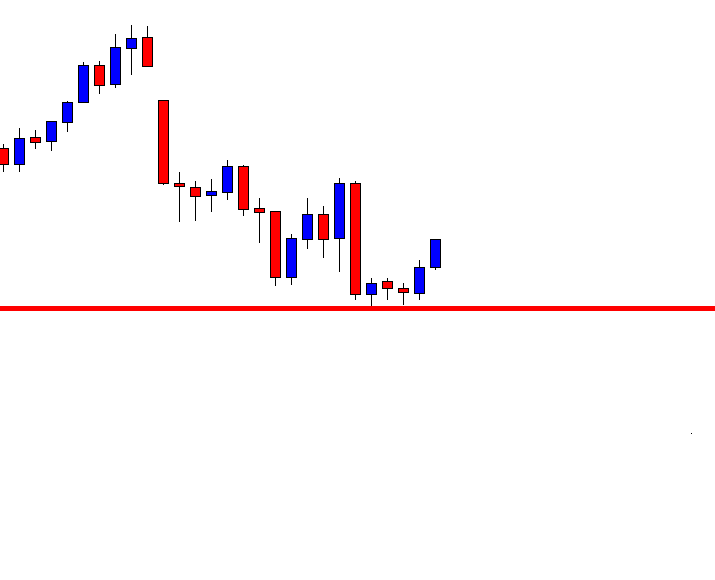
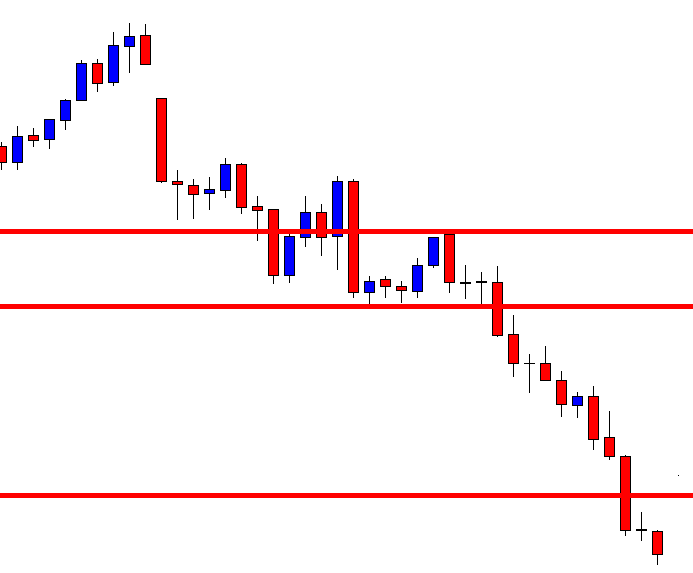
The price heads towards the North. However, it seems that the price does not head towards the target with good bullish momentum. Moreover, the last candle comes out as a bearish engulfing candle. This is ominous for the buyers. Do not forget this is an H1 chart, and the buyers are not supposed to take an early exit. They should keep holding their position and wait for the price to do the rest.

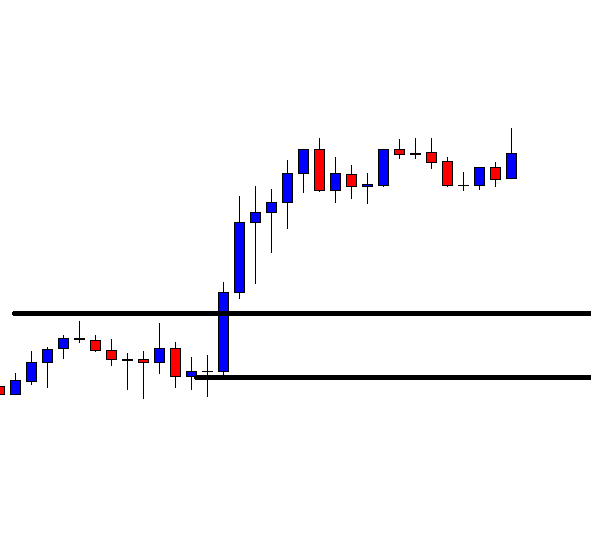
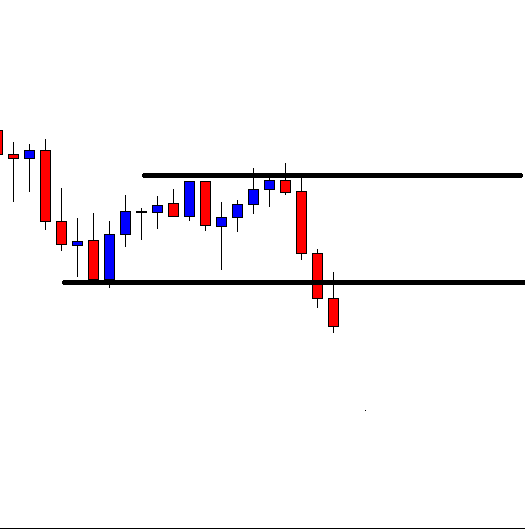
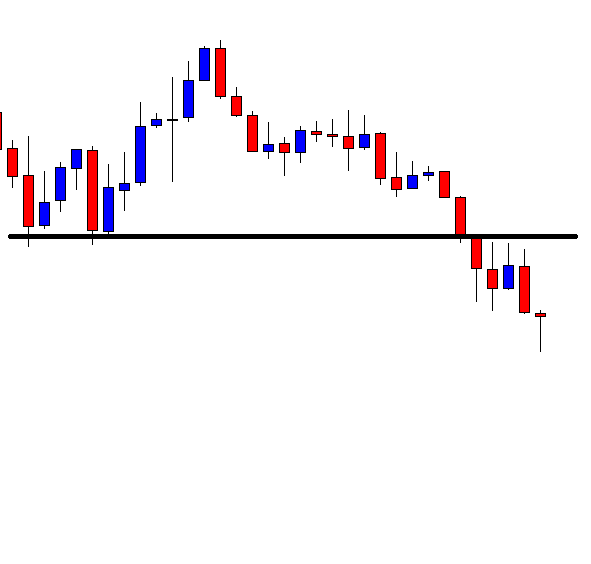
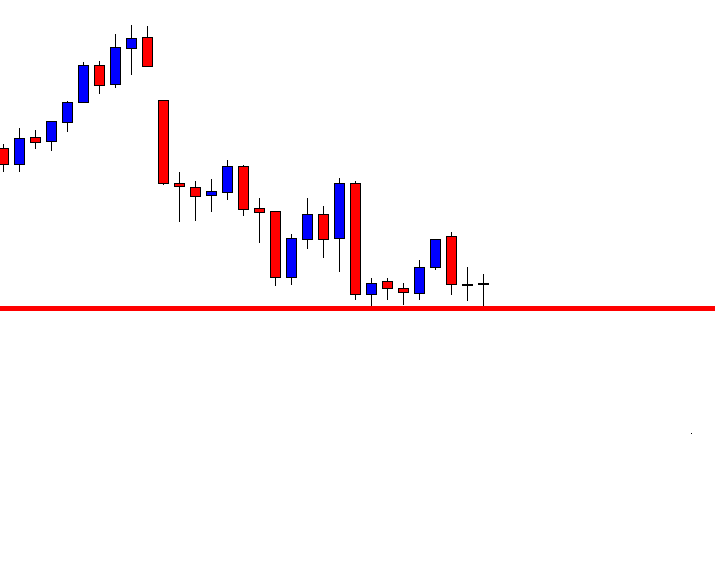
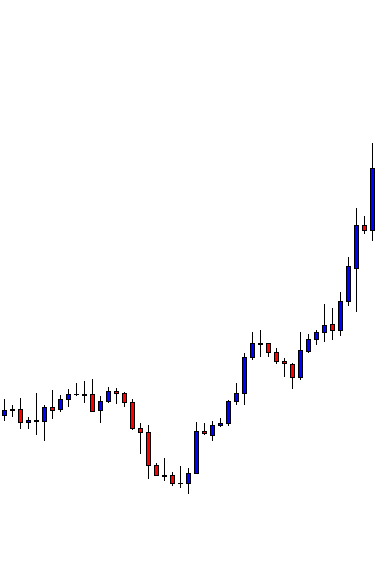
The price gets rather choppy. It has been testing traders’ patience. It is hard to keep holding positions. However, traders must not keep looking at the chart. Meanwhile, they might as well concentrate on other charts to find out potential entries.

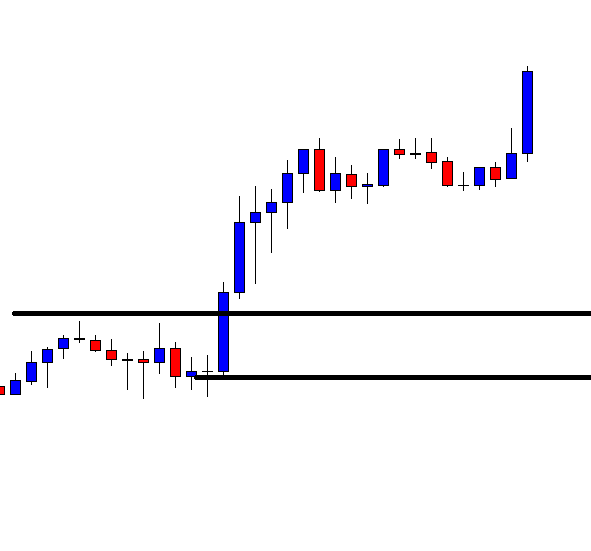
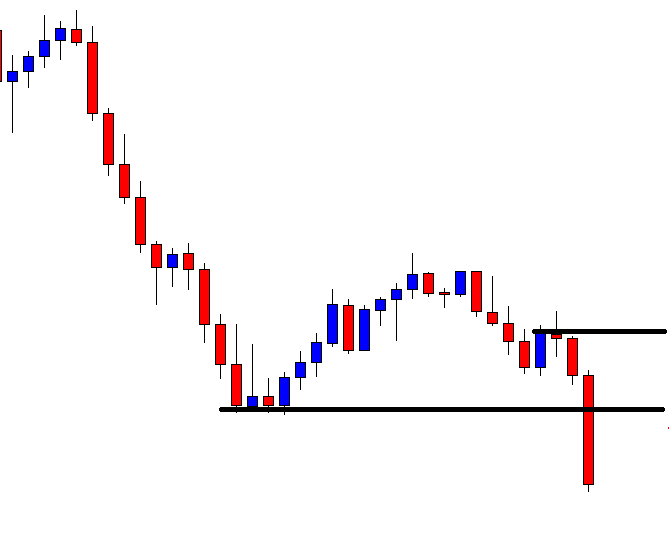
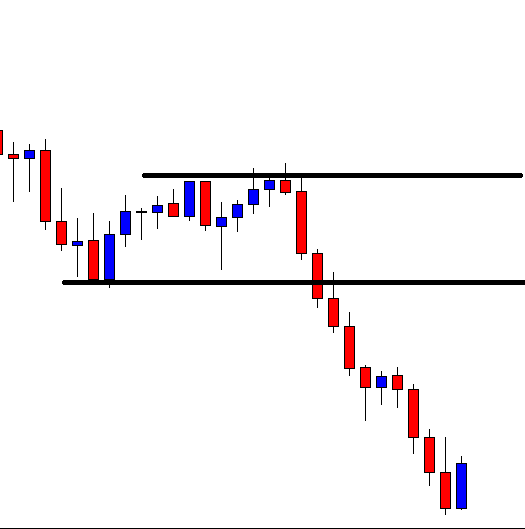
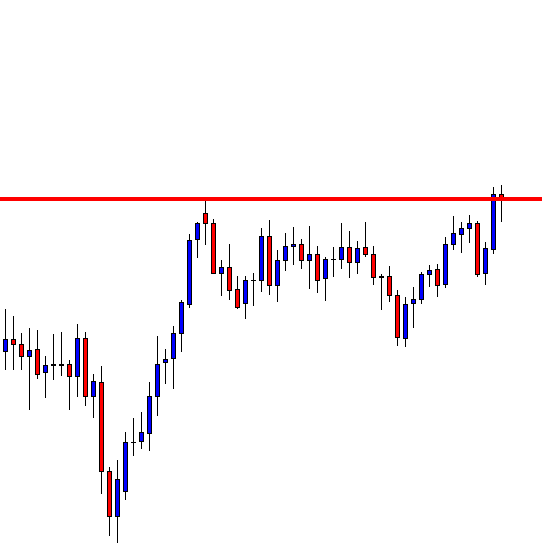
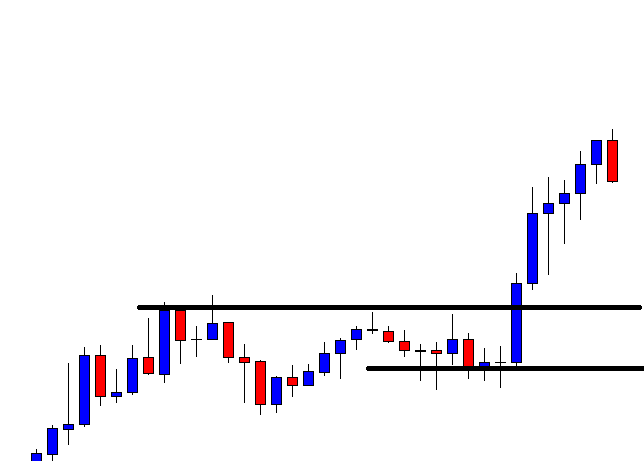
Patience pays back to the buyers at last. The last candle comes out as a bullish candle, which helps the buyers to reach their take profit target. In the end, the trade goes well for the buyers. It may have gone the other way, but H1 breakout traders should stick with their plan and keep discipline.

Categories
Forex Daily Topic Forex Price-Action Strategies

Breakout Length: Key to Trend’s Strength

In today’s lesson, we are going to demonstrate the relation between the trend’s strength and breakout length. The breakout length usually represents one-fourth of a potential trend. If the breakout length is 25 pips, the trend may sustain up to 100 pips before making a big correction or long consolidation. It is important for breakout traders since the market often makes a breakout; confirms the breakout. However, the price does not head towards the trend direction. Let us clarify this by the examples below.

The price has been bearish upon making a bearish engulfing candle. The last swing low is quite far. This means the breakout length looks good for the sellers. The more the breakout length, the better it is for the traders.

The chart produces a bullish engulfing candle in between. This is bad for the sellers. The price may find its new resistance to produce a bearish reversal candle to make a breakout at the lowest low. This means the breakout length most probably needs to be adjusted.

The price seems to have found its new resistance here. It produces a do candle followed by a bearish engulfing candle. This means it produces an evening star. If the price heads towards the South and makes a breakout, the sellers may go short upon breakout confirmation. However, they must calculate new breakout length from the new resistance to the lowest low.

Here comes the breakout candle. This is an explicit breakout. The sellers are to wait for the price to make a breakout confirmation. If the next candle closes below the breakout candle, the sellers may trigger a short entry.

The confirmation candle looks to be an A+ breakout confirmation candle as well. However, do not forget the distance the price has already crossed. The price has crossed about 70% length considering the breakout length. Thus, the price may make a bullish correction. It usually happens when the price finds a new level of support/resistance. Let us proceed to the next chart.

The chart produces a big bullish engulfing candle, which changes the entire scenario. It happens when the price is about to make a correction. Sometimes corrective wave changes the trend. The sellers if the blindly trigger a short entry after the breakout confirmation without calculating breakout length and trend’s strength, they are to take a loss here.

Breakout strategy traders must calculate breakout length to determine how far the price could go. If it crosses more than 50% to confirm the breakout, it is better to skip such entries.


Categories
Forex Price-Action Strategies

Breakout Confirmation Candle and the Difference It Makes

Breakout trading strategy traders first wait for the breakout with good momentum. Then, they are to wait for the breakout confirmation candle. A breakout can be confirmed in two ways. It can take the price towards the trend, or it could come out as in inside bar reversal candle. As long as the candle closes below the breakout level, it confirms the breakout. However, these two types of breakout confirmation push the price towards the trend a bit differently. In today’s article, we are going to demonstrate an example of this.

The price after being bearish makes a bullish correction. The last candle comes out as a bearish pin bar. This is a strong bearish reversal signal. The sellers are to wait for the price to head towards the level of support, where the price has a bounce earlier.

The price heads down with good bearish momentum. It seems that it is going to make a breakout at the drawn level. The breakout sellers are to keep their eyes on the pair closely to take a short entry upon a bearish breakout and breakout confirmation.

Here it comes. The last candle breaches the level of support closing well below it. This is an explicit breakout, which the sellers wait for. If the next candle confirms the breakout, the sellers may drive the price towards the South further.

The next candle comes out as a bullish inside bar. However, it closes within the breakout level. It means the breakout is valid. It is not an A+ breakout confirmation. It offers less reward and does not drive the price towards the trend with good momentum. If the candle came out as a bearish candle closing below the breakout candle, it would be a different ball game. The price may make a move towards the downside by offering 1R at least. Let us see what happens here.

The next candle comes out as a bearish candle. Some sellers may trigger a short entry. In most cases, it does not travel as far as it has traveled to offer the entry.

It produces a strong bearish candle. It seems that the sellers are in control. The question is whether it travels the same distance of Stop Loss-Entry or not. Let us find out from the next chart.

The price starts making an upward correction. It goes back within the breakout level. This chart does not look good for the sellers any more unless it makes a bearish breakout at the last lowest low.

We have seen that the breakout candle and breakout momentum are good. However, the price does not head towards the trend and travel the distance as it usually does. This is what happens if the breakout confirmation candle comes out as an inside bar reversal candle. Thus, it is best if we skip taking such entry.

Categories
Forex Daily Topic Forex Price-Action Strategies

Do Not Give Up Until It Is Void

Forex traders have to have no given up attitude. With patience, discipline, and diligence they have to stick with a chart unless it is completely messed up. In today’s lesson, we are going to demonstrate an example of this.

The chart shows that the price makes a strong bearish move. It finds its support and heads towards the North for an upward correction. Look at the last candle on the chart. This comes out as a bearish engulfing candle, which the sellers wait for in such price action. If the price heads towards the downside and makes a breakout followed by a breakout confirmation, the sellers are going to trigger a short entry. Let us proceed to the next chart.

The sellers do not expect this. The price does not head towards the downside. It rather goes towards the North and roams around the level of resistance. It is painful for the sellers. However, observe on the chart that the level of resistance is still intact. The price may head towards the North but the sellers still have a chance. Let us see what happens next.

The sellers are on their toes again. The chart produces an inverted hammer followed by another long bearish candle. If the price makes a breakout and confirms that, the sellers are going to trigger a short entry.

Here comes the breakout candle. A good-looking bearish candle breaches the level of support closing well below it. This is an explicit breakout. The sellers are to wait for the next candle to close below the lowest low of the breakout candle to trigger the entry.

The next candle comes out as a bearish candle closing well below the breakout candle. The sellers must not waste a second here but trigger the entry right after the last candle closes. A dead-looking chart for the sellers ends up producing entry. Let us proceed to the next chart to find out how the trade goes.

The price heads towards the South in a hurry. It is quite a big bearish move, which offers more than 1R. A trade setup works wonderfully well for the sellers.

Let us recap the entry again. It looks good at the beginning. The price then goes towards the upside and it seems that it may not offer a short entry. The price finds its resistance at the same level; makes a breakout followed by a breakout confirmation. As far as breakout strategy is concerned, the sellers trigger a short entry and make a profit out of it. This is why traders must not give up but stick with the chart as long as it’s valid to produce a signal.

Categories
Forex Daily Topic Forex Price-Action Strategies

Long Shadow in Breakout Confirmation Candle

In price action trading, breakout, as well as confirmation candle’s attributes, plays a significant role. In today’s lesson, we are going to demonstrate an example of how the upper/lower shadow of a breakout confirmation candle plays a role in offering us an entry. Let us get started.

This is an H1 chart. The chart shows that the price makes a strong bearish move. It finds its support. Having a bounce, it goes towards the North. The last candle suggests that the price may have found its resistance too. If it makes a breakout at the level of support, upon getting breakout confirmation, the sellers may go short in the pair.

The price heads towards the South but not with good momentum. It takes only one candle to make a breakout. The sellers must wait. Let us find out what happens next.

Here it comes. The last candle breaches through the level of support. It has a lower shadow, but it closes well below the level. The sellers are to wait for the second important factor, which is breakout confirmation.

The next candle comes out as a bearish candle closing well below the breakout candle’s lowest low. In naked eyes, the sellers may trigger a short entry right after the last candle closes. However, the confirmation candle has a long lower shadow. To be sure about it, we may flip over to the 15 M chart. Let us have a look at the 15 M chart.

Look at the last 15M candle. This is a bullish pin bar, which is a strong bullish reversal candle. The 15 M traders may push the price towards the North. It means the H1 sellers may have to wait to reach the target. That may even end up being a losing trade. Let us flip over to the H1 again.

The last candle comes out as a bullish corrective candle. Usually, the price goes down after a breakout confirmation in such a setup. It this case, it does not. It may keep pushing towards the North even further. Let us find out what happens next.

The last candle comes out as a bullish corrective candle. Usually, the price goes down after a breakout confirmation in such a setup. It this case, it does not. It may keep pushing towards the North even further. Let us find out what happens next.

Yes, the price heads towards the North further. The last candle breaches through the breakout level as well. This does not look good for the H1 sellers. It all starts with a long lower shadow (in a selling market).

Whenever we see a long lower/upper shadow in an H1 chart, we may check it with the 15 M chart. If the last 15 M candle is a strong reversal candle (for opposite trend), we may skip taking the entry.

Categories
Forex Price-Action Strategies

An H1 Trading Strategy, A New Arrow in the Quiver

The H1 chart is one of the most traded charts in the Forex market. This is a very consistent chart considering other intraday charts. In today’s article, we are going to learn a strategy to trade on the H1 chart in the Forex market.

This is an H1 chart. The price after making a bearish move seems to have found its support. It produces two consecutive bullish candles. The buyers are to wait for the price to consolidate and create a bullish breakout to go long. On the other hand, the sellers are to wait for a bearish reversal candle and make a bearish breakout to go short on the pair. Let us find out what the price does next.

The chart produces a bearish engulfing candle, which is the strongest bearish reversal candle. The sellers have the upper hand here. A breakout at the level of support is the next thing to take a short entry here.

The price consolidates around the level of support. The level of support becomes double bottom support. A strong battle is going on between the buyers and the sellers. Traders must wait to find the next direction.

It makes an explicit bearish breakout. Admittedly, the sellers have outplayed the buyers. Traders shall get themselves ready to go short on the pair. The question is why they have to get themselves ready. Should not they trigger any entry right after the last candle closes? The answer is no. They must wait for the next candle to close below the breakout candle. This is the trickiest part of this strategy. Traders must wait for one more candle to make a new lower low (in a bearish market).

Here it comes. The next candle comes out as a bearish candle closing well below the breakout candle. An entry may be triggered right after the last candle closes. The stop loss level is easy to be found out. It is above the level where the trend initiates. We see that a red marked take profit level as well. However, the chart does not show that it is a significant level. How do we find this out then? We may set our take profit exactly with a 1:1 risk-reward ratio. It means the length of entry to stop loss equals to the length of entry to take profit in this strategy. Let us find out how the trade goes.

The trade goes well. We will demonstrate more examples of this strategy soon. Meanwhile, let us concentrate on the things to remember.

  1. The trend initiation candle is to be a strong reversal candle.
  2. The breakout is to be very explicit.
  3. The very next candle is to close below (in a bearish market) or close above (in a bullish market).
  4. Take Profit is to be set with no more than 1:1 risk-reward.
Categories
Forex Price-Action Strategies

Breakout Confirmation Means a Lot

Breakout Confirmation Means a Lot


Price action traders count the breakout as one of their most essential trading components. There is another factor, which is directly related to a breakout: It is called Breakout Confirmation. A breakout is not considered as a perfect breakout on a particular chart if the breakout level does not hold the next candle. In today’s lesson, we are going to demonstrate an example of that.

Thie chart above is a daily chart. The chart shows that the price breaches the level of resistance. The candle closes above the level as well. Many traders consider it as a breakout. It is not a breakout yet on the daily chart. The price may have made a breakout on other minor charts such as the H4, H1, 15M, etc. However, to consider it as a daily breakout, traders must wait for the next daily candle to close above or within the breakout level. Let us have a look at the following daily chart.

The next daily candle comes out as a bullish pin bar and closes within the breakout level. It means that the breakout level holds the price and confirms the breakout. The price may head towards the North because of the breakout and breakout confirmation. The daily-H4 chart traders may flip over to the H4 chart for the price to consolidate and upside breakout.

The H4 chart shows that the price produces a bullish engulfing candle having a long upper shadow. However, the candle closes within the last swing high. The buyers shall wait for the price to consolidate and upside breakout.

The price keeps heading towards the North with an average bullish momentum. The last candle comes out like a spinning top, which is a sign of price consolidation. Let us proceed to the next chart to find out whether it consolidates more or makes an upside breakout.

It produces a bullish engulfing candle closing above the last swing high. The buyers may trigger a long entry right after the candle closes by setting stop loss below the consolidation support. Let us find out how the entry goes.

It goes well. It goes towards the North further even after producing a little bearish candle. Ideally, some buyers may come out with their whole trade there, and some traders may take partial profit. This is another issue. We shall concentrate on the breakout and the breakout confirmation. Since the daily pin bar candle’s body closes within the breakout level, it suggests that the trend is still with the bull. If it closes below the breakout level, things would have been different. Such things matter a lot in the Forex market and traders must consider those.