Categories
Forex Daily Topic Forex Price Action

Pay Attention to the Signal Candle Along with Reversal Candle

In today’s lesson, we are going to demonstrate an example of a combination of an H1-15M chart trading strategy. The price makes a strong bullish move and makes a long bearish correction. It produces several bullish reversal candles, but the price does not react to all of them. It makes its bullish move at last. We try to find out why it reacts to that particular bullish reversal candle. Let us get started.

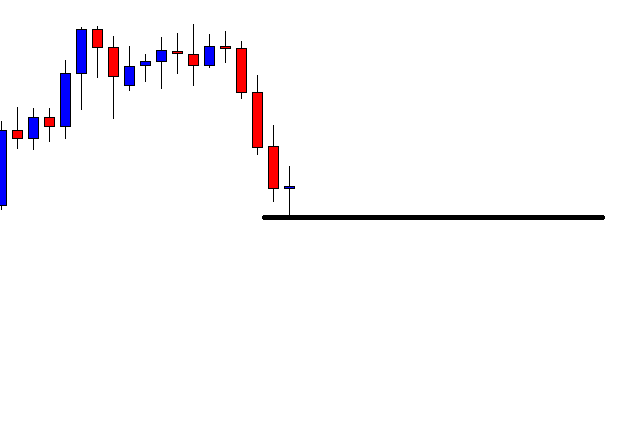
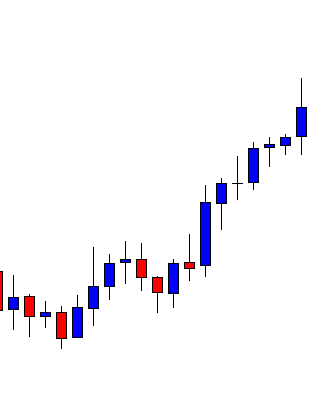
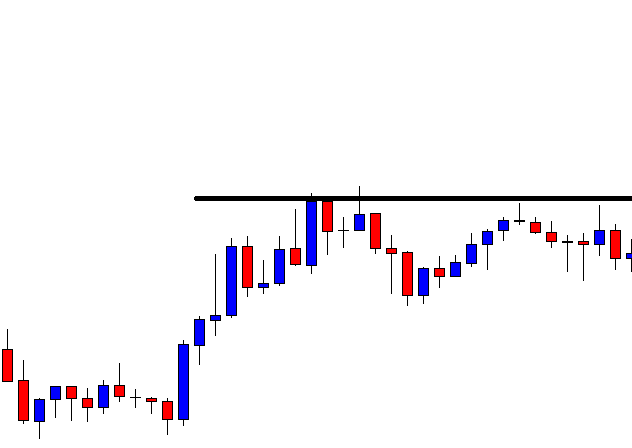
This is an H1 chart. The chart shows that the price produces a bullish engulfing candle and heads towards the North. The buyers are to wait for the price to make a bearish correction and produce a bullish reversal candle to go long again in the pair. The last candle comes out as a hanging man. It may make the pair make a bearish correction. Let us proceed to the next chart to find out what happens next.

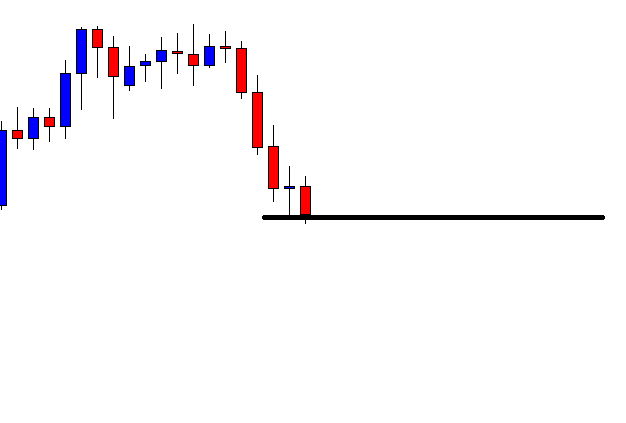
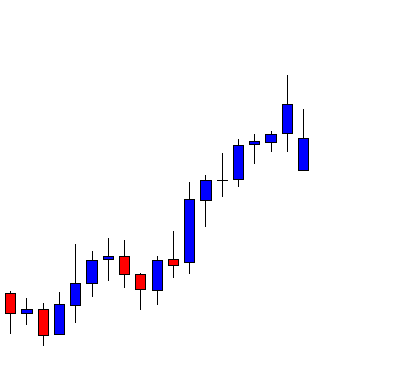
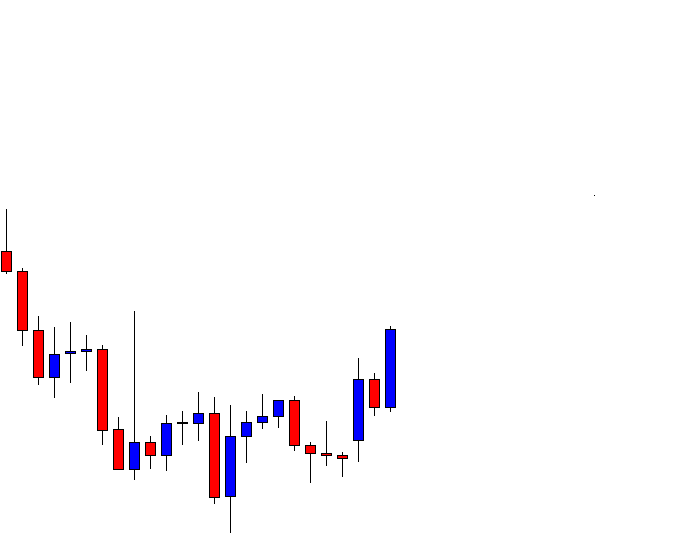
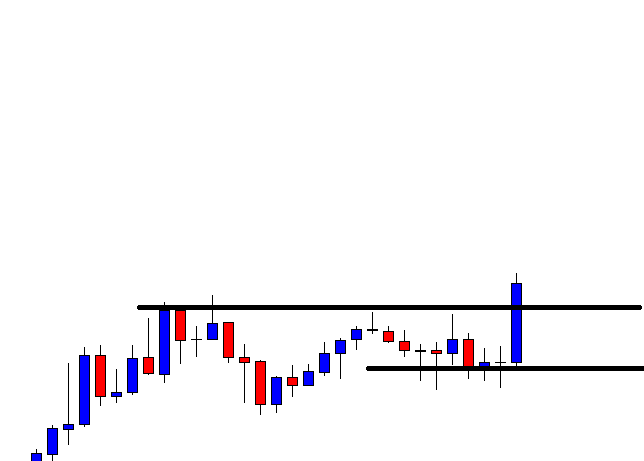
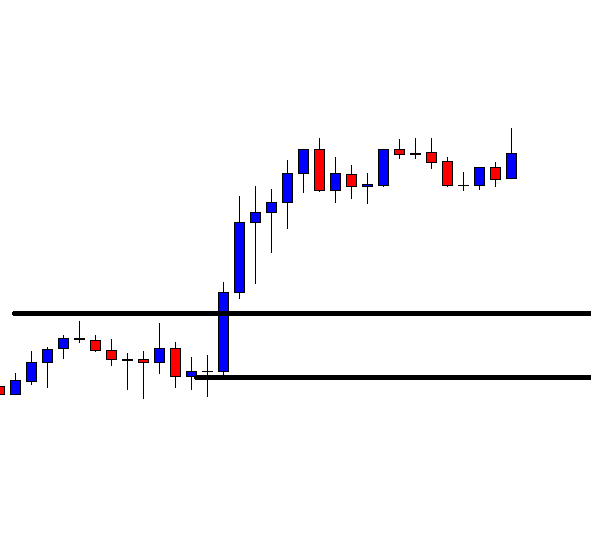
The price makes a long bearish correction. It produces several bullish reversal candles. However, it does not make its bullish move. If we spot out, we find that there have been three significant bullish reversal candles. To make things clearer, have a look at the chart below.

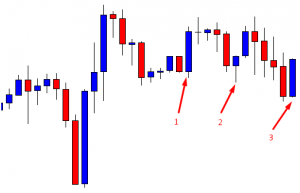
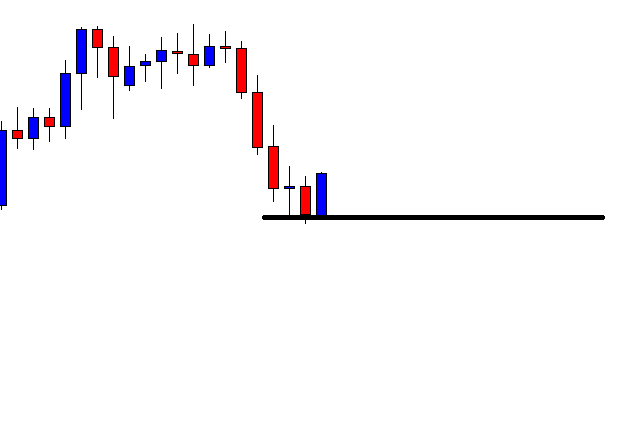
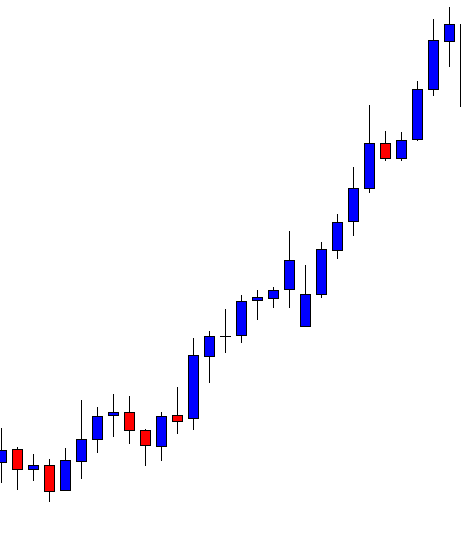
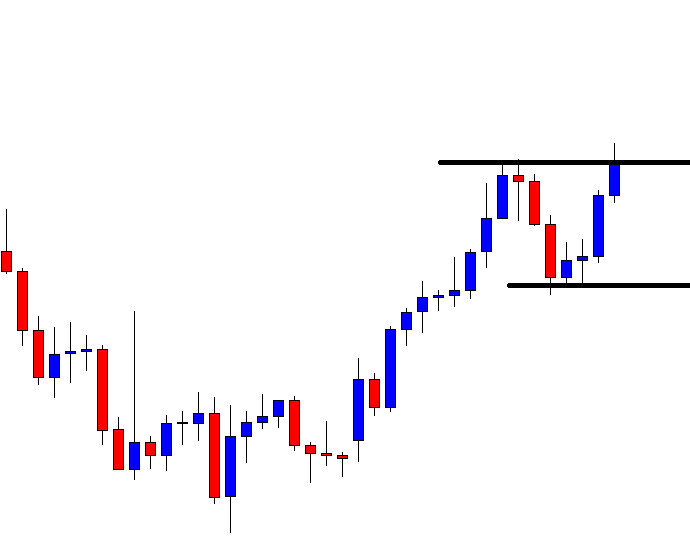
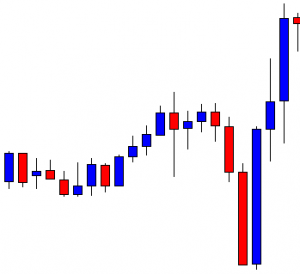
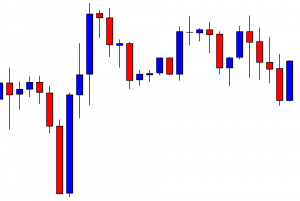
Here are the three most significant bullish reversal candles that the chart produces. On the first two occasions, the price does not head towards the North. Let’s try to dig out what happens on the first occasion. On the first occasion, the chart produces a bullish engulfing candle. This is one of the strongest bullish reversal candles. The buyers are to flip over to the 15M chart. If the 15M chart produces a bullish continuation candle, they may trigger a long entry. Over here, the 15M chart does not produce a bullish continuation candle. Thus, the price does not head towards the North. On the second occasion, the 15M chart produces a bullish continuation candle. You can assume by the look of the next H1 candle. However, the price does not continue its move or makes a breakout at the highest high. The reason behind that is the reversal candle comes out as an Inside bar. On the third occasion, the reversal candle comes out as a bullish engulfing candle. Let us flip over to the 15M chart.

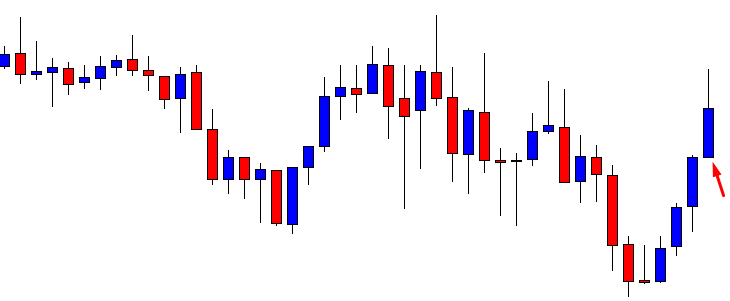
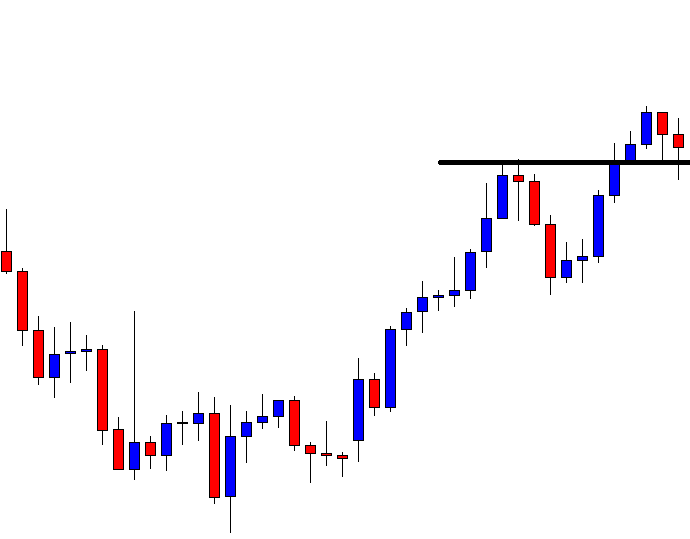
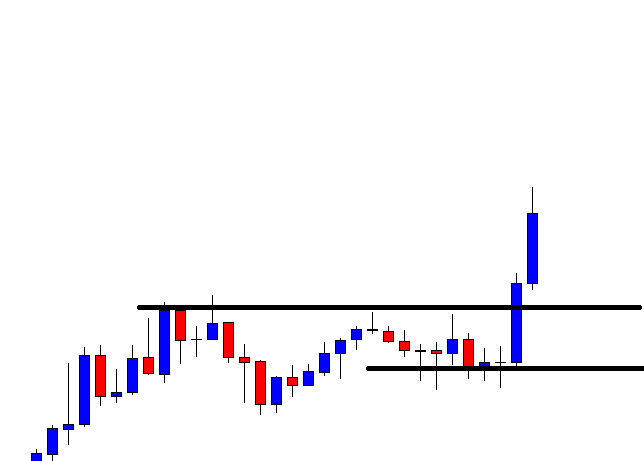
Look at the arrowed candle. This is what comes out after the bullish engulfing candle. The buyers have been waiting to get a candle like this after a strong H1 bullish reversal candle. They may trigger a long entry right after the candle closes (15M). Let us find out how the price moves now.

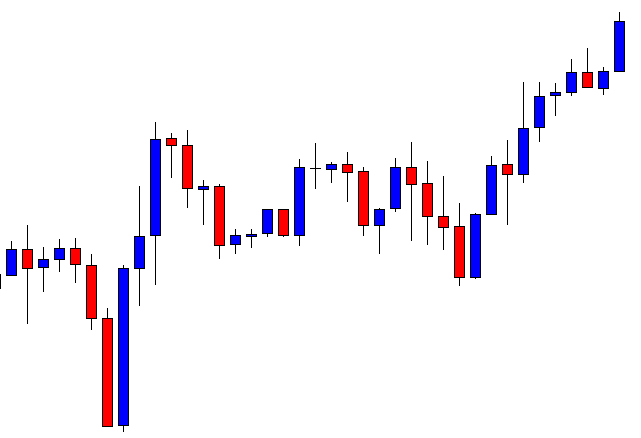
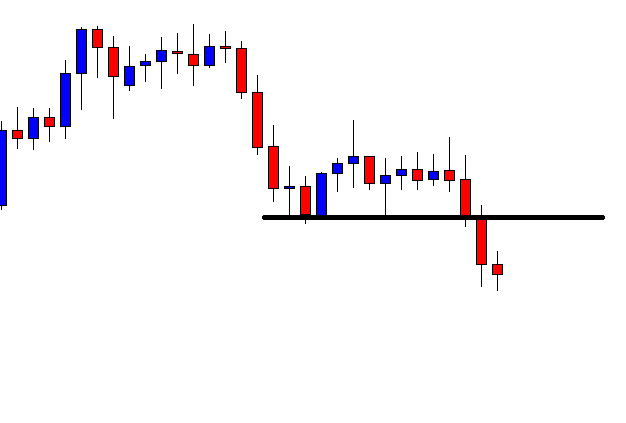
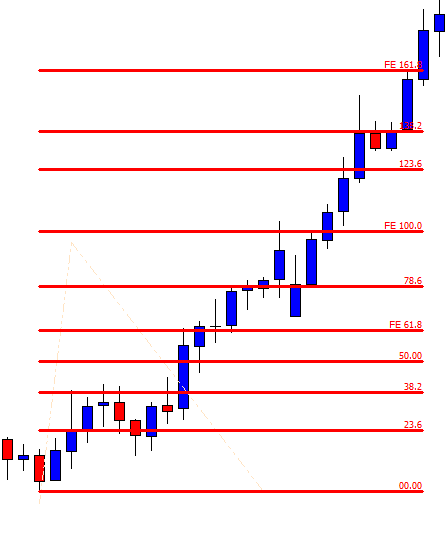
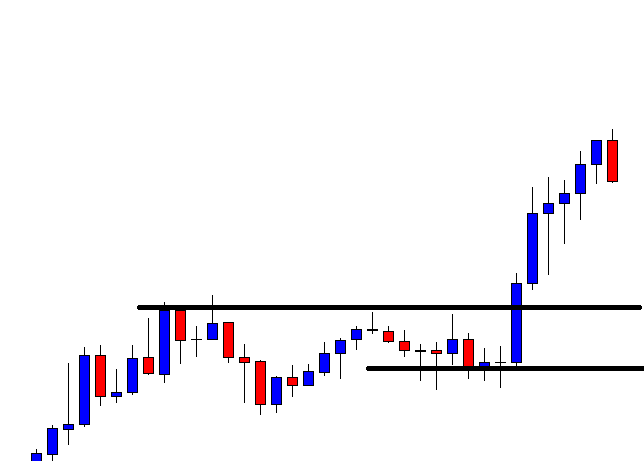
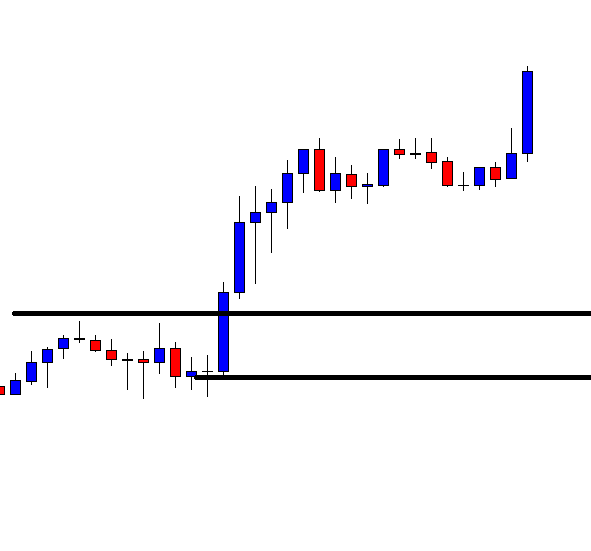
It moves towards the North with good bullish momentum. We must notice that when two factors come together, the price reacts vigorously. We may find that sometimes the price moves on the case of the second occasion as well. However, when it meets two of them together (H1 bullish engulfing and 15M bullish continuation and vice versa), most likely, it goes towards the trend and helps traders make money.

Categories
Forex Daily Topic Forex Price Action

Spot the Chart Accordingly before Triggering for an Entry

In today’s lesson, we are going to demonstrate an example of a chart, which may entice traders to take entry more than once. Some traders may get themselves engaged in taking entry. We find out why we price action traders skip taking those entries. Let us get started.

This is an H4 chart. The price makes a strong bearish move by producing three consecutive Marubozu bearish candles. The last candle comes out as a doji candle. The price may consolidate now. The sellers are to wait for a strong bearish reversal candle upon consolidation to go short in the pair. Let us proceed to the next chart.

The chart produces a bearish Marubozu candle again. As a reversal candle, it is a strong one. However, the price has not consolidated well. It has produced the bearish reversal candle upon having a shallow consolidation. Moreover, the last candle does not close below the level of support. Thus, the sellers may skip taking the entry but wait for the right time to come. The chart still looks good for the sellers.

The chart produces a bullish engulfing candle. The price may make a deeper consolidation this time. The sellers may keep their eyes on the chart again to go short in the pair. Let us proceed to the next chart to find out what happens next.

The price makes a deeper consolidation. Upon finding its resistance, it makes a bearish move. It seems that the price may make a breakout here. A question may be raised here whether the sellers on the H4 chart shall take the entry or not? We find out the answer in a minute. Meanwhile, let us proceed to the next chart.

The next H4 candle closes well below the level of support. The pair trades below the breakout level for one more candle as well. However, the sellers on the H4 chart may skip taking the entry. The reason behind that is the chart takes more than six candles (a day) to make the breakout. This level of support is a daily level of support now. Thus, the sellers may take the trading decision as far as the daily chart is concerned. If they take their trading decision by observing the H4 chart, it may not be that fruitful. The risk-reward may not be a good one. It may not end up being a daily breakout, but the price may come back in. Or, the daily chart may produce a bullish corrective candle next day, which makes the price hit the H4 sellers stop loss. Thus, in such cases, they might have to take losses only because the pair belongs to the daily chart. Thus, for better trading, traders shall take a closer look before taking entry on a chart to determine whether it favors their trading chart.

Categories
Forex Daily Topic Forex Fibonacci

Draw Fibonacci Levels on Your Trading Chart

Fibonacci traders are to find out a good move, followed by a price correction. They keep their eyes on the 61.8% level with extreme attention. If the level of 61.8% produces a reversal candle, traders trigger for entry. Usually, the price goes up to the level of 161.8% if the price trends from 61.8%. This allows an excellent risk-reward to the traders as well. In today’s article, we are going to demonstrate an example of how the golden ratio of 61.8% plays such an important role in moving the market towards the trend. Let us get started.

The chart shows that it makes a bullish move upon producing a bullish engulfing candle. The price makes a downside correction and moves towards the North again. This time the price makes the move with good bullish momentum. The Fibonacci traders are to wait for the price to make a downside correction and draw Fibonacci levels to go long in the pair. Let us proceed to the next chart to find out whether it starts having downside correction or heads towards the North further.

This is an interesting move by the chart. It has a bearish gap, but the candle comes out as a bullish candle. Despite having an upper shadow, this is a bullish reversal candle. Let us find out how the price reacts upon getting such a bullish reversal candle.

The price heads towards the North with extreme bullish momentum. The bull outplays the bear. This is such a strong bullish move that the buyers would love to make full use of it. Do you notice something interesting? Yes, the price trends from the 61.8% zone. Let us draw the Fibonacci levels and see how it looks.

The chart shows that despite having a bearish gap, the chart produces a bullish candle within 61.8% zone and heads towards the North. It hits the level of 161.8% in a hurry as well. This is what the Fibonacci golden ratio level does almost all the time. There are different ways of trading and catch such a move. Some traders enter before the breakout, while some enter after the breakout at the highest high of the wave. Both have merits and demerits, which we will learn in our forthcoming Fibonacci lessons. Meanwhile, concentrate on your chart and practice drawing Fibonacci levels by pointing out the highest high and the lowest low. Start practicing this, so you get well acquainted with Fibonacci significant levels and how the price reacts to them. This will help you trade much better soon.

Categories
Forex Daily Topic Forex Price-Action Strategies

Example of a Breakout Unfit for an Entry


In today’s lesson, we are going to demonstrate an example of a breakout on the H4 chart. The chart shows that the price heads towards the North with good momentum. It makes a bullish breakout upon consolidation. However, the breakout is not the kind that the breakout traders look for. Thus, this is going to be an example which we should skip taking entry. Let us now have a look at what happens.

The chart shows that it produces a bullish candle followed by a bearish inside bar. The next candle comes out as a bullish engulfing candle. Do you notice something here? Yes, this is an entry for the buyers. However, this is not where we concentrate today. Let us proceed to the next chart to dig out the main story.

The price keeps going towards the North. The buyers are to wait for the price to consolidate and produce another bullish engulfing candle to offer them entry. The way it has been going, it seems that the buyers hold the key and dominate over the sellers.

The price makes a bearish correction and finds its support. The first bullish reversal candle comes out as a bullish inside bar. This is not a strong bullish reversal candle. It produces three more bullish candles but the price does not make a breakout at the level of resistance. The last candle closes within the level of resistance, which is a point to be noticed. It means even the next candle makes a breakout, it would be a breakout right from the level of resistance.

The next candle closes well above the level of resistance. This is a breakout but not the kind of breakout that the breakout buyers wait for. The price is trending towards the upside; it consolidates and makes a bullish breakout. These three equations suggest that the buyers may take a long entry. They must not forget that the breakout candle does not make an explicit breakout. If a breakout takes place by one bullish engulfing candle that brings momentum. Over here, it needs four candles to make the breakout. Moreover, the breakout candle forms right at the level of resistance (now support). The buyers may restrain themselves from taking such entry. Let us find out what the price does next.

The price comes back to the breakout level. This is what usually happens when the price does not make a breakout with an A+ breakout candle. The price may still head towards the North, but 1 out of 3 times, it may come back in and hits the stop loss. Thus, to have winning consistency, we might as well skip taking entry in such price action.

Categories
Forex Daily Topic Forex Price-Action Strategies

H1 Breakout Trading: Keep Holding Your Positions

Price action traders are to maintain discipline with their entry and trade management. As far as trade management is concerned, it varies on time frames. Trade management on the H4 chart and the H1 chart is different. A reversal candle on an H4 chart has more potential to change the existent trend. Thus, traders may need to think about an early exit. On the other hand, H1 breakout traders may keep holding their positions until it reaches the target. In today’s lesson, we are going to demonstrate an example of this.

The chart shows that the price after being bullish has rejections at a level of resistance. The price heads towards the North but does not make any breakout. It has been in the bearish correction again. Let us see whether it finds its support and makes a bullish breakout or not.

Here it comes. The price finds its support and produces a bullish engulfing candle breaching the level of resistance. This is an A+ breakout candle. The buyers are to wait for the next candle to close above the breakout candle to trigger a long entry.

The next candle comes out as a bullish candle as well. It has an upper shadow, but the last 15 candle comes out as a bullish candle. The buyers may trigger a long entry right after the last candle closes by setting stop loss below the support level and take profit with 1R.

The price heads towards the North. However, it seems that the price does not head towards the target with good bullish momentum. Moreover, the last candle comes out as a bearish engulfing candle. This is ominous for the buyers. Do not forget this is an H1 chart, and the buyers are not supposed to take an early exit. They should keep holding their position and wait for the price to do the rest.

The price gets rather choppy. It has been testing traders’ patience. It is hard to keep holding positions. However, traders must not keep looking at the chart. Meanwhile, they might as well concentrate on other charts to find out potential entries.

Patience pays back to the buyers at last. The last candle comes out as a bullish candle, which helps the buyers to reach their take profit target. In the end, the trade goes well for the buyers. It may have gone the other way, but H1 breakout traders should stick with their plan and keep discipline.