Categories
Forex Daily Topic Forex Price Action

Determinin Risk/Reward using Fibonacci Levels

In today’s lesson, we are going to demonstrate an example of a daily-H4 chart combination trading. We also find out how the price reacts to Fibonacci retracement levels and how Fibonacci levels may help us determine risk-reward. Let us start with the daily chart.

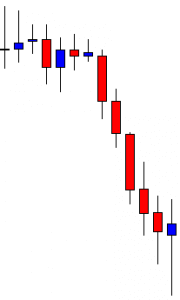
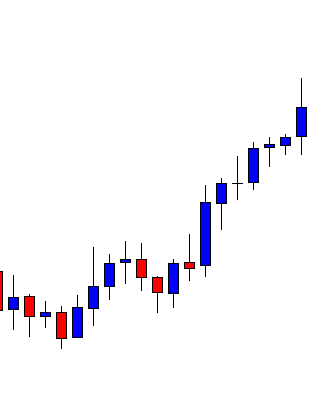
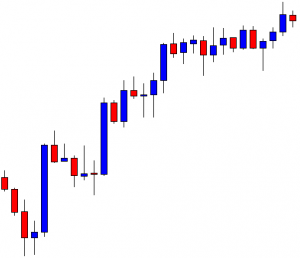
This is the daily chart. The chart shows that the price heads towards the North with good bearish momentum and crosses a long way. The last candle comes out as a spinning top with a bullish body. It is a bullish reversal candle, but not a strong one. Let us flip over to the H4 chart and see how it looks.

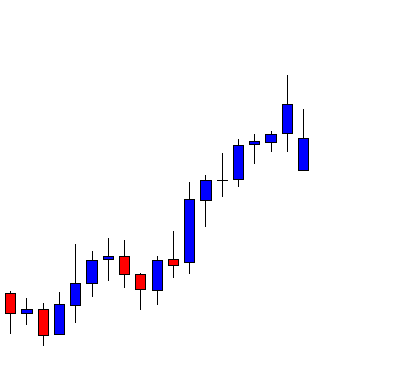
The chart shows that it produces a morning star. It is a strong bullish reversal pattern. The last candle comes out as a bullish inside bar. The buyers may wait for the price to find its support and produce a bullish reversal candle to go long on the chart.

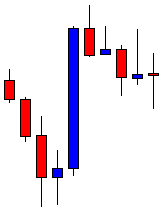
The price heads towards the South to have a bearish correction. The last candle comes out as a Doji candle. It seems that the price may have found its support. It may not take long to produce a bullish reversal candle.

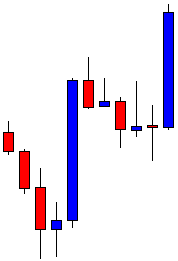
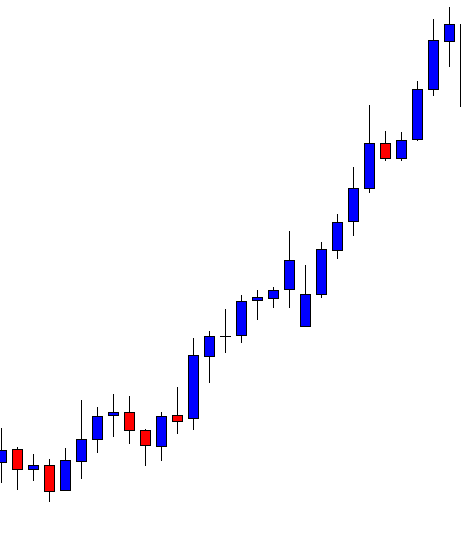
As expected, the chart produces a bullish engulfing candle closing well above the last swing low. Traders love to have a signal candle like this to trigger an entry. It usually attracts more traders to trade and brings more liquidity. However, here is an equation that we must remember. When the price makes a correction, it is good for the traders to have an engulfing candle as a signal candle closing within the last swing low. It offers the price to travel more space towards the trend. However, when the price consolidates, it must make a breakout at the last support/resistance, though. Let us find out how the price moves after that bullish engulfing candle.

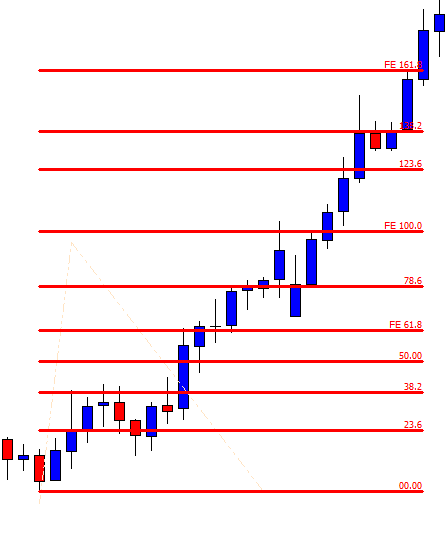
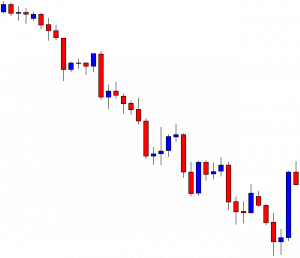
The price heads towards the North with a sluggish pace. Moreover, the price gets caught within two horizontal levels for several candles. It seems that the price is struggling to go towards the North further. Let us draw Fibonacci levels and try to find out the reason behind it.

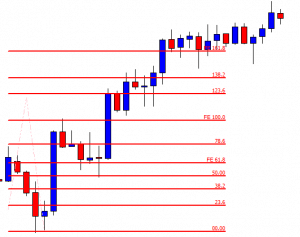
The chart produces the signal candle at the 61.8% level, which is fantastic. Usually, the price goes towards the level of 161.8% if it trends from the 61.8% level. Over here, the candle closes at 123.6% level, which means the price does not have enough space travel. This is why the price moves towards the North sluggishly. Fibonacci levels help us determine where to set stop loss and take profit. It also helps us determine the risk-reward, which we must not forget.

Categories
Forex Daily Topic Forex Fibonacci

Draw Fibonacci Levels on Your Trading Chart

Fibonacci traders are to find out a good move, followed by a price correction. They keep their eyes on the 61.8% level with extreme attention. If the level of 61.8% produces a reversal candle, traders trigger for entry. Usually, the price goes up to the level of 161.8% if the price trends from 61.8%. This allows an excellent risk-reward to the traders as well. In today’s article, we are going to demonstrate an example of how the golden ratio of 61.8% plays such an important role in moving the market towards the trend. Let us get started.

The chart shows that it makes a bullish move upon producing a bullish engulfing candle. The price makes a downside correction and moves towards the North again. This time the price makes the move with good bullish momentum. The Fibonacci traders are to wait for the price to make a downside correction and draw Fibonacci levels to go long in the pair. Let us proceed to the next chart to find out whether it starts having downside correction or heads towards the North further.

This is an interesting move by the chart. It has a bearish gap, but the candle comes out as a bullish candle. Despite having an upper shadow, this is a bullish reversal candle. Let us find out how the price reacts upon getting such a bullish reversal candle.

The price heads towards the North with extreme bullish momentum. The bull outplays the bear. This is such a strong bullish move that the buyers would love to make full use of it. Do you notice something interesting? Yes, the price trends from the 61.8% zone. Let us draw the Fibonacci levels and see how it looks.

The chart shows that despite having a bearish gap, the chart produces a bullish candle within 61.8% zone and heads towards the North. It hits the level of 161.8% in a hurry as well. This is what the Fibonacci golden ratio level does almost all the time. There are different ways of trading and catch such a move. Some traders enter before the breakout, while some enter after the breakout at the highest high of the wave. Both have merits and demerits, which we will learn in our forthcoming Fibonacci lessons. Meanwhile, concentrate on your chart and practice drawing Fibonacci levels by pointing out the highest high and the lowest low. Start practicing this, so you get well acquainted with Fibonacci significant levels and how the price reacts to them. This will help you trade much better soon.

Categories
Forex Daily Topic Forex Fibonacci

Fibonacci Retracement: A Magic Trading Tool

Financial traders rely a lot on a tool called Fibonacci Retracement. This shows the percentage of retracement that the price makes after making a strong bullish/bearish move. The percentage of retracement is very significant to the traders. There are some particular levels, where the price reacts heavily and creates a new trend. Thus, financial traders use Fibonacci Retracement tool to measure retracement length and find the potential whether it is going to create a new trend or not. The Forex traders love using the Fibonacci Retracement tool as well. Once we know how to draw it on the chart accordingly, we find out that the currency pairs on almost all the timeframes obey the Fibonacci retracement ratio.

Leonardo Fibonacci, an Italian mathematician, identified a series of numbers such as 0, 1, 1, 2, 3, 5, 8. 13, 21, 34, 55, etc. Each number is the sum of the preceding two numbers.  These numbers produce some significant ratios, such as 23.6. 38.2, 50, 61.8. 78.6, 100, 123.6, 138.2, 161.8. These ratios and the Fibonacci sequence are found in nature as well. Thus, people love using the sequence ratios in their design and plan. At the end of the day, people run financial markets. They buy or sell at certain levels. Since Fibonacci ratios are much related to our nature and life, traders love using these ratios to help decide where to buy and where to sell.

As far as Fibonacci ratios are concerned, the 61.8 is considered as the golden ratio. It is found in flower petals, seed heads, pinecones, fruits and vegetables, tree branches, shells, spiral galaxies, hurricanes, fingers, animal bodies, reproductive dynamics, animal fight patterns, DNA molecule, etc.

In the financial/Forex market, the ratios are used by using a tool called Fibonacci Retracement. There are other Fibonacci tools, but this one may be the trader’s most favorite.

In a buying market, a trader draws his Fibonacci retracement levels from the lowest low to highest high.

The level of 00.00 is the lowest low, and the 100.00 is the highest high of a bullish wave. Traders are to wait for the price to make a bearish retracement. All these levels are significant, and the price reacts to these levels. However, the buyers pay more attention when the price is around 61.8 level to go long in a pair.

In a bearish market, it is just the opposite. Let us have a look at how it looks like.

Fibonacci Retracement levels help traders spout out the trend’s initiating point. Thus, it becomes easy for the traders to take entry with excellent risk-reward. In our forthcoming articles, we are going to demonstrate charts on different pairs, time frames to find out how the price reacts to different Fibonacci levels. Stay tuned.