Categories
Forex Daily Topic Forex Fibonacci

Fibonacci Trading: Fibonacci Levels Help Traders be Precise

Fibonacci Trading: Fibonacci Levels Help Traders be Precise

In today’s lesson, we are going to demonstrate an example of a chart where the price makes a bullish move from 78.6% Fibonacci level. The 78.6% Fibonacci level often makes the price reverse towards the trend’s direction. In today’s example, the price produces a Morning Star and heads towards the trend’s direction with good bullish momentum. Let us see how it happens.

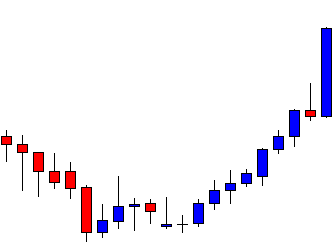
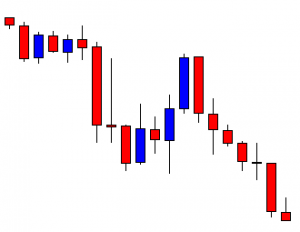
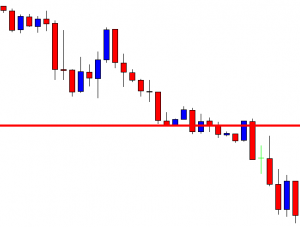
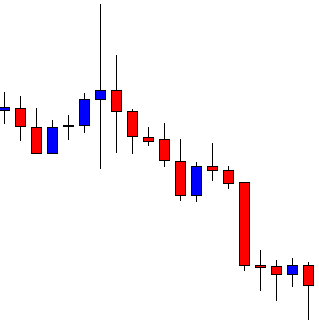
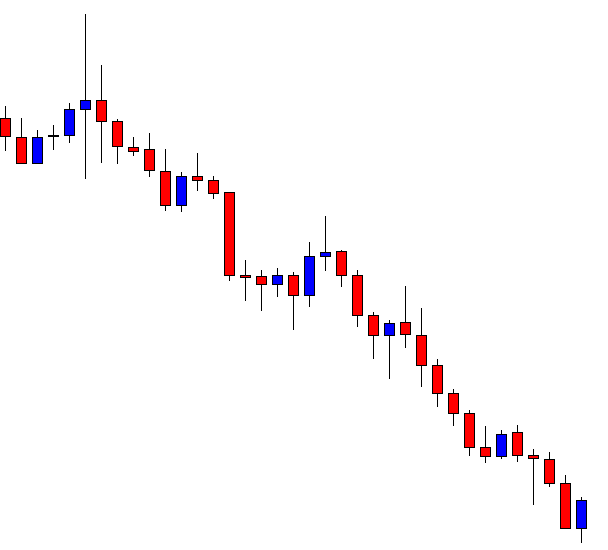
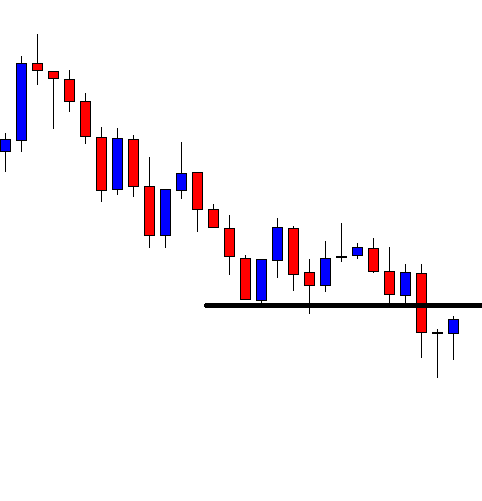
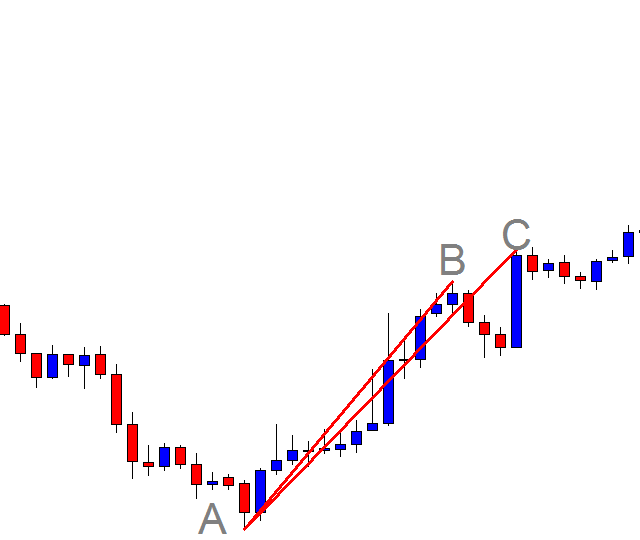
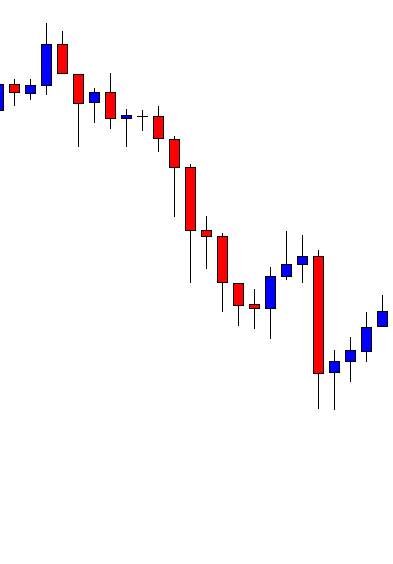
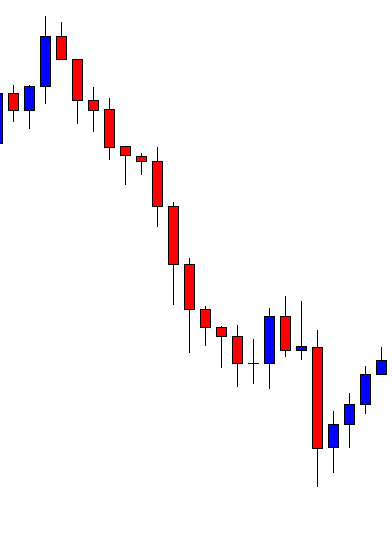
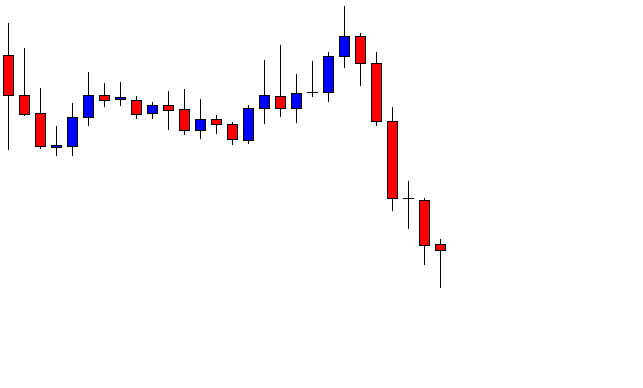
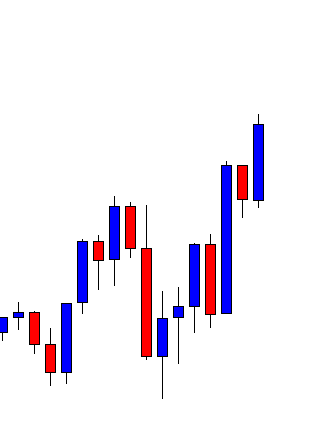
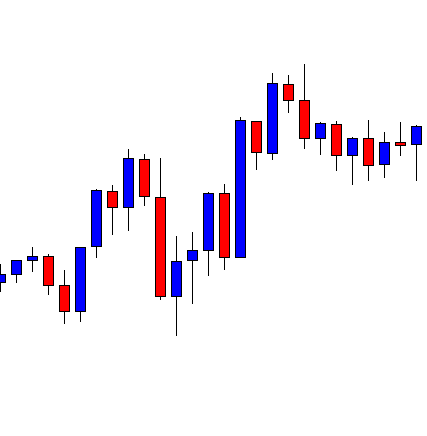
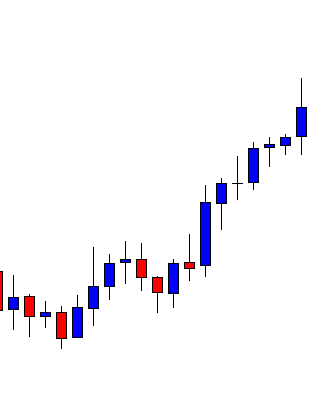
It is an H4 chart. The price produces double bottom and heads towards the North with good bullish momentum. On its way, it produces only a single bearish candle. The buyers are to wait for the price to make a bearish correction and to get a bullish reversal candle to go long with a good risk-reward in the pair.

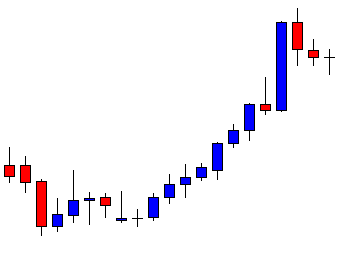
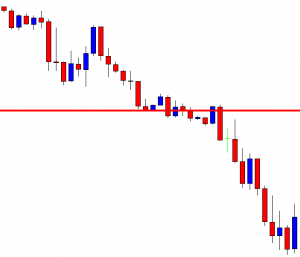
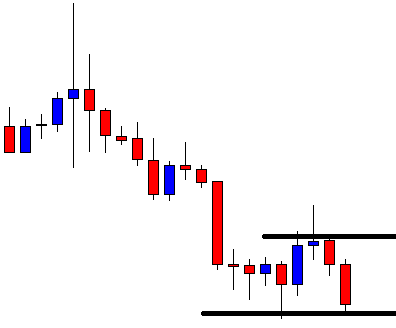
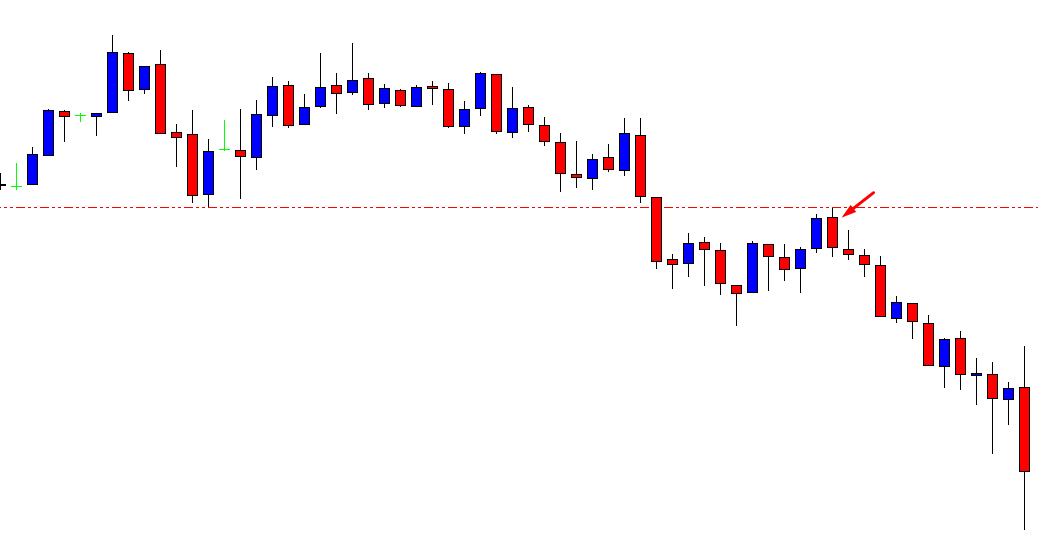
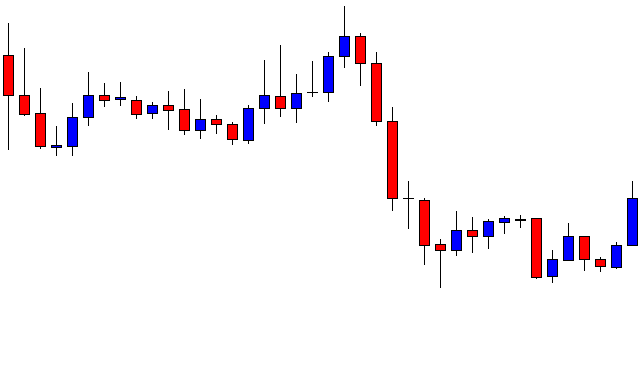
The chart produces a bearish inside bar. Then, it produces one more bearish candle. Look at the last candle. It comes out as a doji candle. It seems that the price may have found its support. A strong bullish reversal candle may attract the buyers to go long in the pair and push the price towards the North to make a new higher high.

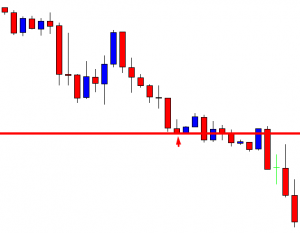
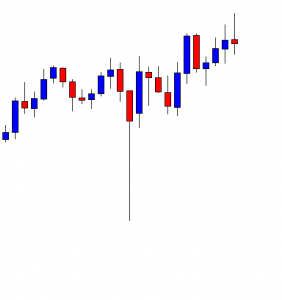
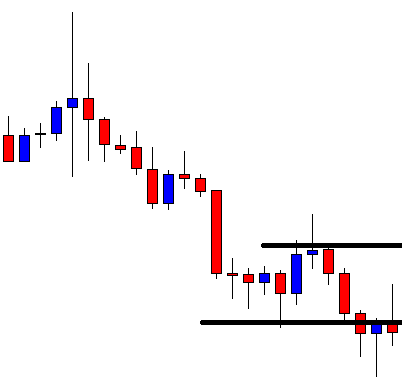
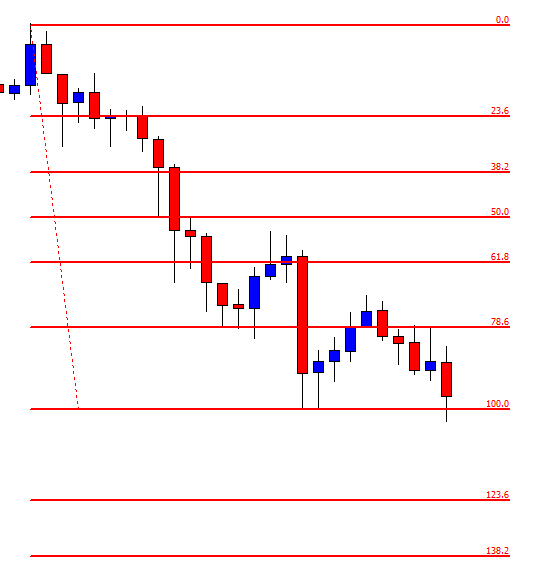
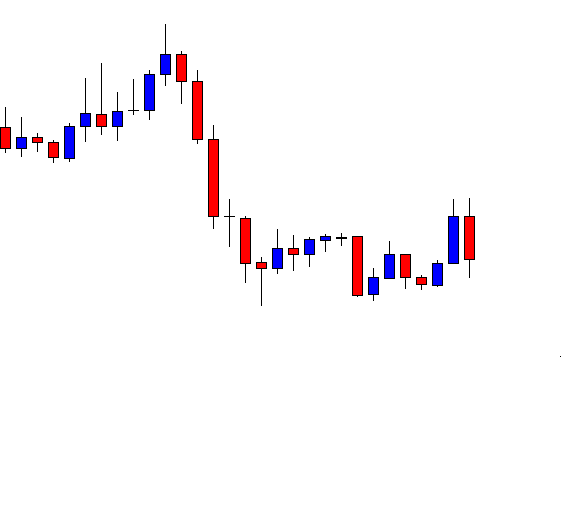
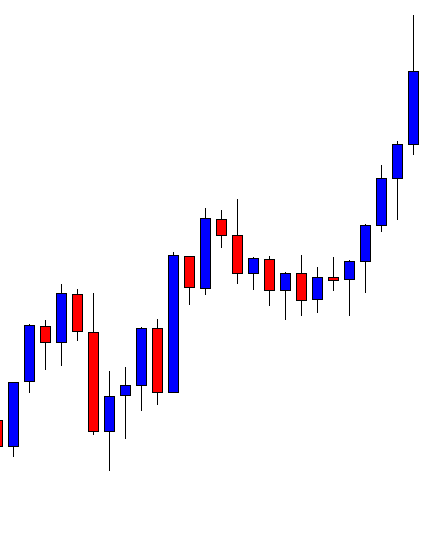
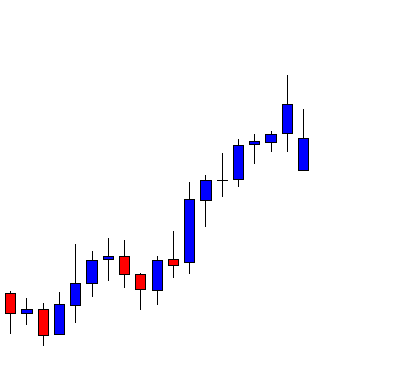
The chart produces a bullish engulfing candle. The combination of the last three candles is called Morning Star. This is one of the strongest bullish reversal patterns in the Forex market. The buyers may trigger a long entry right after the last candle closes. They may set stop loss below the signal candle’s lowest low. We’ll find out the take-profit level in a minute. Let us first see how the trade goes here.

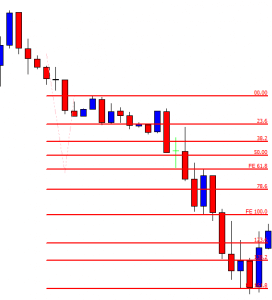
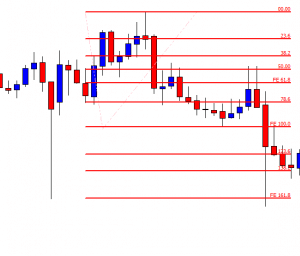
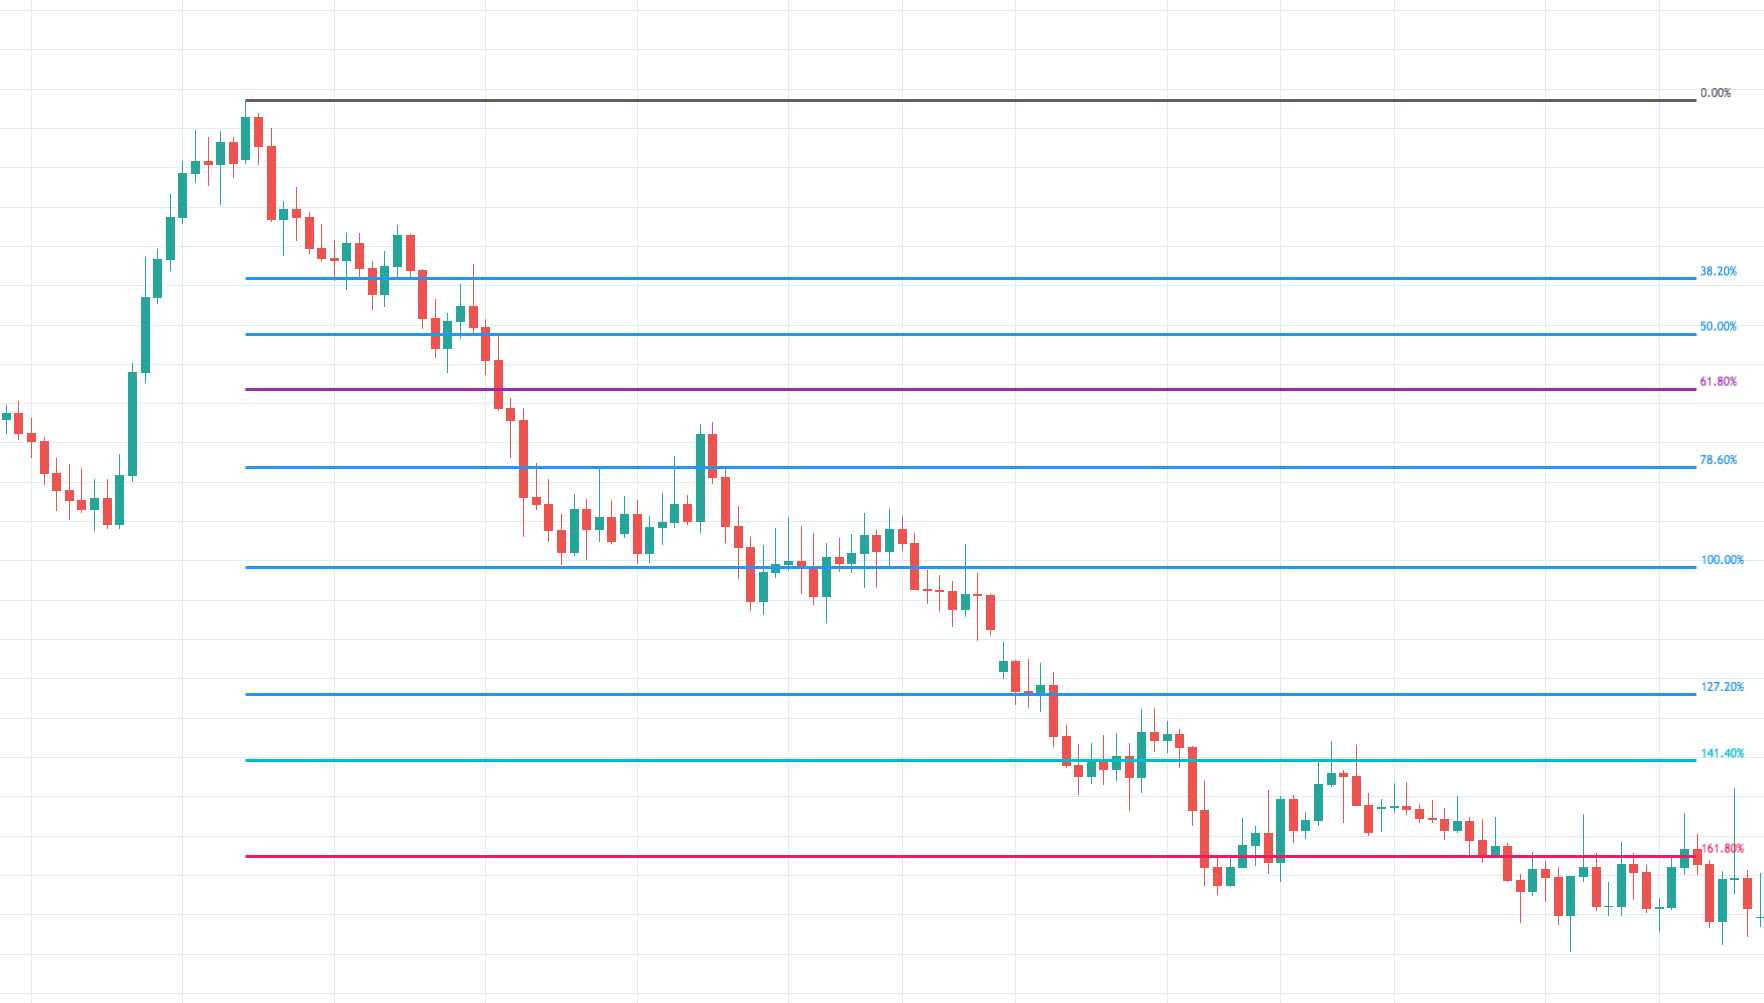
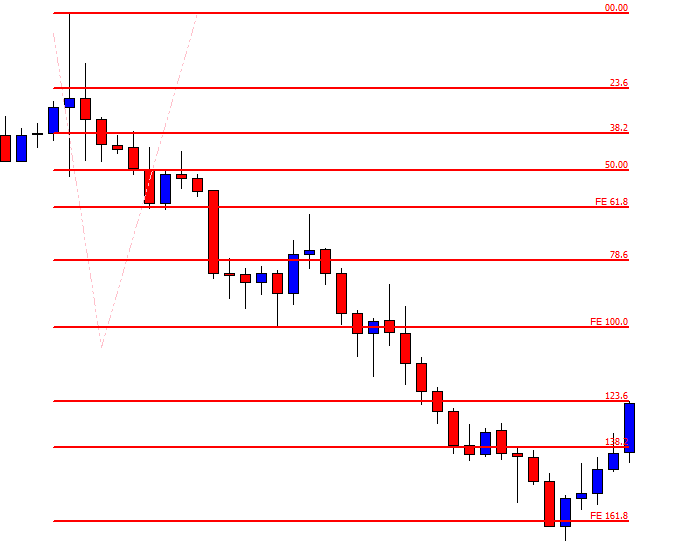
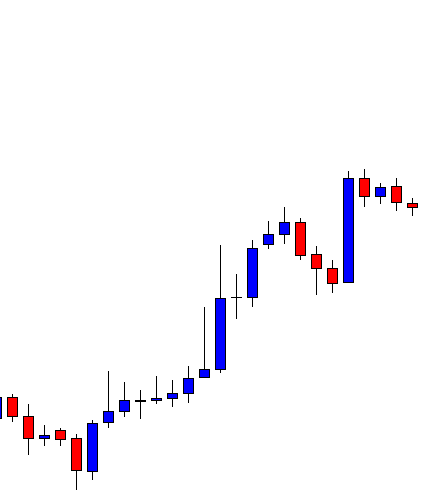
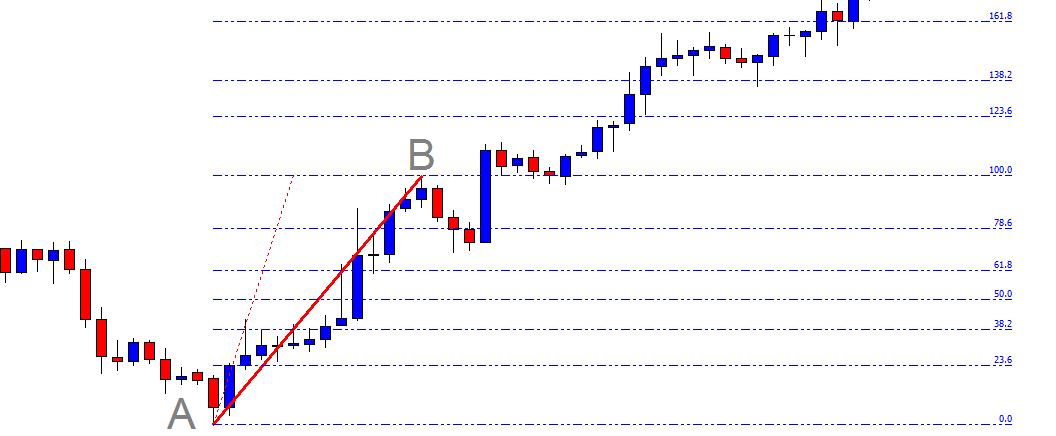
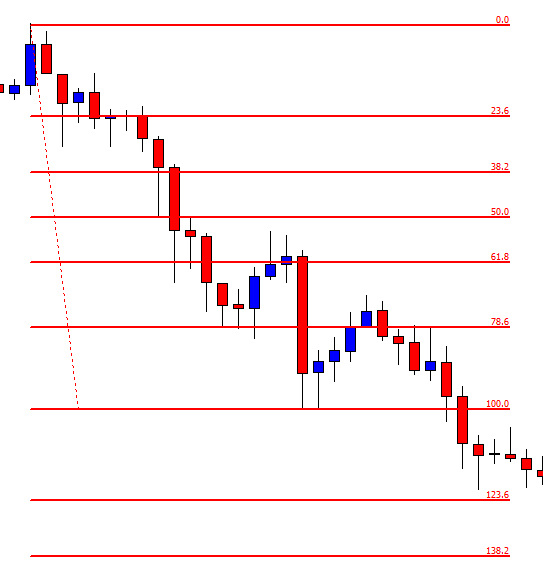
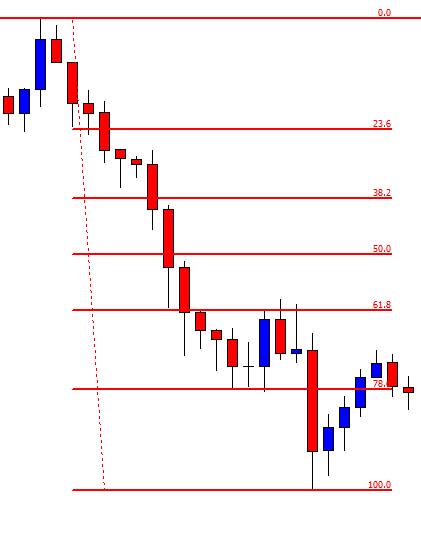
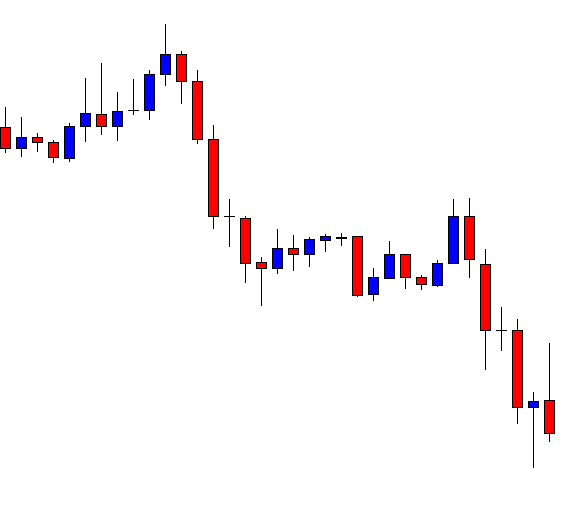
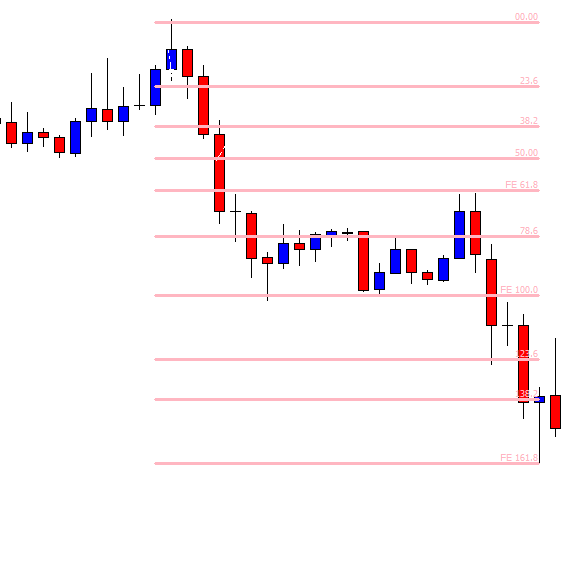
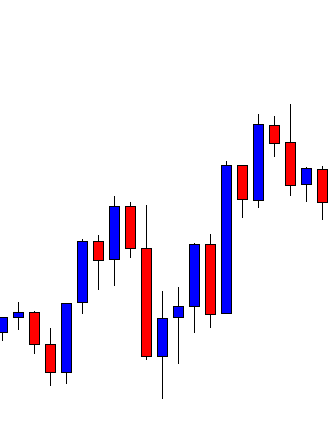
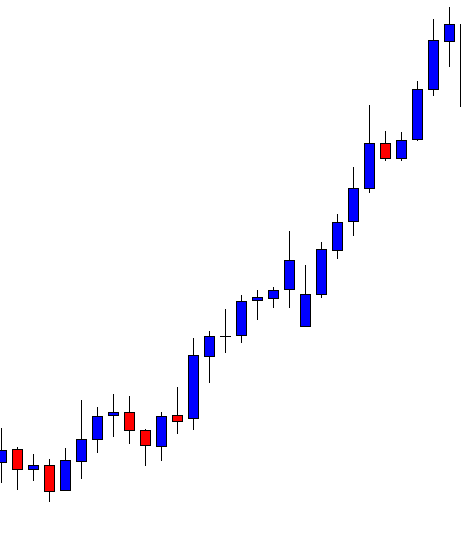
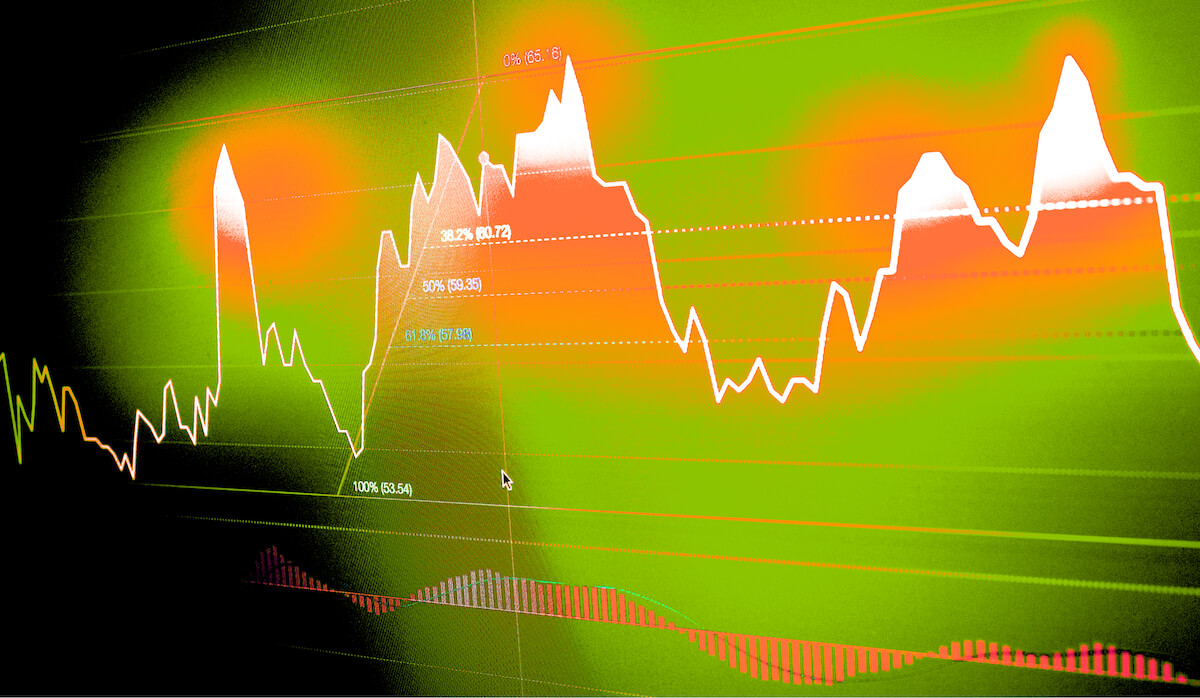
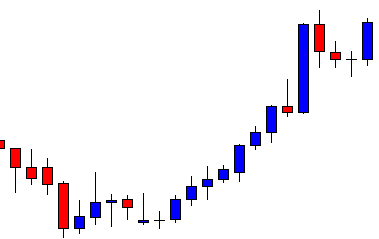
The price heads towards the trend’s direction with extreme bullish momentum. The last candle comes out as a bearish inside bar. It may make a bearish correction now. Some sellers may close their trade manually after the last candle. You may notice if they do that, they lose a few pips. How about if we knew that the price may make a bearish reversal from here before the last candle is produced. Yes, it is possible by using Fibonacci levels. Let us draw Fibonacci levels on the chart.

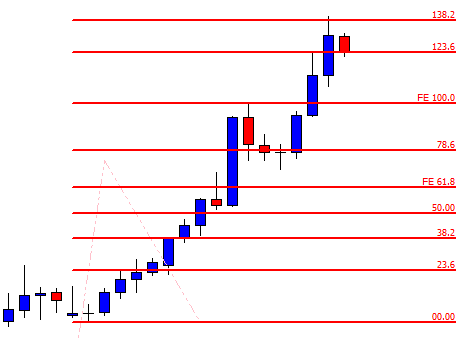
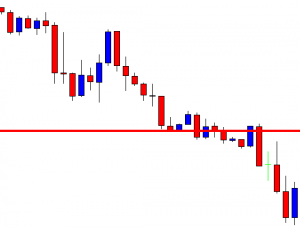
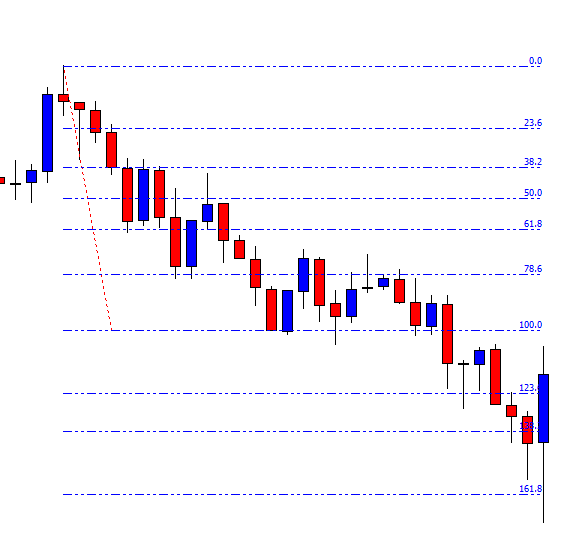
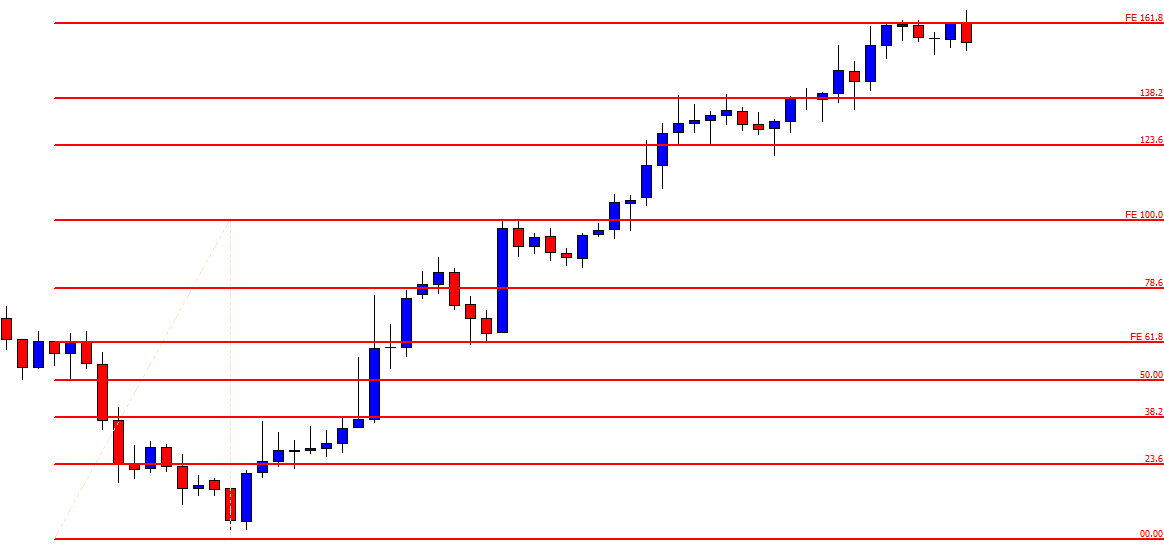
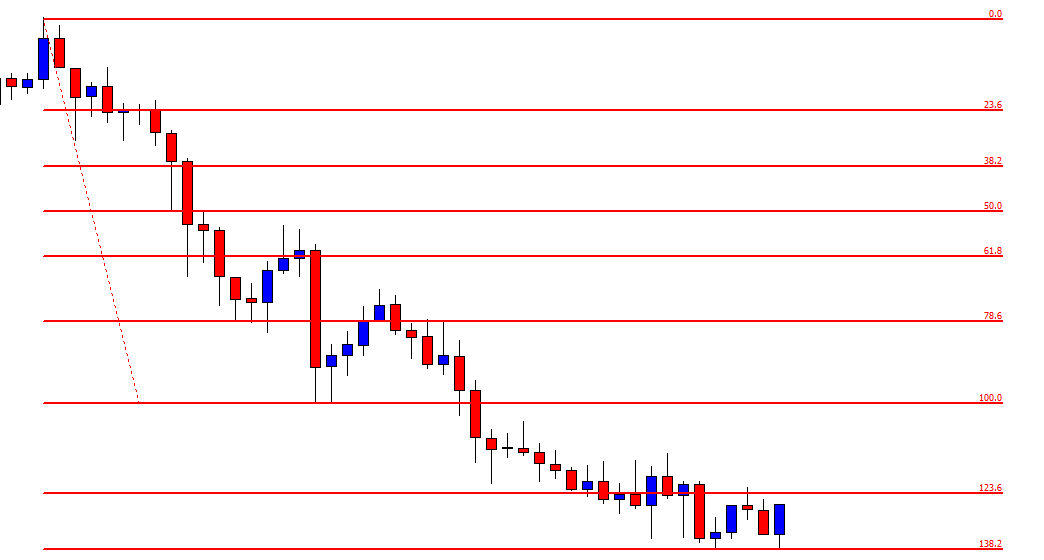
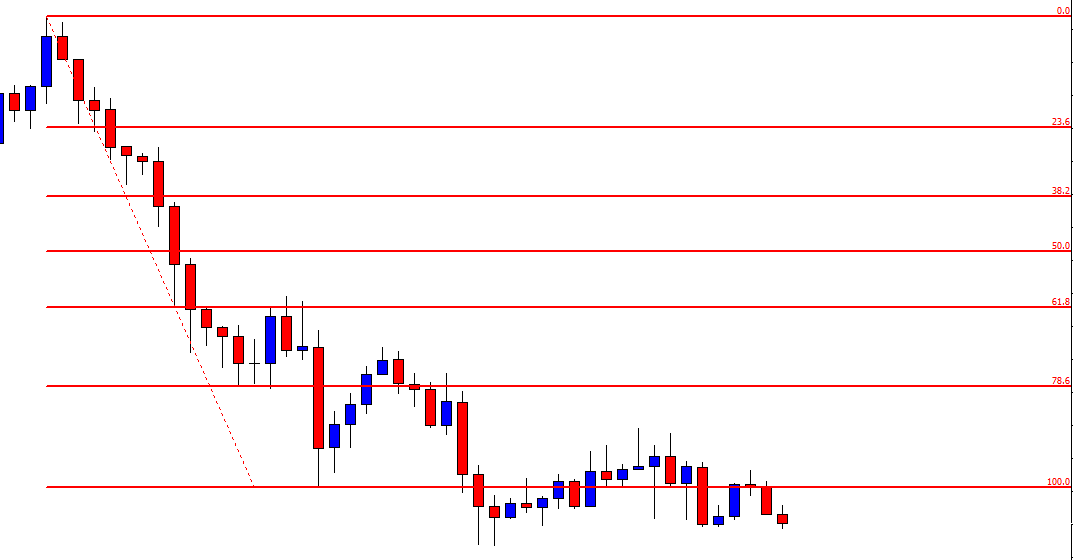
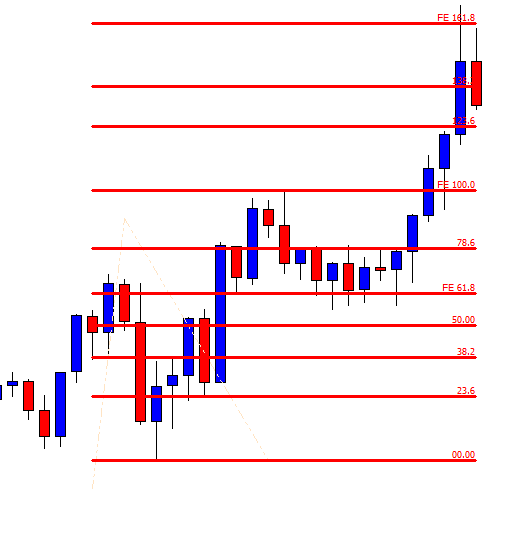
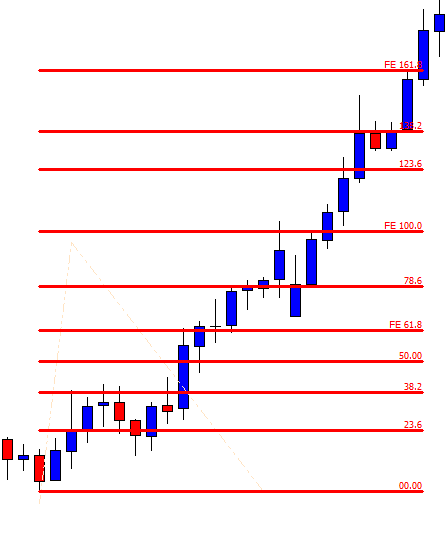
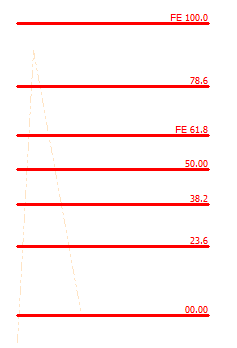
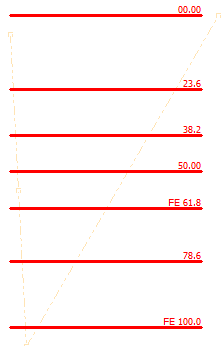
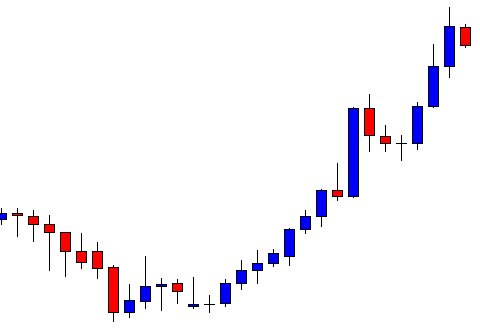
The chart shows that the price trends from 78.6% level. When the level of 78.6% makes the price move, it usually makes a reversal at 138.2%. Thus, if we set our take profit at 138.2%, we do not have to wait to get a bearish reversal candle to close our trade manually. It saves our time and gets us more pips too. This is why Fibonacci (extension/ retracement) is called a magic trading tool, since it helps traders in taking and exiting with precision.

Categories
Forex Daily Topic Forex Fibonacci

Intraday Trading: How Fibonacci Levels Help You Determine Entry and Take-Profit Levels

In today’s lesson, we are going to learn an intraday trading strategy using the previous day’s highest high or lowest low. When the price makes a breakout at yesterday’s highest high or lowest low, the price usually trends towards the breakout direction. In today’s lesson, we are going to demonstrate an example of a bearish breakout. After making a bearish breakout at the previous day’s lowest low, the price consolidates and produces a bearish engulfing candle at a significant Fibonacci level. Then, it heads towards the South with good bearish momentum. We try to find out the Fibonacci level where the price trends from as well as the take profit level where the price may make a reversal. Let us proceed.

This is an H1 chart. The chart shows that the price makes a bearish move by producing an ABC pattern. The last candle closes the trading session at the lowest low of the day. The next chart shows that the price consolidates around the lowest low of the previous trading day and makes a good bearish move.

The chart suggests that it becomes intraday sellers’ territory. The sellers may look to go short in the pair. The question is how and when. Let us find these two answers.

The last candle comes out as a bullish candle. Since the chart has been bearish, the sellers may wait for the chart to produce a bearish reversal candle to go short below consolidation support. Here is another equation that they must consider. We will find that out in a minute.

The chart produces a bearish engulfing candle. The sellers may trigger a short entry right after the last candle closes. A question may be raised here that the chart produces a bearish engulfing candle earlier right at the breakout level. We have not concentrated on that to go short from there. However, we have planned to go short right after the last candle closes. What are the reasons behind this? Let us find out how the price reacts after the last candle is produced.

The price heads towards the South with good bearish momentum. The chart produces a bullish reversal candle. It may change its trend or make a bullish correction, at least. For intraday traders, they cannot afford to wait as many pips by waiting to get a bullish reversal candle. They are to close the trade right after the last bearish candle. The question is, how would they know that they should set their take profit at that level?

The answer is Fibonacci levels. Do you remember I was talking about the level for the price to resume its bearish move, we find that out by Fibonacci levels as well. See, the chart produces a bearish engulfing candle at the level of 61.8%, and it hits 161.8%. These are two levels intraday traders must count when a pair trades below the previous day’s lowest low or vice versa. Stay tuned for more lessons for intraday trading with Fibonacci levels.

Categories
Forex Daily Topic Forex Fibonacci

Tweezer Top/Tweezer Bottom and Fibonacci Levels

In today’s lesson, we are going to demonstrate an example of a Tweezer Top forming at a significant Fibonacci level. We’ll find out the impact of a tweezer top in the chart. Let us get started.

The chart shows that the price has a rejection at a level of resistance twice. At the second bounce, it produces a doji candle. A doji candle is not considered a strong reversal candle. If the next candle comes out as a bearish engulfing candle, the sellers may keep their eyes in the pair to look for short opportunities.

The next candle comes out as a bearish engulfing candle. It makes a strong statement that the bear has taken control. Double top support, along with a bearish engulfing candle, usually attracts more sellers to look for short opportunities.

The price consolidates and finds its resistance. The chart produces a bearish engulfing candle. The sellers may go short right after the last candle closes with 1R. Let us proceed to the next chart to find out how the entry goes.

The chart shows that the price heads towards the South with good bearish momentum. It hits 1R at a moderate pace. It finds its support again and heads towards the North to make a bullish correction. Look at the last two candles. The first candle comes out as a bullish candle, and the last candle comes out as a bearish candle, both having a long upper shadow. The combination of these two candles is called “Tweezer Top”. Tweezer Top is considered one of the strongest bearish reversal patterns. Those two upper shadows suggest that the price has a strong rejection at the level of resistance. The bearish body of the last candle suggests that the bear may take over. Another point we may consider whether it is produced at a significant level or not. By drawing the Fibonacci extension, we may find this out. Let us draw Fibonacci extension and find out how far the price travels towards.

We see that Tweezer Top is formed right at the 61.8% level. Usually, the 61.8% level drives the price towards the level of 161.8%. This is what happens here, as well. The price hits the level of 161.8% within the next candle.

We know how handy drawing Fibonacci level can be in trading. Especially, 61.8% and 38.2% level plays a very significant role in driving the price with good momentum. If we get a strong reversal pattern such as Tweezer Top or Tweezer Bottom, it adds more pressure. Thus, the traders do not have to wait long to achieve their target.

Categories
Forex Fibonacci

It is Not Always the Level, It is about the Zone

In today’s lesson, we are going to demonstrate an example of a chart where the price makes a strong move from the 61.8% Fibonacci level. However, in this example, things are slightly different. We know the world is not perfect; neither is the Forex market. Today’s lesson is going to show that. Let us get started.

The chart shows that the price makes a strong bearish move. After that, the price may have found its support. The last candle comes out as a bearish candle with a long lower shadow. The price may make a bullish correction and, then, a bearish breakout at the lowest low of the wave to offer a short entry.

The price makes its bullish correction. Upon producing a doji candle followed by a bearish Marubozu candle, it heads towards the South. The last candle closes within the level of support, where the price gets a rejection earlier. The sellers are going to eagerly wait for a bearish breakout.

The price makes a breakout at the lowest low of the wave, consolidates, and produces a bearish reversal candle. The sellers may trigger a short entry right after the last candle closes by setting Stop Loss above consolidation resistance. We talk about Take-profit in a minute. Let us find out how the entry goes.

The price heads towards the South with extreme pressure. It seems like the Bear is in a real hurry to hit the target. It produces only one bullish candle before the last one. The last candle comes out as a bullish inside bar. Typically, it suggests that the chart is still bearish biased. We find that out whether it really is or is it time for the sellers to come out with their profit. Let us draw Fibonacci levels.

Here it is. Despite producing an inside bar, the price heads towards the North for a bullish correction. It may change the trend as well. The reason for this is the price hits 161.8%. Typically, the price makes a reversal once it hits 161.8% of an existing trend when the trend starts from 61.8%. The question is whether the price really trends from 61.8% or not? If you closely look at the chart, the price does not hit 61.8%, but it trends from well below. Nevertheless, it trends from the zone of 61.8% to 78.6%. As long as the price trends from that zone, the Fibonacci traders consider that it trends from 61.8%. This is what makes the price behave as if it trends right from the  Fibonacci level of 61.8%. When it trends from there, we know where to set our Take Profit. Yes, it is to be set at 161.8%.

Categories
Forex Fibonacci

Fibonacci Trading: How Fibonacci Levels Give Clues to the Traders

In today’s Fibonacci lesson, we are going to demonstrate an example of a chart, which makes a bearish move. We dig into the charts and find out how we can take an entry based on Fibonacci levels and how the levels may help us giving clues to execute our plan. Let us get started.

The above figure shows an H1 chart. The chart shows that the price makes a bearish move at a moderate pace. It seems that the price finds its support. It has been having consolidation around the level of support having bounces three times. The last candle in this chart comes out as a bullish Marubozu candle. This may push the price towards the North. However, the sellers may still have the hope that they may get a bearish breakout here. Let us proceed to the next chart to find out what the price does.

The chart produces a bearish engulfing candle breaching the level of support. The pair trades for two more candles after the breakout. An important point is to be noticed here that the price is having an upside correction after the breakout. Sometimes price keeps trending after a breakout, whereas sometimes price makes the correction. Fibonacci levels have an important role to play in this. Thus, if we use Fibonacci levels, we are able to find out whether the price trends or makes correction well ahead. Let us now find out how we take the entry. We are to flip over to the minor chart. Since this is an H1 chart, we may flip over to the 15 M chart to trigger the entry.

Look at the arrowed candle. The candle comes out as a bearish Marubozu candle forming track rail. The candle is formed right at a flipped resistance. A short entry may be triggered right after the arrowed candle closes. The chart also shows how the price heads towards the South after the signal candle. Let us now see the H1 chart with Fibonacci levels.

The chart shows that the price trends from 78.6% level. Thus, it may reverse at 138.2%. It hits 161.8% here. However, we may set our target at 138.2% if the price trends from 78.6% to be safe. The Stop Loss may be set here above 100.0 Fibonacci level.

These are the things we must remember when we trade a chart trending from a 78.6% level.

  1. The price may make a reversal at 138.2.
  2. If the price trends from 78.2%, it most probably makes a correction after the breakout. Otherwise, it does not give a good risk-reward as well.


Categories
Forex Fibonacci

Determining Higher Highs or Lower Lows to Draw Fibonacci Levels

Fibonacci levels are obtained by using higher highs or lower lows. A chart may have many higher highs/lower lows. Thus, Fibonacci levels can be obtained at different levels. A trader may find it difficult to spot out the levels where the price may react. In today’s lesson, we are going to see how different higher highs may lead us to having Fibonacci levels where the price does not react.

This is an H1 chart. The price heads towards the North with good bullish momentum before making a bearish correction. The point can be used to draw Fibonacci levels. The price then makes another bullish move and makes a new higher high. Some traders may want to use the last higher high to draw their Fibonacci levels. To make it clear, look at the chart below.

Some traders may use AB, while some others may use AC to draw Fibonacci levels. These two arms point out Fibonacci levels at different levels. Let us assume that we draw our Fibonacci levels by using AC.

The chart shows that the price after making the last higher high has started having a bearish correction. The buyers are to wait for the price to come at 78.6% level and make a breakout at the level of 100.0 to offer them a long entry. If the 78.6% is breached, 61.8% may do the same and offer them an entry as well. Let us proceed to the next chart to find out what happens next.

The price does not even come at 78.6%. It heads towards the North and makes a breakout at the level of 100.0. The price then never looks back. It hits the level of 161.8% in a hurry. The Fibonacci buyers do not find an entry here since the price does not trend from a 78.6% level. It trends way above the level of 78.6%.

Let us draw the Fibonacci levels with AB arm.

If we draw Fibonacci levels by using AB, we see that the price trends from 78.6% level. One candle breached through the level, but the next candle closes well above the level of 100.0. The buyers may set their target around 138.2% since it trends from 78.6%. However, it goes up to 161.8%.

To sum up the lesson, Fibonacci traders are to be well calculative at the time of selecting the first arm. With AC, there is no correction. The price trends towards the North straight. With AB, the price makes a correction and then makes another bullish move. Usually, a straight arm works well and provides accurate Fibonacci Fibonacci levels. Over here, we have seen that AB provides the Fibonacci levels, where the price reacts and help the buyers take a trading decision.


Categories
Forex Fibonacci

Fibonacci Trading: Be sure whether the Level is Held or Breached

Breakout plays a very vital role in the Forex market. Traders use breakout, breakout levels to make a trading decision. Fibonacci traders are to make sure whether a particular level is breached or it holds the price to make a better trading decision. In today’s lesson, we are going to demonstrate an example where Fibonacci traders may need to concentrate more to be sure about the Fibonacci level from where the price trends. Let us get started.

This is an H1 chart. The chart shows that the price makes a strong bearish move. It makes an upside correction followed by a strong bearish move again. The price has been having an upside correction again. Fibonacci traders are to draw the Fibonacci levels in the chart to find out where the price makes a bearish reversal and how far it may go up to.

Here are the levels. The chart shows that the price produces a bearish engulfing candle and heads towards the South with good bearish momentum. The question is whether the price trends from 78.6% or 61.8%. It is a vital issue since the price heads towards either 138.2% or 161.8% based on these two levels. If we concentrate on the chart, we see one of the bullish candles closes above the 78.6% level. However, the price comes back within the 78.6% level with the next candle. This means the H1 chart does not make a bullish breakout at 78.6%. The sellers may plan their entries to go short up to 138.2% in this chart. Let us proceed to the next chart to find out what price does.

The price breaches the 100.0 level and trades below for several candles. The sellers may wait for a bearish reversal candle and go short in the pair as long as they are satisfied with the risk-reward factor. Usually, it is best if the price goes back to the 100.0 level and produces a bearish reversal candle around the level as far as the risk-reward ratio is concerned. However, it may be produced anywhere between 100.0% to 123.6%. The sellers with different strategies may set their stop loss at different levels, but their last take profit level is to be set at 138.2 %. Let us proceed to the next chart to find out what the price does next.

The chart shows that the price hits 138.2%. As expected, it has been roaming around the level. It seems that the price may have found its support around 138.2% level, and it may make a bullish reversal. The sellers with Fibonacci levels have completed their mission with perfection.

Categories
Forex Fibonacci

Fibonacci Trading: When Momentum is Lacking

Traders wait for the price to trend from 61.8% Fibonacci level. This is what attracts more traders to trade, which generates good momentum. When the price trends from 61.8% level, it usually goes up to 161.8%. Since the price gets enough space to move, it offers better risk-reward. This is another reason that Fibonacci traders love to trade in a chart when the price trends from 61.8%. However, the Forex market is uncertain. We may see that the price does not head towards 161.8% with good momentum upon trending from 61.8% from time to time. In today’s lesson, we are going to demonstrate an example of this.

This is an H1 chart. The chart shows that the price heads towards the South with good bearish momentum. Upon producing a strong bearish candle, it starts having a bullish correction. Fibonacci traders shall get themselves ready by drawing Fibo levels on the chart to find out potential short opportunities in the pair.

Here it is. The chart shows that the price breaches 78.6% level and trades above the level for two more candles. This means the price is in 61.8% zone. If the price trends from here, it may go towards 161.8% level. Yes, it would be better if the price goes towards the North and trends right from the level 61.8%. Nevertheless, the sellers still are to count the move from 61.8% zone. The chart produces a bearish engulfing candle followed by a doji candle. Since the reversal candle comes out as a bearish engulfing candle forming from 61.8% zone, some sellers may trigger a short entry (some may wait for the price to breach the last lowest low). Let us proceed to the next chart to find out what the price does.

The price heads towards the South and it makes a breakout at the last swing low as well. The pair may get more short orders now. However, the price does not head towards the South. It seems that 161.8% level is far away for the price to reach. It does not usually happen but this is how the Forex market runs. It does not always run on a single equation. A question may be raised here what does a trader do with his entry? Since it is an H1 chart based entry, it must be left behind and let it decide its fate by setting Stop Loss and Take Profit accordingly.

Categories
Forex Fibonacci

Fibonacci Trading and Deeper Correction

In today’s lesson, we are going to demonstrate an example where the chart produces a reversal candle at a Fibonacci level, but the price does not head towards the trend’s direction. It then makes a deeper correction. It finds its new resistance and heads towards the trend’s direction with good momentum. Let us now have a look.

The price heads towards the South with excellent bearish momentum. It produces six consecutive bearish candles, four of them having solid long bearish bodies. The sellers are to wait for the price to make a bullish correction and to produce a bearish reversal candle at the value area. Let us proceed to the next chart.


The price makes a bullish correction and produces a bearish engulfing candle. However, the price does not make a bearish breakout. It rather goes towards the North again. The last two candles come out as bullish candles. The price goes towards the North further for a deeper correction.

The chart produces a bearish Marubozu candle. The combination of the last two candles is called Track Rail. The Track Rail is one of the strongest reversal signal candles. The sellers may keep their eyes on this chart with attention. The Fibonacci traders may draw their Fibonacci levels to find out which level it is trending from.

Let us proceed to the next chart to find out what the price does.

The chart produces another bearish candle and makes a breakout at the wave’s lowest low. The Sellers then take control of the pair and drive the price towards the South at an extreme pace. The last candle on this chart comes out as an inverted hammer. It suggests that the price may keep heading towards the South. However, do not forget that the chart produces a bullish Pin Bar as well, and the last candle closes within the level of support where the Pin Bar bounces off.

Anyway, let’s draw the Fibonacci level on the chart and see how the price reacts to some levels.

The chart gives us a clearer picture. At first, the price produces the bearish reversal candle at 78.6. The asset does not make a breakout. Instead, it goes towards the North and finds its resistance at 61.8. The level produces a bearish reversal candle followed by a breakout at the wave’s lowest low. The price then hits 161.8 level with ease.

If the price makes a breakout by trending from 78.6, it may not hit 161.8 level. The price usually reverses at 138.2 if it trends from 78.6. Stay tuned. We are going to study with some live examples on this soon.


Categories
Forex Fibonacci

Fibonacci Trading: How Fibonacci Levels Can be Used in Trading?

Fibonacci levels and price action around those levels give traders clue what they should do with their potential trade setup. The 61.8% level is the most significant level, which is paid attention by the traders to make a trading decision. The price usually goes towards the level of 161.8% when it trends from 61.8%. Since it creates enough space for the price to travel, different traders trade and make use of the wave-length in differently.  We will learn some other strategies that are integrated with Fibonacci levels. Meanwhile, let us demonstrate an example of a chart where the price reacts at 61.8% and trends towards 161.8% afterwards.

The chart shows that upon producing a double bottom, the price heads towards the North and makes a new higher high. The buyers are to wait for the price to make a bearish correction now.

The price heads towards the South upon producing a bearish inside bar. The last candle comes out as a bearish engulfing candle closing within a flipped support. Let us wait and see whether the level produces a bullish reversal candle.

The price produces three bullish candles at the flipped support. The last candle looks to be the strongest one. The price may head towards the North and makes a breakout at the highest high of the wave.

As expected, the price heads towards the North and makes a breakout at the highest high of the wave. The price continues its journey towards the North further. The last candle on the chart comes out as a bullish candle having a long upper shadow. Do you notice anything interesting here? Look at the next chart.

The price after making a bullish move, it starts having a bearish correction. The price consolidates around the 61.8% level. It produces a hammer and heads towards the North. It makes a breakout at the last highest high and heads towards the North with good bullish momentum. The price hits 161.8% as it usually does when it trends from 61.8% level.

Some traders go long in this chart before the price makes the bullish breakout. As long as 61.8% level produces a strong reversal candle, they trigger their entry. It provides an excellent risk-reward but less winning percentage. On the other hand, some traders trade once the price makes a breakout. This offers not that great a risk-reward but an excellent winning percentage.

Categories
Forex Daily Topic Forex Fibonacci

Draw Fibonacci Levels on Your Trading Chart

Fibonacci traders are to find out a good move, followed by a price correction. They keep their eyes on the 61.8% level with extreme attention. If the level of 61.8% produces a reversal candle, traders trigger for entry. Usually, the price goes up to the level of 161.8% if the price trends from 61.8%. This allows an excellent risk-reward to the traders as well. In today’s article, we are going to demonstrate an example of how the golden ratio of 61.8% plays such an important role in moving the market towards the trend. Let us get started.

The chart shows that it makes a bullish move upon producing a bullish engulfing candle. The price makes a downside correction and moves towards the North again. This time the price makes the move with good bullish momentum. The Fibonacci traders are to wait for the price to make a downside correction and draw Fibonacci levels to go long in the pair. Let us proceed to the next chart to find out whether it starts having downside correction or heads towards the North further.

This is an interesting move by the chart. It has a bearish gap, but the candle comes out as a bullish candle. Despite having an upper shadow, this is a bullish reversal candle. Let us find out how the price reacts upon getting such a bullish reversal candle.

The price heads towards the North with extreme bullish momentum. The bull outplays the bear. This is such a strong bullish move that the buyers would love to make full use of it. Do you notice something interesting? Yes, the price trends from the 61.8% zone. Let us draw the Fibonacci levels and see how it looks.

The chart shows that despite having a bearish gap, the chart produces a bullish candle within 61.8% zone and heads towards the North. It hits the level of 161.8% in a hurry as well. This is what the Fibonacci golden ratio level does almost all the time. There are different ways of trading and catch such a move. Some traders enter before the breakout, while some enter after the breakout at the highest high of the wave. Both have merits and demerits, which we will learn in our forthcoming Fibonacci lessons. Meanwhile, concentrate on your chart and practice drawing Fibonacci levels by pointing out the highest high and the lowest low. Start practicing this, so you get well acquainted with Fibonacci significant levels and how the price reacts to them. This will help you trade much better soon.

Categories
Forex Daily Topic Forex Fibonacci

Fibonacci Retracement: A Magic Trading Tool

Financial traders rely a lot on a tool called Fibonacci Retracement. This shows the percentage of retracement that the price makes after making a strong bullish/bearish move. The percentage of retracement is very significant to the traders. There are some particular levels, where the price reacts heavily and creates a new trend. Thus, financial traders use Fibonacci Retracement tool to measure retracement length and find the potential whether it is going to create a new trend or not. The Forex traders love using the Fibonacci Retracement tool as well. Once we know how to draw it on the chart accordingly, we find out that the currency pairs on almost all the timeframes obey the Fibonacci retracement ratio.

Leonardo Fibonacci, an Italian mathematician, identified a series of numbers such as 0, 1, 1, 2, 3, 5, 8. 13, 21, 34, 55, etc. Each number is the sum of the preceding two numbers.  These numbers produce some significant ratios, such as 23.6. 38.2, 50, 61.8. 78.6, 100, 123.6, 138.2, 161.8. These ratios and the Fibonacci sequence are found in nature as well. Thus, people love using the sequence ratios in their design and plan. At the end of the day, people run financial markets. They buy or sell at certain levels. Since Fibonacci ratios are much related to our nature and life, traders love using these ratios to help decide where to buy and where to sell.

As far as Fibonacci ratios are concerned, the 61.8 is considered as the golden ratio. It is found in flower petals, seed heads, pinecones, fruits and vegetables, tree branches, shells, spiral galaxies, hurricanes, fingers, animal bodies, reproductive dynamics, animal fight patterns, DNA molecule, etc.

In the financial/Forex market, the ratios are used by using a tool called Fibonacci Retracement. There are other Fibonacci tools, but this one may be the trader’s most favorite.

In a buying market, a trader draws his Fibonacci retracement levels from the lowest low to highest high.

The level of 00.00 is the lowest low, and the 100.00 is the highest high of a bullish wave. Traders are to wait for the price to make a bearish retracement. All these levels are significant, and the price reacts to these levels. However, the buyers pay more attention when the price is around 61.8 level to go long in a pair.

In a bearish market, it is just the opposite. Let us have a look at how it looks like.

Fibonacci Retracement levels help traders spout out the trend’s initiating point. Thus, it becomes easy for the traders to take entry with excellent risk-reward. In our forthcoming articles, we are going to demonstrate charts on different pairs, time frames to find out how the price reacts to different Fibonacci levels. Stay tuned.