Fibonacci Trading: Fibonacci Levels Help Traders be Precise
In today’s lesson, we are going to demonstrate an example of a chart where the price makes a bullish move from 78.6% Fibonacci level. The 78.6% Fibonacci level often makes the price reverse towards the trend’s direction. In today’s example, the price produces a Morning Star and heads towards the trend’s direction with good bullish momentum. Let us see how it happens.
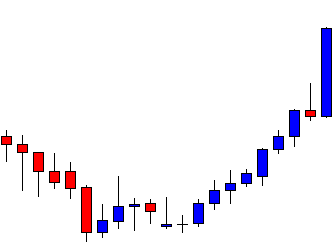
It is an H4 chart. The price produces double bottom and heads towards the North with good bullish momentum. On its way, it produces only a single bearish candle. The buyers are to wait for the price to make a bearish correction and to get a bullish reversal candle to go long with a good risk-reward in the pair.
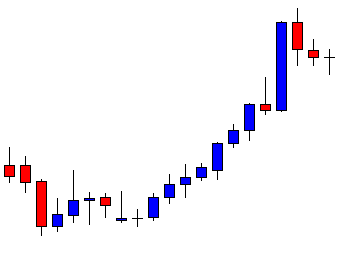
The chart produces a bearish inside bar. Then, it produces one more bearish candle. Look at the last candle. It comes out as a doji candle. It seems that the price may have found its support. A strong bullish reversal candle may attract the buyers to go long in the pair and push the price towards the North to make a new higher high.
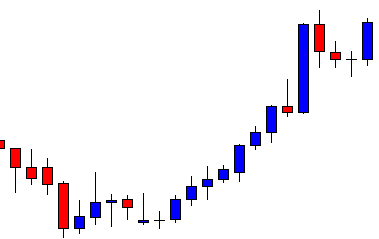
The chart produces a bullish engulfing candle. The combination of the last three candles is called Morning Star. This is one of the strongest bullish reversal patterns in the Forex market. The buyers may trigger a long entry right after the last candle closes. They may set stop loss below the signal candle’s lowest low. We’ll find out the take-profit level in a minute. Let us first see how the trade goes here.
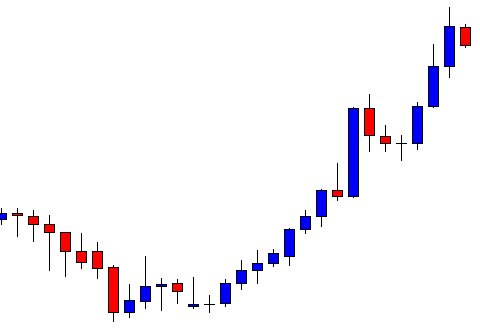
The price heads towards the trend’s direction with extreme bullish momentum. The last candle comes out as a bearish inside bar. It may make a bearish correction now. Some sellers may close their trade manually after the last candle. You may notice if they do that, they lose a few pips. How about if we knew that the price may make a bearish reversal from here before the last candle is produced. Yes, it is possible by using Fibonacci levels. Let us draw Fibonacci levels on the chart.
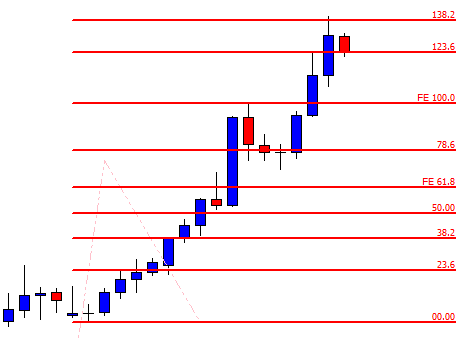
The chart shows that the price trends from 78.6% level. When the level of 78.6% makes the price move, it usually makes a reversal at 138.2%. Thus, if we set our take profit at 138.2%, we do not have to wait to get a bearish reversal candle to close our trade manually. It saves our time and gets us more pips too. This is why Fibonacci (extension/ retracement) is called a magic trading tool, since it helps traders in taking and exiting with precision.

