In today’s lesson, we are going to demonstrate an example of a chart where the price makes a strong move from the 61.8% Fibonacci level. However, in this example, things are slightly different. We know the world is not perfect; neither is the Forex market. Today’s lesson is going to show that. Let us get started.

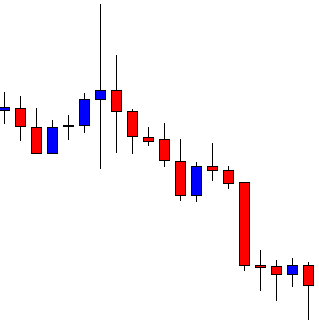
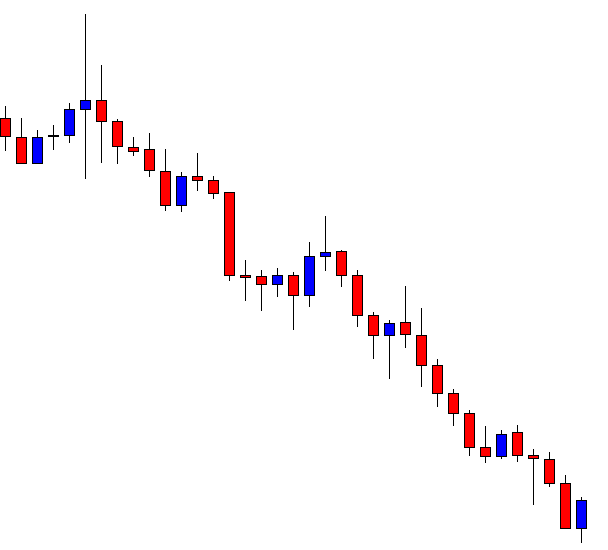
The chart shows that the price makes a strong bearish move. After that, the price may have found its support. The last candle comes out as a bearish candle with a long lower shadow. The price may make a bullish correction and, then, a bearish breakout at the lowest low of the wave to offer a short entry.
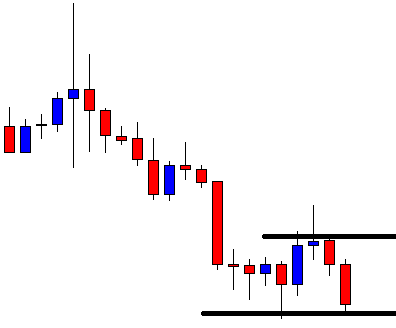
The price makes its bullish correction. Upon producing a doji candle followed by a bearish Marubozu candle, it heads towards the South. The last candle closes within the level of support, where the price gets a rejection earlier. The sellers are going to eagerly wait for a bearish breakout.
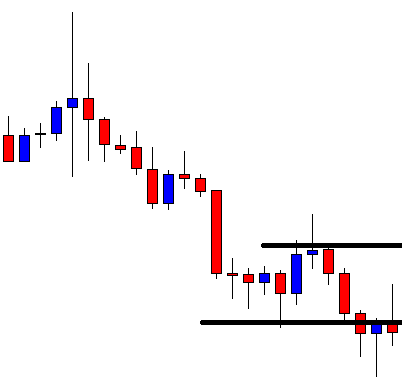
The price makes a breakout at the lowest low of the wave, consolidates, and produces a bearish reversal candle. The sellers may trigger a short entry right after the last candle closes by setting Stop Loss above consolidation resistance. We talk about Take-profit in a minute. Let us find out how the entry goes.
The price heads towards the South with extreme pressure. It seems like the Bear is in a real hurry to hit the target. It produces only one bullish candle before the last one. The last candle comes out as a bullish inside bar. Typically, it suggests that the chart is still bearish biased. We find that out whether it really is or is it time for the sellers to come out with their profit. Let us draw Fibonacci levels.
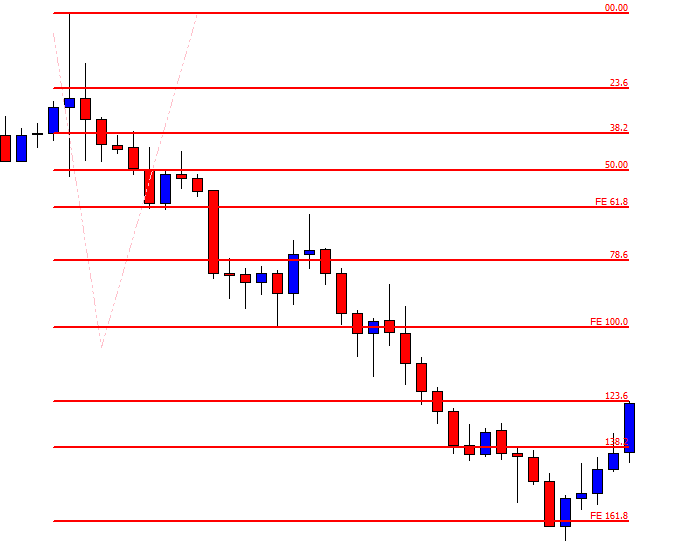
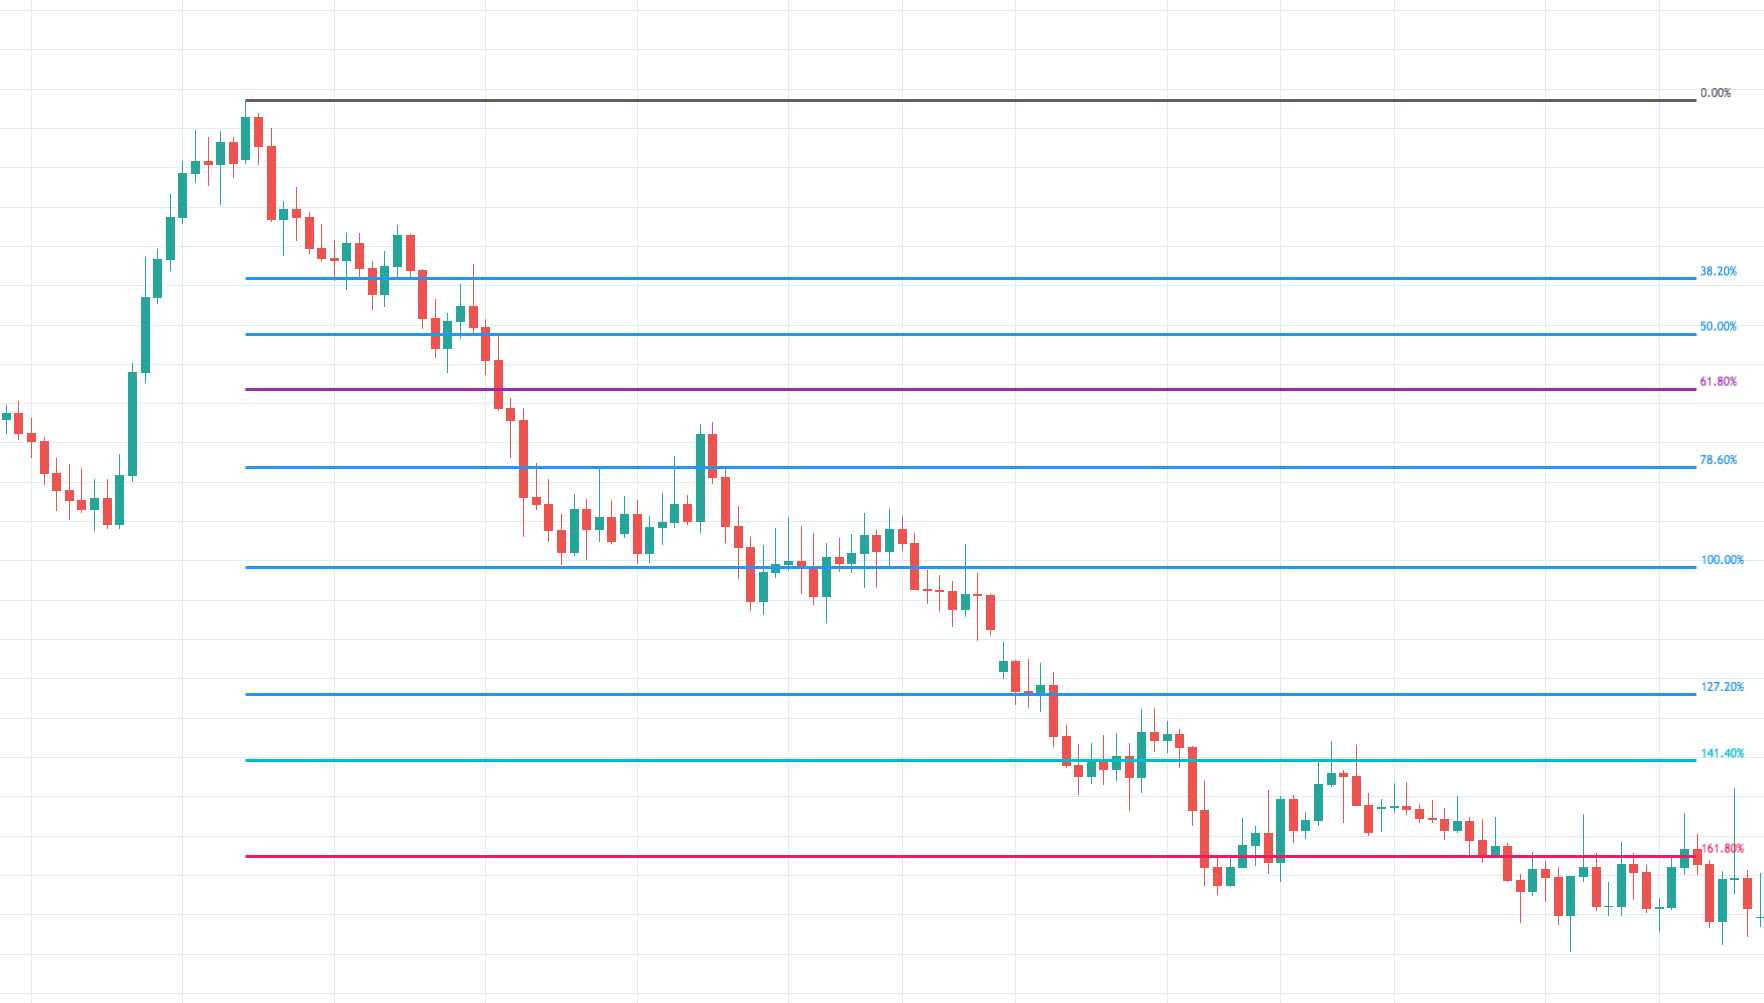
Here it is. Despite producing an inside bar, the price heads towards the North for a bullish correction. It may change the trend as well. The reason for this is the price hits 161.8%. Typically, the price makes a reversal once it hits 161.8% of an existing trend when the trend starts from 61.8%. The question is whether the price really trends from 61.8% or not? If you closely look at the chart, the price does not hit 61.8%, but it trends from well below. Nevertheless, it trends from the zone of 61.8% to 78.6%. As long as the price trends from that zone, the Fibonacci traders consider that it trends from 61.8%. This is what makes the price behave as if it trends right from the Fibonacci level of 61.8%. When it trends from there, we know where to set our Take Profit. Yes, it is to be set at 161.8%.