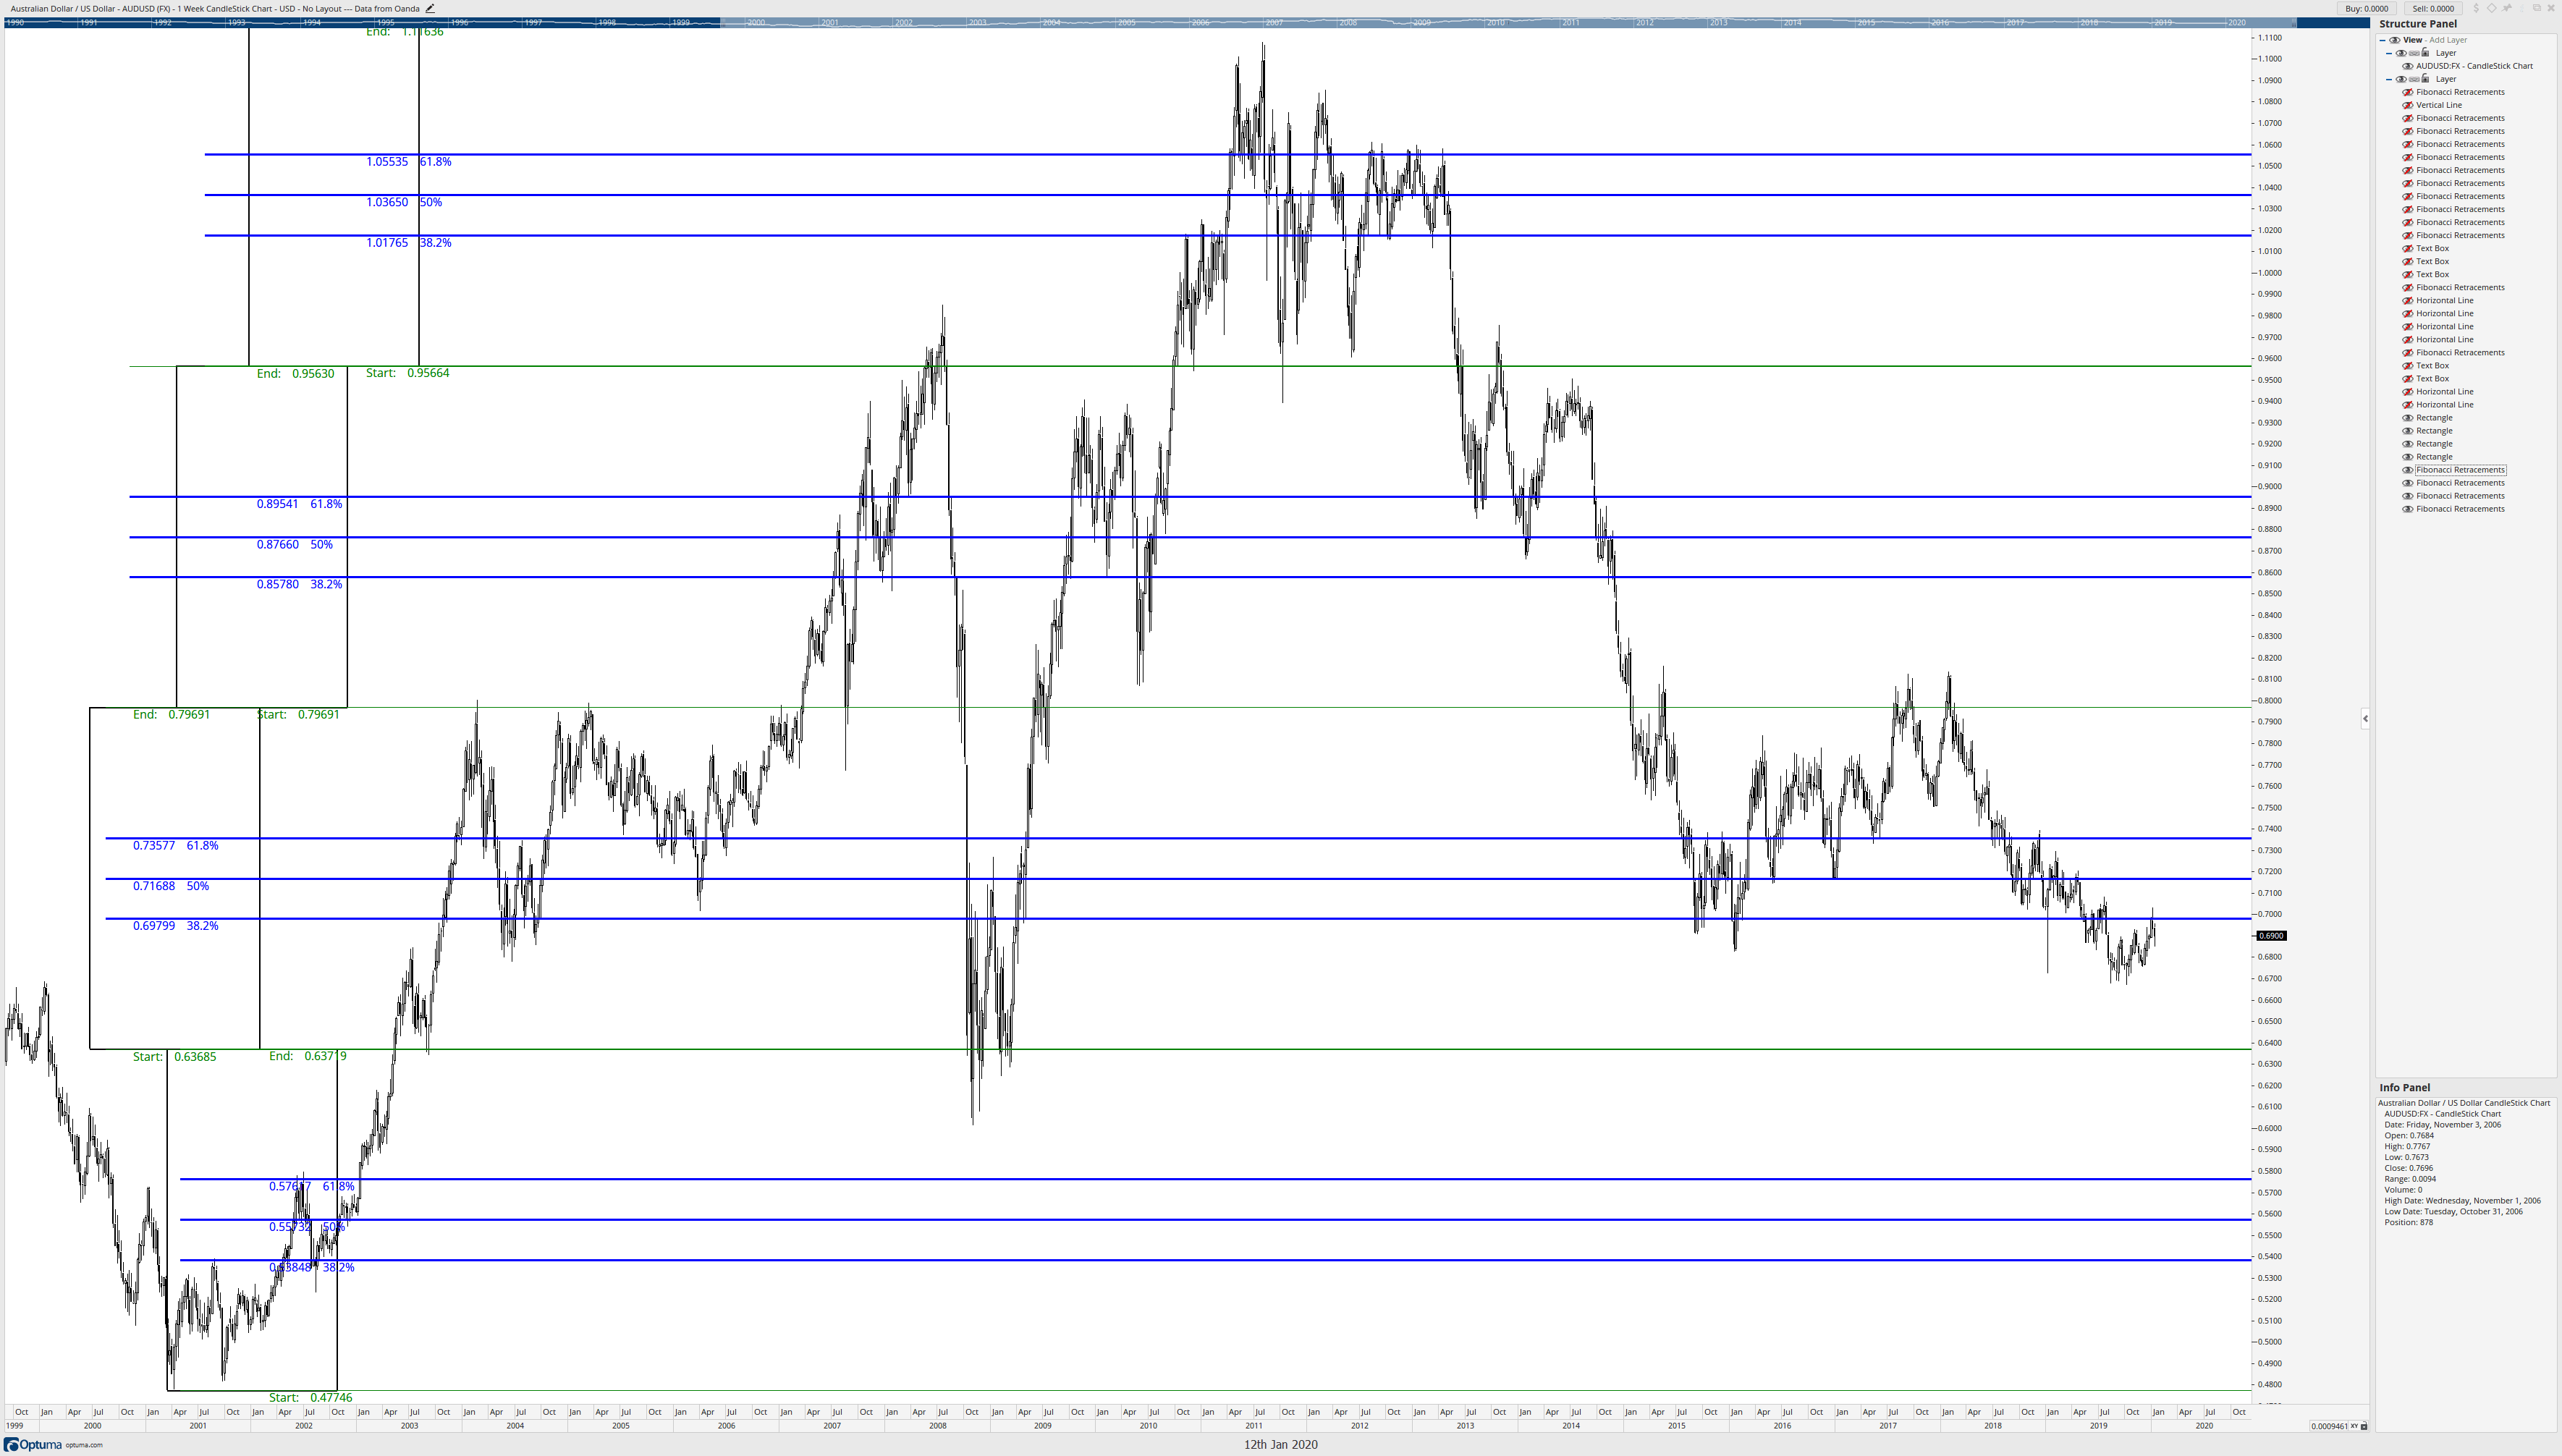
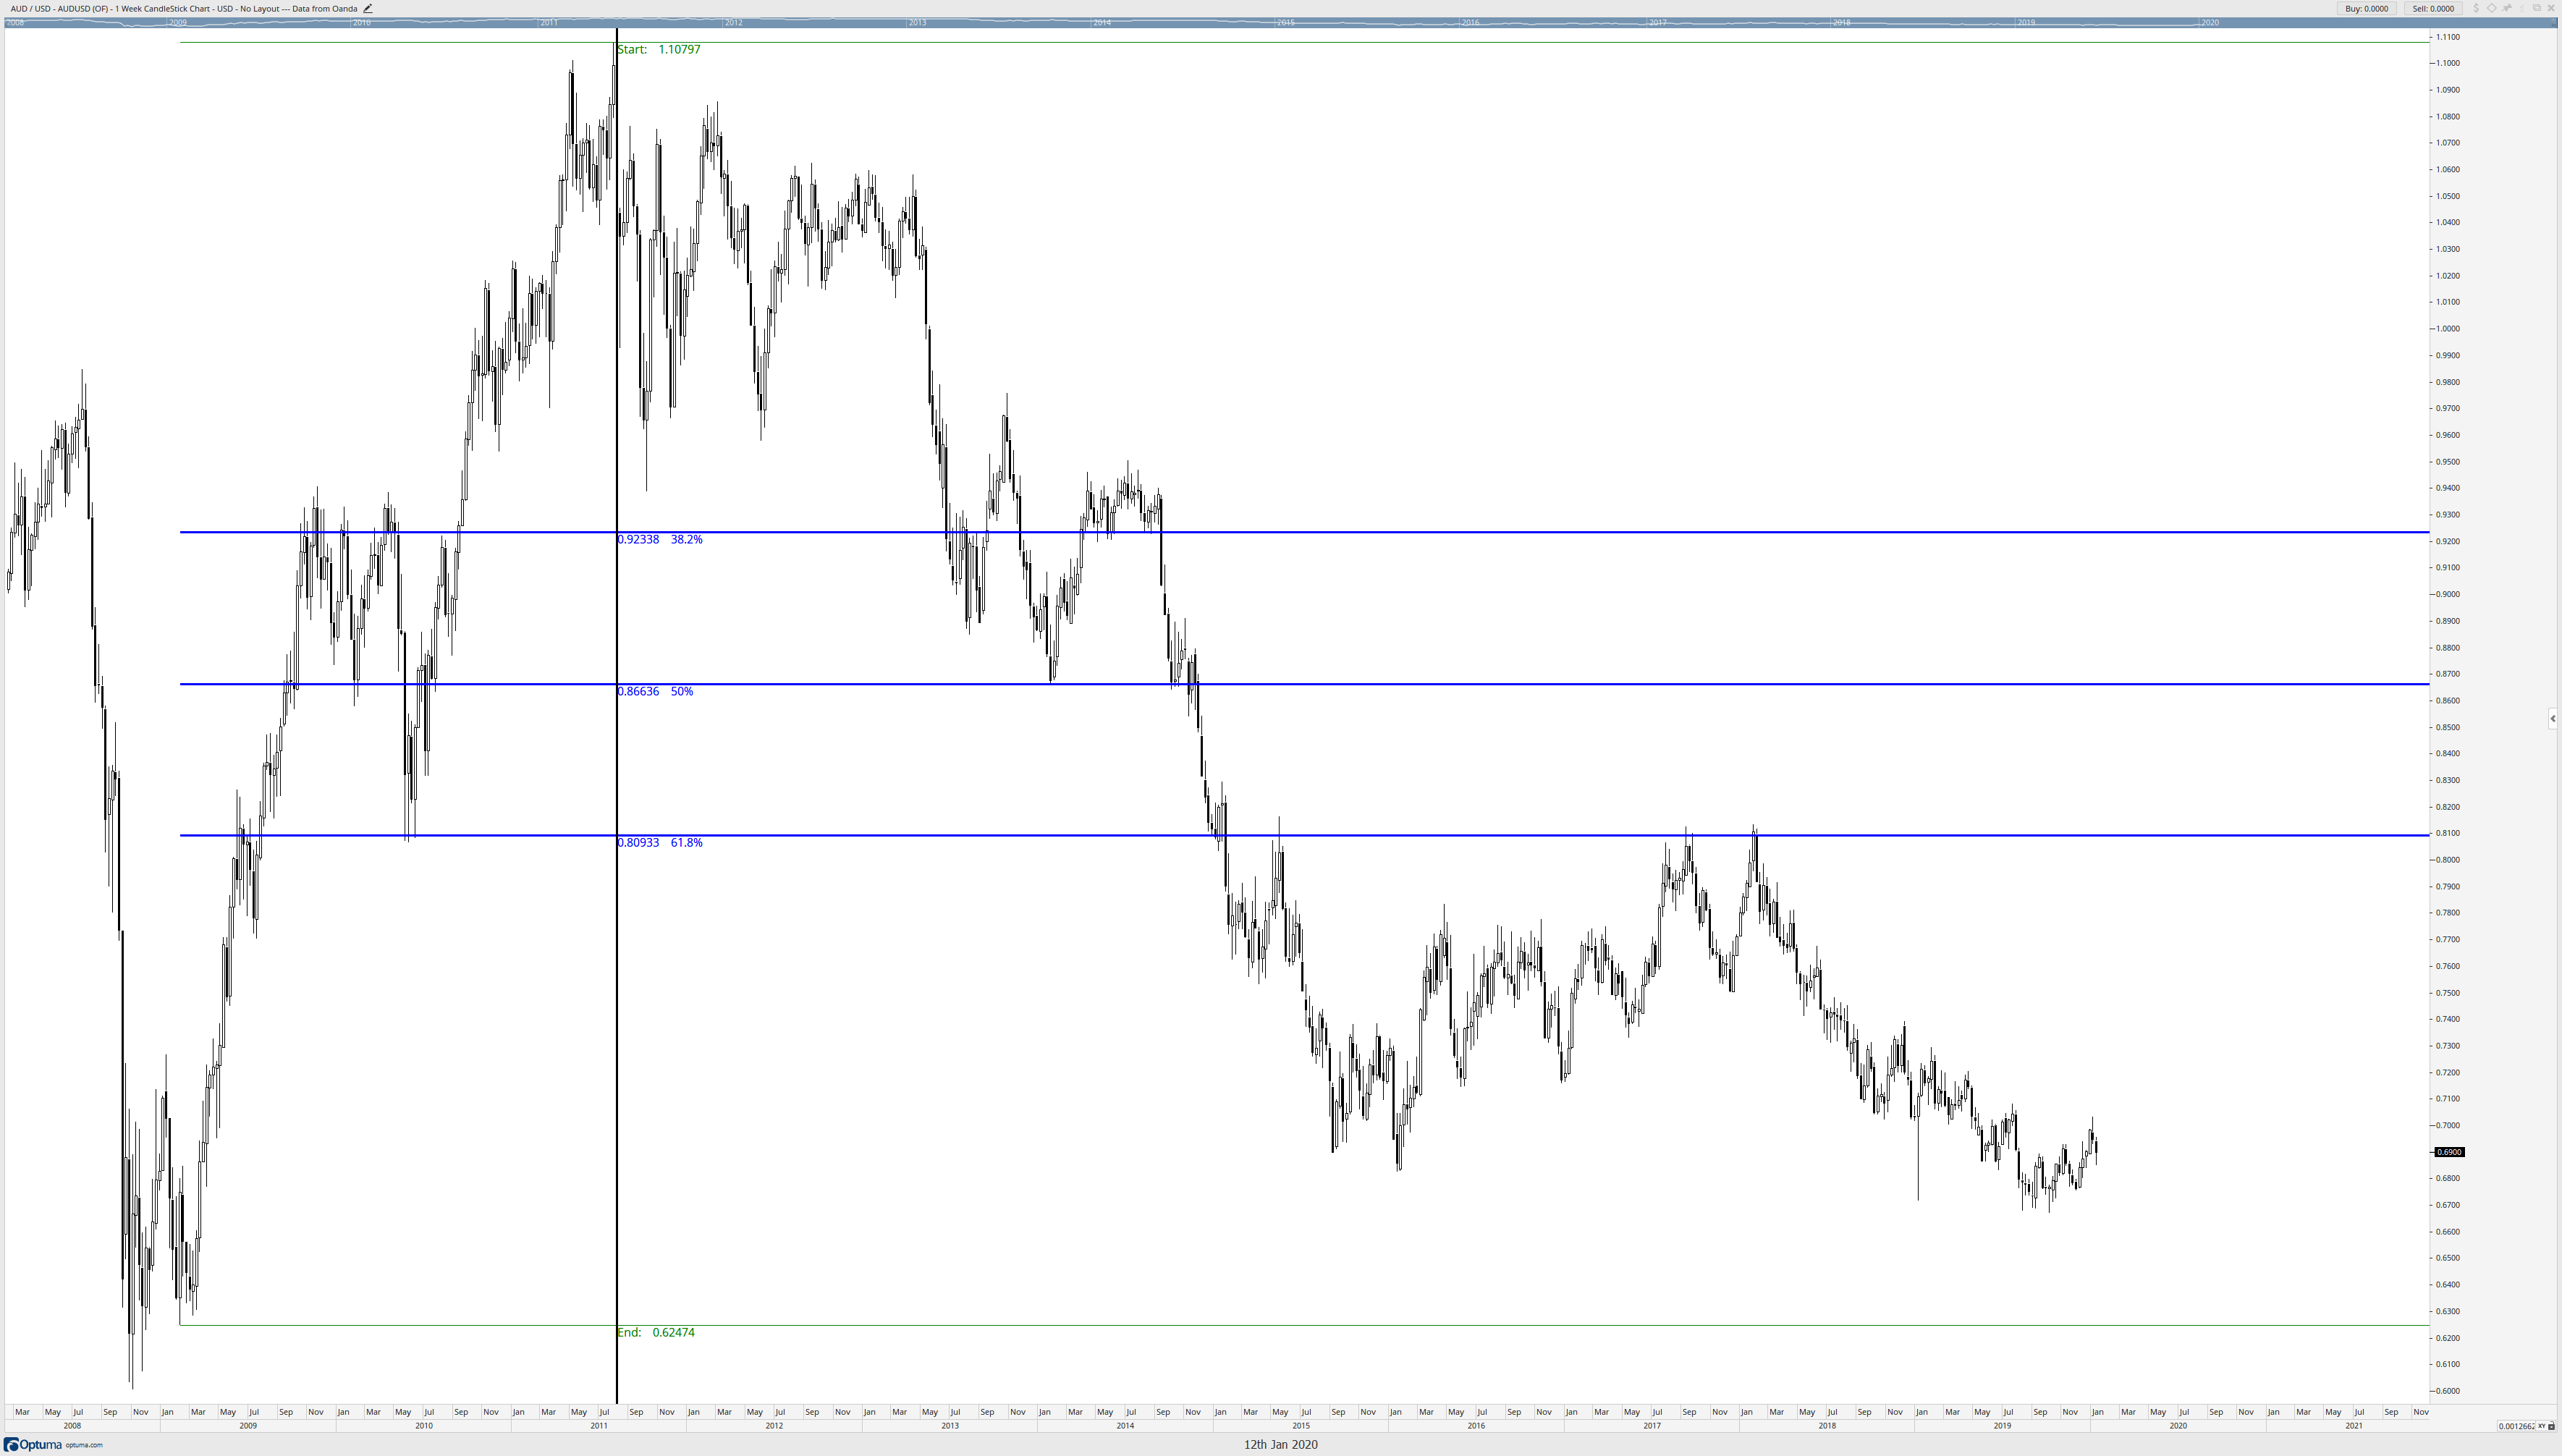
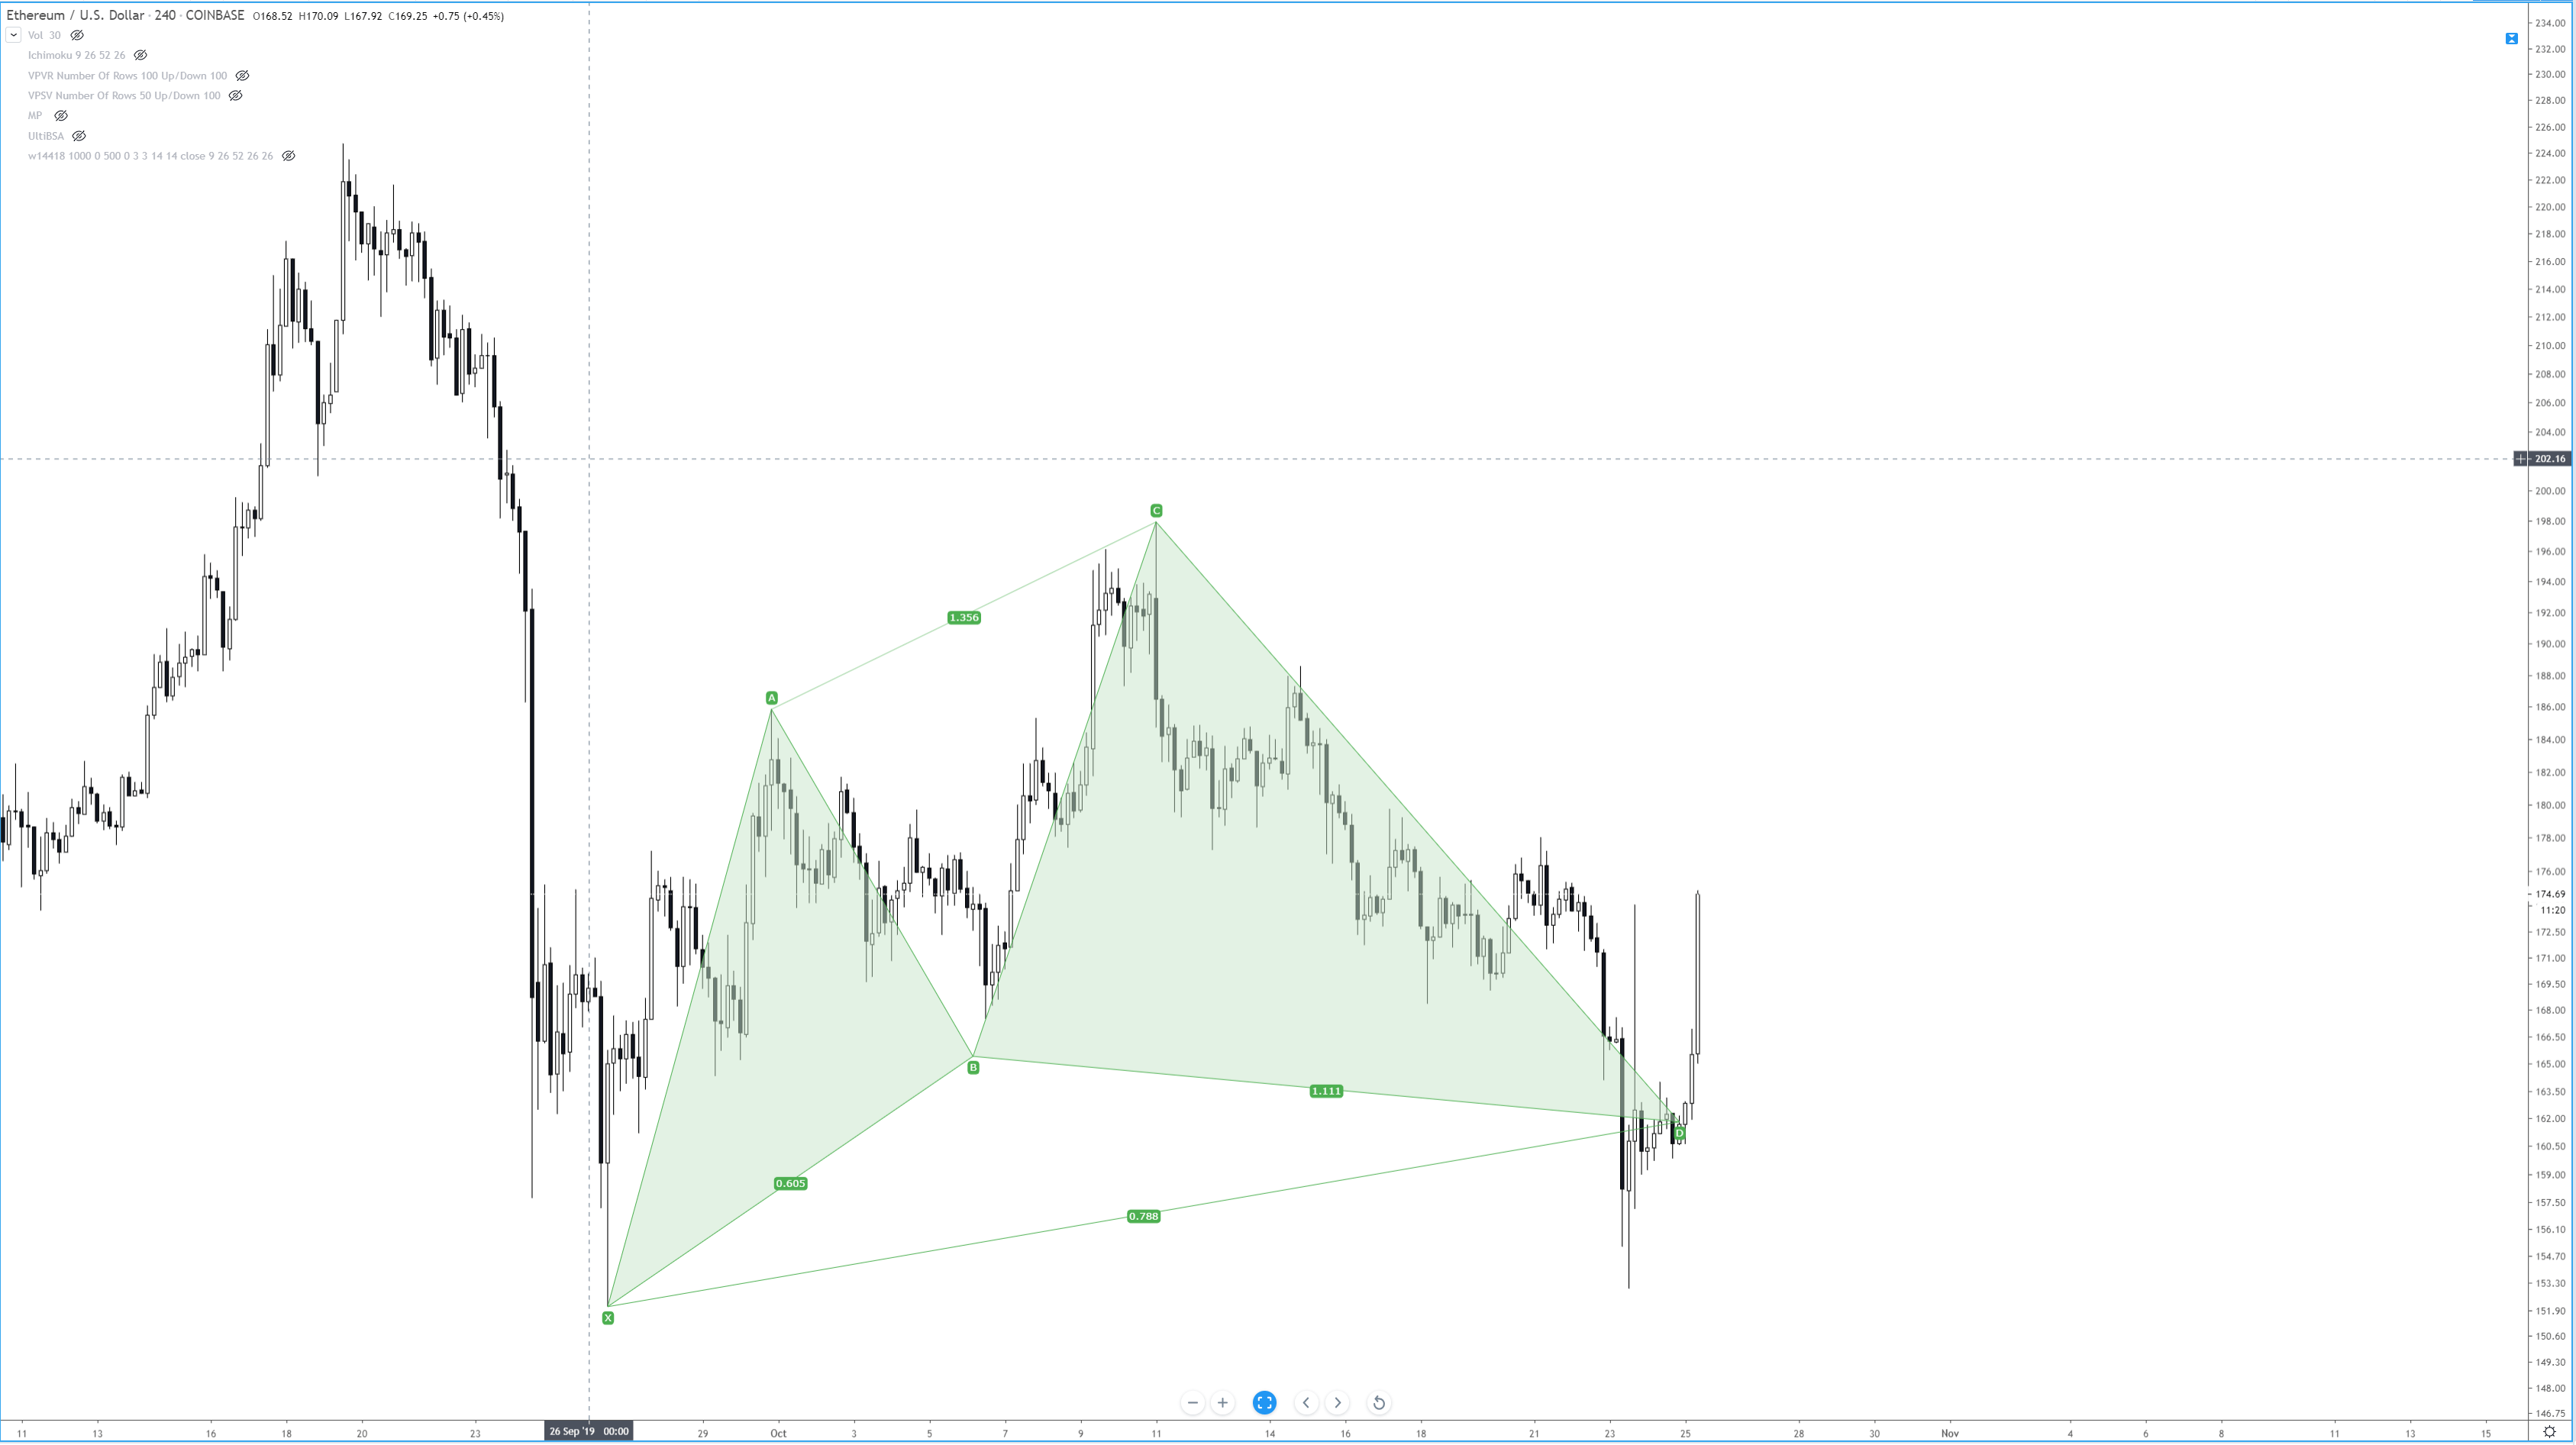
In today’s lesson, we are going to demonstrate an example of a daily-H4 chart combination trading. We also find out how the price reacts to Fibonacci retracement levels and how Fibonacci levels may help us determine risk-reward. Let us start with the daily chart.
In today’s lesson, we are going to demonstrate an example of a daily-H4 chart combination trading. We also find out how the price reacts to Fibonacci retracement levels and how Fibonacci levels may help us determine risk-reward. Let us start with the daily chart.
In today’s lesson, we are going to demonstrate an example of a daily-H4 chart combination trading. We also find out how the price reacts to Fibonacci retracement levels and how Fibonacci levels may help us determine risk-reward. Let us start with the daily chart.
This is the daily chart. The chart shows that the price heads towards the North with good bearish momentum and crosses a long way. The last candle comes out as a spinning top with a bullish body. It is a bullish reversal candle, but not a strong one. Let us flip over to the H4 chart and see how it looks.
The chart shows that it produces a morning star. It is a strong bullish reversal pattern. The last candle comes out as a bullish inside bar. The buyers may wait for the price to find its support and produce a bullish reversal candle to go long on the chart.
The price heads towards the South to have a bearish correction. The last candle comes out as a Doji candle. It seems that the price may have found its support. It may not take long to produce a bullish reversal candle.
As expected, the chart produces a bullish engulfing candle closing well above the last swing low. Traders love to have a signal candle like this to trigger an entry. It usually attracts more traders to trade and brings more liquidity. However, here is an equation that we must remember. When the price makes a correction, it is good for the traders to have an engulfing candle as a signal candle closing within the last swing low. It offers the price to travel more space towards the trend. However, when the price consolidates, it must make a breakout at the last support/resistance, though. Let us find out how the price moves after that bullish engulfing candle.
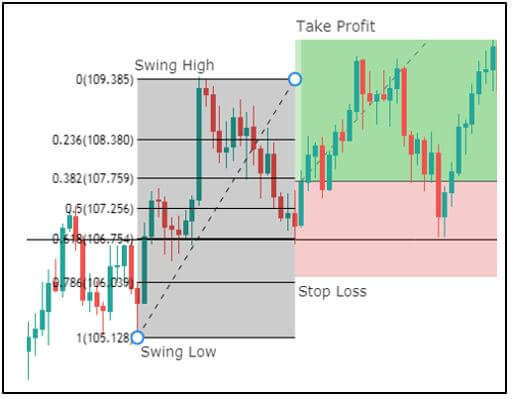
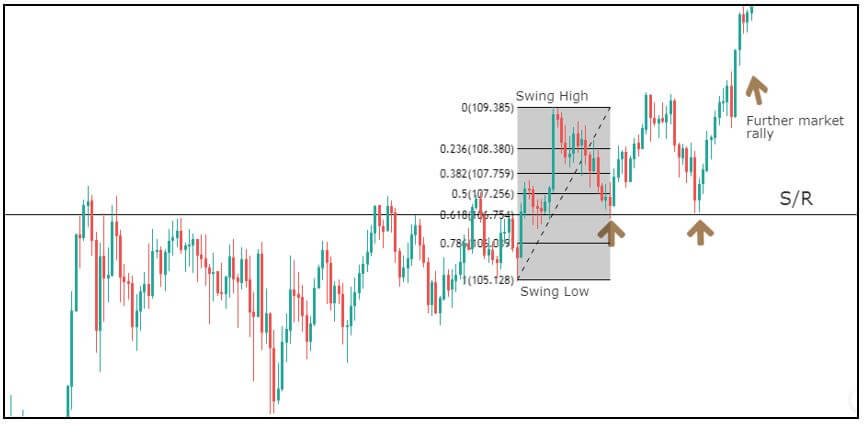
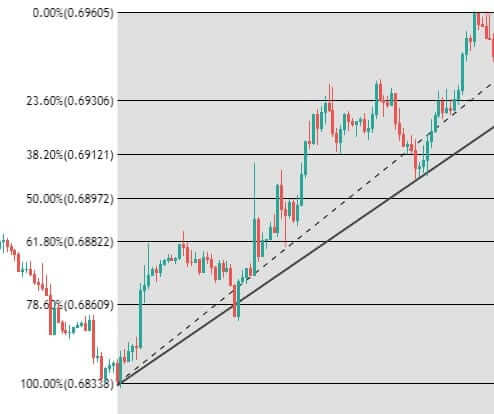
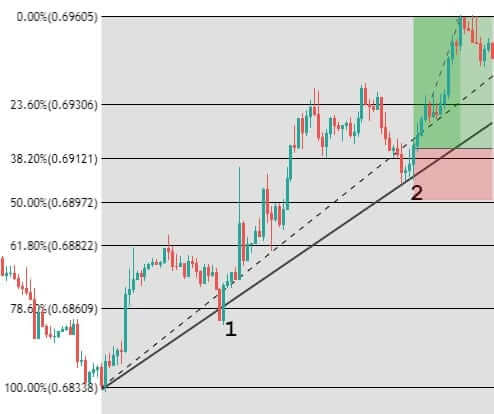
The price heads towards the North with a sluggish pace. Moreover, the price gets caught within two horizontal levels for several candles. It seems that the price is struggling to go towards the North further. Let us draw Fibonacci levels and try to find out the reason behind it.
The chart produces the signal candle at the 61.8% level, which is fantastic. Usually, the price goes towards the level of 161.8% if it trends from the 61.8% level. Over here, the candle closes at 123.6% level, which means the price does not have enough space travel. This is why the price moves towards the North sluggishly. Fibonacci levels help us determine where to set stop loss and take profit. It also helps us determine the risk-reward, which we must not forget.
In today’s lesson, we are going to demonstrate an example of a chart that makes a strong bullish move upon producing a bullish engulfing candle at a key Fibonacci level. We know an engulfing candle creates good momentum. If it is created at a significant Fibonacci level, it often pushes the price towards the trend […]
In today’s lesson, we are going to demonstrate an example of a chart that makes a strong bullish move upon producing a bullish engulfing candle at a key Fibonacci level. We know an engulfing candle creates good momentum. If it is created at a significant Fibonacci level, it often pushes the price towards the trend […]
In today’s lesson, we are going to demonstrate an example of a chart that makes a strong bullish move upon producing a bullish engulfing candle at a key Fibonacci level. We know an engulfing candle creates good momentum. If it is created at a significant Fibonacci level, it often pushes the price towards the trend further than traders’ expectations. Let us see and find out what and how that happens.
It is an H1 chart. The chart shows that the price heads towards the South. It keeps making new lower lows. At the last bounce, the chart produces a Morning Star. It may make a bullish reversal now. Let us wait and see whether it makes a breakout at the last swing high or not.
The chart produces four consecutive bullish candles. The price breaches the last swing high. The buyers may wait for the price to consolidate around the breakout level and get a bullish reversal candle to go long in the pair.
It produces a bearish candle closing within the breakout level. The buyers may keep their eyes sharp to see how the next candle comes out. A bullish reversal candle followed by a breakout at the highest high is the signal to trigger a long entry. If the reversal candle comes out as a bullish engulfing candle closing above the resistance, the buyers may trigger a long entry right after the candle closes.
The candle comes out as a bullish engulfing candle closing well above the resistance. The buyers may trigger a long entry right after the candle closes. Since it is an H1 chart, Fibonacci levels come extremely handy to determine the take profit level. We find out that in a minute. At first, let us find out what the price does.
The price heads towards the North with extreme bullish momentum. It produces only one bearish candle and resumes its bullish journey. With naked eyes, we can tell that the price travels about 4R. It means as far as risk-reward is concerned, it is an excellent deal. Let us draw Fibonacci and see price trends from where to where.
The price makes the bullish reversal at 61.8% and heads towards the level of 161.8% in a hurry. It makes a breakout at 161.8% consolidates and resumes its bullish move. Ideally, the buyers should set their take profit at 161.8%. It would allow them to take 1:2 risk-reward. However, we have seen here that the price travels towards the North even further than that. It often happens when the reversal candle comes out as a bullish engulfing candle, and it is produced at the key Fibonacci level at 61.8%. We may not be too greedy but set our take profit at 161.8% in such cases. However, back in our mind, we know that we are dealing with an excellent trade setup.
In today’s lesson, we are going to demonstrate an H1 chart offering an entry by using intraday support/resistance. To go with it, Fibonacci levels are used to spot out the stop-loss and take-profit levels. Let us now get started.
In today’s lesson, we are going to demonstrate an H1 chart offering an entry by using intraday support/resistance. To go with it, Fibonacci levels are used to spot out the stop-loss and take-profit levels. Let us now get started.
In today’s lesson, we are going to demonstrate an H1 chart offering an entry by using intraday support/resistance. To go with it, Fibonacci levels are used to spot out the stop-loss and take-profit levels. Let us now get started.
The chart shows that the price makes a long bearish move. The H1 chart makes a breakout at the last day’s lowest low (black drawn line). Usually, the chart attracts the sellers to look for short opportunities upon getting a bearish reversal candle. However, look at the combination of the last three candles. It is called Morning Star, which is one of the strongest bullish reversal patterns.
The price heads towards the North and goes back in the last day’s lowest low. Moreover, it makes a breakout at today’s highest high as well (black drawn line). Within four candles, the chart looks good for the buyers. The buyers may look to go long in the pair upon getting a bullish reversal candle at the breakout level.
The chart produces a bearish candle. The breakout level seems to hold the price as a level of support. A bullish reversal candle at the level may attract the buyers to go long and push the price towards the North further.
Here it comes. The chart produces a bullish engulfing candle right at the breakout level. The buyers may trigger a long entry right after the last candle closes by setting stop loss below the lowest low of the signal candle. We are going to talk about the take profit level in a minute. Let us find out how the trade goes.
The chart produces a bullish candle. The price heads towards the upside with the next candle as well. However, the candle comes out as a Doji candle having a long upper shadow. It suggests that the price may make a bearish correction or make a bearish reversal. Since the trade setup is based on the H1 chart, the buyers may lose a good number of pips if they are to wait for the chart to produce a reversal candle to close their entry. It is tough to manage trade in the H1 chart manually. Thus, setting the take profit is the best way. The question is, where should we set our take profit? In this regard, Fibonacci levels come extremely handy. Let us draw the Fibonacci levels in the chart and find out how they work in the chart above.
There you go. The price produces a bullish reversal candle at 61.8% level and heads towards the level of 161.8%. It means the buyers may achieve 1:2 risk-reward easily by using Fibonacci levels in intraday trading. In our fore coming lessons, we are going to demonstrate more examples of integration of Fibonacci levels and intraday trading. Stay tuned.
It may be an incredibly popular tool but not all forex traders are big fans of using Fibonacci, we’re here to take a look at why this might be the case. What Are We Talking About Here? This is no guide to using Fibonacci sequences in trading instead, it’s more a look at why some […]
It may be an incredibly popular tool but not all forex traders are big fans of using Fibonacci, we’re here to take a look at why this might be the case. What Are We Talking About Here? This is no guide to using Fibonacci sequences in trading instead, it’s more a look at why some […]
It may be an incredibly popular tool but not all forex traders are big fans of using Fibonacci, we’re here to take a look at why this might be the case.
What Are We Talking About Here?
This is no guide to using Fibonacci sequences in trading instead, it’s more a look at why some traders turn their noses up to this approach. That said, it doesn’t hurt to have a quick glance at how traders use this tool. Fibonacci numbers form sequences, inventively known as Fibonacci sequences, which are in turn closely related to the golden ratio. This is a phenomenon in mathematics that has been discovered throughout nature and statistical analysis and eventually made its way into different kinds of trading, including forex trading.
The most common use of Fibonacci in forex trading is to use Fibonacci retracement levels to throw up potential support and resistance lines across your chart that show places where the price might bounce back into a reversal. Put simply, the idea is to use these lines to assess where to enter a trade. In its most basic form, when the price is trending, it should retrace its steps occasionally to bounce off a Fibonacci level before it continues its trend and this is supposed to indicate an entry point.
So, What’s the Problem?
As you might have guessed, the growing anti-Fibonacci movement highlights several different problems with this approach.
The first of these is its abstraction. In other words, it is completely divorced from the realities of the market and relies entirely on an abstract pattern to try to locate trade entry points. There is no reason, the naysayers will tell you, why a mathematical sequence that has thrown up patterns in nature would have an effect or even any value for predicting the price movements of a currency pair. And, indeed, prediction is the name of the game here. Because using Fibonacci retracement levels is an attempt to predict future price movements. This is important and we’ll come back to it later in the article.
People who dismiss and reject the applicability of Fibonacci levels are likely to cite other reasons for price movement, including news events, the movements of the herd (that is the activities of the mass of traders who are often to be found trying to do the same thing at the same time), the sometimes pernicious activity of the influential players in the market, and so on. Of course, this has some weight behind – ultimately, there is no real connection between Fibonacci sequences and the movements of the market – the only connection is that Fibonacci levels and other similar approaches are supposed to guide you in analysing large statistical data sets. The price interactions of currency pairs as determined by the market are said to be such a set.
20/20 Hindsight
But there’s a problem inherent in that. This problem becomes particularly apparent when you take Fibonacci levels for a joyride through a historical chart. Choose any currency pair you like and take a look back through its price movements over a long period. Now try to find those times where Fibonacci levels would have been really useful in providing trade signals. The first thing you’ll notice is that the price regularly – and we mean regularly – just blows straight through any Fibonacci levels you care to put up. This is a problem for using it as an indicator of anything really. An indicator that doesn’t work some of the time is one thing, but one that hardly ever works is much more problematic for a trader.
More importantly than that, those times when it does appear to have worked, where the price is trending but then backtracks before bouncing off a Fibonacci line. Those times are, of course, going to be rare. But it’s not just their rarity that is problematic. It’s also the fact that they are often only noticeable when viewed retrospectively like this. In the heat of the moment, before the candles complete, it is much harder to spot a pattern emerging that could be predicted by a Fibonacci retracement. And prediction is important because that’s what this is all about. Using Fibonacci or any other tool in forex trading that fails to reliably predict where the price is going to be in the future is ultimately not just frustrating but also potentially very financially harmful. It’s just no good if somebody comes along and points out that the price of a given currency pair bounced off a Fibonacci line in the past. That’s old news and it’s no good to you. Remember, you have to make a decision while a Fibonacci-like pattern is still emerging… Or not, as the case may be.
Where Do You Draw the Line?
Another problem with using Fibonacci levels to trade is that there is no clear way of knowing when to stop using them. That is, when do Fibonacci lines stop being valid? Are you using the levels that are only relevant to the most recent swings (either high or low) or do you incorporate lines from further back? If so, how far back can you go before the lines you drew where the price simply crashed through them are no longer relevant? Or should you try to keep it as simple as possible and reduce the Fibonacci lines across your chart only to the most relevant?
The problem is, there are too many questions and too much of a danger of cluttering your chart with a haystack worth of meaningless lines. Because, if you draw enough lines across a chart, the price will definitely bounce off some of them somewhere but they will also lose all meaning. This fuzziness bothers a lot of traders and they will claim that it is for this reason that their opposite numbers – the traders who are committed to using Fibonacci – are constantly having to adapt their approach. The argument is that they have to keep modifying their approach because, at the end of the day, the Fibonacci levels lack clarity to the point that it becomes impossible to know whether they are working or whether they just look like they might be working.
A Little Success…
So why are Fibonacci levels even as popular as they are? Certainly one of the reasons lies in the forex traders’ version of that old saying, “a little knowledge is a dangerous thing” – for forex traders a little success is a deadly thing. Traders often start out by trying to use Fibonacci retracements because they’ve heard so many good things and, if they’re lucky, they might even see some early success in using them. The problem comes further down the road. Because, in the long term, using Fibonacci levels will slowly work less and less well, using them will mean an over-focus on one (potentially very flawed) tool while other tools and opportunities are missed. That early smell of success can be a powerful drug and draws traders into establishing patterns of behaviour that are ultimately harmful.
The Curse of Popularity
Of course, it isn’t always someone’s fault if they do give Fibonacci levels a go. The reason they might is that so many people out there on the forex internet are talking about them. Social media is particularly prone to promoting Fibonacci as though it’s the best thing since sliced bread. And there’s a reason for that, which is that posters can come off sounding very smart and knowledgeable indeed if they point out where price is approaching a Fibonacci level. Much rarer, to the point of being non-existent, are accounts that will come back and post an apology, where they say, “Hey, sorry, I said the price was approaching this and this line but it just crashed through as though the line wasn’t there.” Another thing you’ll almost certainly have noticed from forex-related social media accounts is that they will often point out where a Fibonacci retracement has taken place in the past. Unfortunately, this is of no use to anyone actually trying to trade like that because, once it’s happened there’s nothing to do other than appreciate its beauty – if you’re into that sort of thing. No actual use can be gleaned from pointing out historical occasions where a retracement has worked.
How to Proceed?
Whether or not you found the arguments in this article convincing is kind of irrelevant. The thing to do with any tool you encounter – whether it’s a popular one that everyone is shouting about from the rooftops or a niche tool you discovered through hard graft – is to test it yourself thoroughly. This is as true of Fibonacci retracements as it is for anything else. In that sense, it might also be useful or fun for you to wait until somebody on social media posts one of those cherry-picked examples of a Fibonacci retracement coming off perfectly and then go back and see if you can figure out what levels they were using.
If you do remain unconvinced and intend to carry on using Fibonacci approaches to trading, there is one other very important thing to be aware of. Those traders who have committed to this discipline and have made it work to one extent or another have done so by combining Fibonacci with a carefully selected set of other technical analysis tools. So, if you do plan to use Fibonacci retracements, make sure that you are ready to do so in a coordinated approach that also relies on other indicators and tools to help you assess whether your Fibonacci-based hunch is really likely to turn into the price movement you were hoping for.
Fibonacci Trading: Fibonacci Levels Help Traders be Precise
Fibonacci Trading: Fibonacci Levels Help Traders be Precise
Fibonacci Trading: Fibonacci Levels Help Traders be Precise
In today’s lesson, we are going to demonstrate an example of a chart where the price makes a bullish move from 78.6% Fibonacci level. The 78.6% Fibonacci level often makes the price reverse towards the trend’s direction. In today’s example, the price produces a Morning Star and heads towards the trend’s direction with good bullish momentum. Let us see how it happens.
It is an H4 chart. The price produces double bottom and heads towards the North with good bullish momentum. On its way, it produces only a single bearish candle. The buyers are to wait for the price to make a bearish correction and to get a bullish reversal candle to go long with a good risk-reward in the pair.
The chart produces a bearish inside bar. Then, it produces one more bearish candle. Look at the last candle. It comes out as a doji candle. It seems that the price may have found its support. A strong bullish reversal candle may attract the buyers to go long in the pair and push the price towards the North to make a new higher high.
The chart produces a bullish engulfing candle. The combination of the last three candles is called Morning Star. This is one of the strongest bullish reversal patterns in the Forex market. The buyers may trigger a long entry right after the last candle closes. They may set stop loss below the signal candle’s lowest low. We’ll find out the take-profit level in a minute. Let us first see how the trade goes here.
The price heads towards the trend’s direction with extreme bullish momentum. The last candle comes out as a bearish inside bar. It may make a bearish correction now. Some sellers may close their trade manually after the last candle. You may notice if they do that, they lose a few pips. How about if we knew that the price may make a bearish reversal from here before the last candle is produced. Yes, it is possible by using Fibonacci levels. Let us draw Fibonacci levels on the chart.
The chart shows that the price trends from 78.6% level. When the level of 78.6% makes the price move, it usually makes a reversal at 138.2%. Thus, if we set our take profit at 138.2%, we do not have to wait to get a bearish reversal candle to close our trade manually. It saves our time and gets us more pips too. This is why Fibonacci (extension/ retracement) is called a magic trading tool, since it helps traders in taking and exiting with precision.
In today’s lesson, we are going to learn an intraday trading strategy using the previous day’s highest high or lowest low. When the price makes a breakout at yesterday’s highest high or lowest low, the price usually trends towards the breakout direction. In today’s lesson, we are going to demonstrate an example of a bearish breakout. After making a bearish breakout at the previous day’s lowest low, the price consolidates and produces a bearish engulfing candle at a significant Fibonacci level. Then, it heads towards the South with good bearish momentum. We try to find out the Fibonacci level where the price trends from as well as the take profit level where the price may make a reversal. Let us proceed.
In today’s lesson, we are going to learn an intraday trading strategy using the previous day’s highest high or lowest low. When the price makes a breakout at yesterday’s highest high or lowest low, the price usually trends towards the breakout direction. In today’s lesson, we are going to demonstrate an example of a bearish breakout. After making a bearish breakout at the previous day’s lowest low, the price consolidates and produces a bearish engulfing candle at a significant Fibonacci level. Then, it heads towards the South with good bearish momentum. We try to find out the Fibonacci level where the price trends from as well as the take profit level where the price may make a reversal. Let us proceed.
In today’s lesson, we are going to learn an intraday trading strategy using the previous day’s highest high or lowest low. When the price makes a breakout at yesterday’s highest high or lowest low, the price usually trends towards the breakout direction. In today’s lesson, we are going to demonstrate an example of a bearish breakout. After making a bearish breakout at the previous day’s lowest low, the price consolidates and produces a bearish engulfing candle at a significant Fibonacci level. Then, it heads towards the South with good bearish momentum. We try to find out the Fibonacci level where the price trends from as well as the take profit level where the price may make a reversal. Let us proceed.
This is an H1 chart. The chart shows that the price makes a bearish move by producing an ABC pattern. The last candle closes the trading session at the lowest low of the day. The next chart shows that the price consolidates around the lowest low of the previous trading day and makes a good bearish move.
The chart suggests that it becomes intraday sellers’ territory. The sellers may look to go short in the pair. The question is how and when. Let us find these two answers.
The last candle comes out as a bullish candle. Since the chart has been bearish, the sellers may wait for the chart to produce a bearish reversal candle to go short below consolidation support. Here is another equation that they must consider. We will find that out in a minute.
The chart produces a bearish engulfing candle. The sellers may trigger a short entry right after the last candle closes. A question may be raised here that the chart produces a bearish engulfing candle earlier right at the breakout level. We have not concentrated on that to go short from there. However, we have planned to go short right after the last candle closes. What are the reasons behind this? Let us find out how the price reacts after the last candle is produced.
The price heads towards the South with good bearish momentum. The chart produces a bullish reversal candle. It may change its trend or make a bullish correction, at least. For intraday traders, they cannot afford to wait as many pips by waiting to get a bullish reversal candle. They are to close the trade right after the last bearish candle. The question is, how would they know that they should set their take profit at that level?
The answer is Fibonacci levels. Do you remember I was talking about the level for the price to resume its bearish move, we find that out by Fibonacci levels as well. See, the chart produces a bearish engulfing candle at the level of 61.8%, and it hits 161.8%. These are two levels intraday traders must count when a pair trades below the previous day’s lowest low or vice versa. Stay tuned for more lessons for intraday trading with Fibonacci levels.
In today’s lesson, we are going to demonstrate an example of an H1-15M chart, which made a good bullish move upon producing a bullish reversal candle at a key Fibonacci level. The H1 chart produces an H1 bullish engulfing candle earlier, but the price does not head towards the North. It takes time then produces another bullish reversal candle. It then heads towards the North with good bullish momentum. We try to find out why it does not make a bullish move at the first attempt but makes it at the second.
In today’s lesson, we are going to demonstrate an example of an H1-15M chart, which made a good bullish move upon producing a bullish reversal candle at a key Fibonacci level. The H1 chart produces an H1 bullish engulfing candle earlier, but the price does not head towards the North. It takes time then produces another bullish reversal candle. It then heads towards the North with good bullish momentum. We try to find out why it does not make a bullish move at the first attempt but makes it at the second.
In today’s lesson, we are going to demonstrate an example of an H1-15M chart, which made a good bullish move upon producing a bullish reversal candle at a key Fibonacci level. The H1 chart produces an H1 bullish engulfing candle earlier, but the price does not head towards the North. It takes time then produces another bullish reversal candle. It then heads towards the North with good bullish momentum. We try to find out why it does not make a bullish move at the first attempt but makes it at the second.
This is an H1 chart. The chart shows that the price makes a good bullish move and then makes a bearish correction. It consolidates for a while at a level of support and produces a bullish engulfing candle. The H1-15M combination traders may flip over to the 15M chart to trigger entry upon getting a 15M bullish candle. Let us find out what happens next.
This is the H1 chart too. The chart shows that the price produces a bearish engulfing candle instead. We have not flipped over to the 15M chart yet. Let us find out how the 15M chart looks.
This is the 15M chart. The chart shows that the price does not produce any bullish candle closing ahead of the H1 bullish reversal candle. Thus, the price heads towards the South. The last candle comes out as a bearish engulfing candle in the 15M chart. It does not look good for the buyers anymore.
The price consolidates with more candles. The last candle comes out as a bullish engulfing candle again. The chart produces the candle at the same level. The combination traders may flip over to the 15M chart again to look for entry. Let us find out what the 15M chart produces this time.
This is how the 15M chart looks. The buyers may wait for a 15M candle to close above the last H1 candle’s close. The chart suggests that the level of support is a strong one, which may push the price towards the North with good bullish momentum.
The last candle comes out as a bullish candle closing above the last H1 candle’s resistance. The buyers may trigger a long entry right after the candle closes by setting stop loss below the level of support. We find out the level take profit with the help of Fibonacci levels.
See how the price moves towards the North. The price makes a bullish move and makes a new higher high. It makes a bearish correction and then heads towards the North again. Let us draw the Fibonacci extension on the chart.
The Fibonacci level shows that the price hits 161.8%. It goes even further up. It makes a bearish correction before producing the last wave. The level of 100% works as a level of support.
We have seen how important it is that the 15M chart produces a bullish continuation candle to offer an entry. At the first reversal, the price does not head towards the North since the chart does not produce any 15M bullish continuation. On the second occasion, it produces a bullish continuation, and the buyers find an opportunity to go long and push the price towards the magic Fibonacci level of 161.8%
Introduction In our latest educational article, we discussed how a trading strategy based on a unique criterion as the 61.8% level of the Fibonacci retracement could increase the strategy’s risk. In this article, we will extend and propose alternatives that could help the technical trader improve its strategy performance. Recognizing the Risk of the 61.8% […]
Introduction In our latest educational article, we discussed how a trading strategy based on a unique criterion as the 61.8% level of the Fibonacci retracement could increase the strategy’s risk. In this article, we will extend and propose alternatives that could help the technical trader improve its strategy performance. Recognizing the Risk of the 61.8% […]
Introduction
In our latest educational article, we discussed how a trading strategy based on a unique criterion as the 61.8% level of the Fibonacci retracement could increase the strategy’s risk.
In this article, we will extend and propose alternatives that could help the technical trader improve its strategy performance.
Recognizing the Risk of the 61.8% Level as a Unique Criterion
In his work, Fischer and Fischer discovered excessive risk, obtaining significative losses in a trading strategy based on a unique entry-criterion. Fischer and Fischer defined the 61.8% level of the Fibonacci retracement as the right level to place an order. When the price retraces and touches the 61.8%, an entry order is activated. The stop loss of this entry setup should be located below the recent low.
To illustrate this entry setup, consider the following chart exposing the GBPNZD cross in its hourly timeframe.
From the figure, we observe the price surpassing the recent previous highs, which could lead us to expect a new rally. Considering the 61.8% criterion, we should place a buy limit order at 1.92675 and the stop-loss at 1.91390. The retracement observed after the impulsive upward movement could lead us to increase our confidence in the pending buy limit order.
The following figure shows the descending continuation of the GBPNZD cross, which activated the buy limit order. Although the price didn’t bounce from the 61.8% level, the trade setup remains valid.
The next chart shows the price piercing down the stop loss level placed at 1.91390, as defined by the trade setup rule.
This situation leads us to observe that the entry setup could be improved through the use of an entry filter to reduce the false entry risk.
Tools to Filter Entries
In previous articles, we presented different trade setups that the technical trader can generally find in the real market. An example of potential filters for trade entries are listed as follows.
The technical trader should consider that this list is not exhaustive or mandatory to optimize its trading entry criterion.
Example
The following figure corresponding to the GBPNZD in its hourly chart illustrates a retracement after the cross developed a rally once the upward breakout of a double bottom pattern, is confirmed. According to the 61.8% criterion, the technical trader should place a buy limit at 1.91141.
The chart below reveals that the corrective movement didn’t pierce the 61.8%, either the 38.2% zone, which leads us to observe that the technical trader could have missed a trade opportunity if the entry criterion were only the Fibonacci ratio level. However, the incorporation of a filter could aid the entry setup and reduce the risk in the trade.
In the chart, we distinguish a three-ascending valley formation marked with circles in yellow and a bullish engulfing pattern. When putting all this together the arguments for a long-side position increase.
Conclusions
In this educational article, we discussed how the incorporation of filters as chart or candle patterns could improve and reduce the risk of a trade setup based on a unique criterion. In this context, the technical trader should practice pattern recognition before applying it in the real market.
Finally, the incorporation of a statistical study of the backtest could increase confidence in the trading strategy developed by the technical trade.
Suggested Readings
Fischer, R., Fischer J.; Candlesticks, Fibonacci, and Chart Patterns Trading Tools; John Wiley & Sons; 1st Edition (2003).
In previous educational articles, we presented a wide variety of trading setups that tell us what market to trade, the trade’s invalidation level, and where we will take profits. However, the question that arises is how we can improve its performance?
Considering that price action produces a vast quantity of false signals, how we could enhance the entry timing toward the market? This educational article will review how the integration of Fibonacci tools with chart patterns and candle formations could improve the trading strategy.
The Fibonacci Level 61.8% Problem
In a previous article, we discussed using the 61.8% Fibonacci as a criterion to set the market entry. However, considering that the price momentum does not always retrace until 61.8, and with this situation, the technical trader could not catch potential trades, “leaving money on the table.
On the other hand, there exist two Fibonacci ratios that tend to be used by traders; these ratios are 38.2% and 50%. However, the use of those ratios as potential entry levels could reduce the risk to reward ratio.
The following figure illustrates the GBPUSD pair in its 4-hour chart, from where, we distinguished that once the price competed for each advance, the retracement developed in three of our five observations the Cable retraced until 61.8%. In the other two cases, the price didn’t surpass 50% of the previous movement.
This situation leads us to observe that the technical trader could miss two opportunities. At the same time, it is essential to consider that the technical trader should practice and backtest the trading strategy before putting in action with real money.
In this context, Fischer and Fischer developed a simulation using this entry maker criterion. The study’s results revealed that seven out of nine trades using the 61.8% of entry criterion resulted in a loss.
Improving the 61.8% Entry Rule
To face the poor performance of the trading strategy based entries after the price reaches the 61.8% level, Fischer and Fischer propose using a filter to reduce the risk of loss. This additional criterion is based on candlestick patterns and three-point formations.
In their work, Fischer and Fischer determined that the incorporation of candlestick patterns and three-point formations as an additional entry criterion allowed reducing the entries and increasing the percentage of winning trades.
Conclusions
In this educational article, we presented how the incorporation of an additional rule in the market entry as the candlestick formation or a three-point pattern can represent a confirmation signal, which at the same time, reduces the possibility of a bad trade.
Although the promising results are obtained by introducing the improvements presented by Fischer and Fischer, the technical trader should practice and evaluate the accuracy of these criteria before jumping into the market.
Finally, traders must remember that there is no trading strategy without losses. In this regard, it is critical to use a stop-loss to manage the risk.
Suggested Readings
Fischer, R., Fischer J.; Candlesticks, Fibonacci, and Chart Patterns Trading Tools; John Wiley & Sons; 1st Edition (2003).
In today’s lesson, we are going to demonstrate an example of a chart, in which the price makes a reversal from 50% Fibonacci level. We know if the price makes a reversal from 61.8%, it usually goes up to 161.8%; if it makes a reversal from 38.2%, it goes up to 138.2%. In both cases, traders get good risk-reward. Do you ever wonder what happens if the price makes a reversal from 50%? Let us find this out through an example.
In today’s lesson, we are going to demonstrate an example of a chart, in which the price makes a reversal from 50% Fibonacci level. We know if the price makes a reversal from 61.8%, it usually goes up to 161.8%; if it makes a reversal from 38.2%, it goes up to 138.2%. In both cases, traders get good risk-reward. Do you ever wonder what happens if the price makes a reversal from 50%? Let us find this out through an example.
In today’s lesson, we are going to demonstrate an example of a chart, in which the price makes a reversal from 50% Fibonacci level. We know if the price makes a reversal from 61.8%, it usually goes up to 161.8%; if it makes a reversal from 38.2%, it goes up to 138.2%. In both cases, traders get good risk-reward. Do you ever wonder what happens if the price makes a reversal from 50%? Let us find this out through an example.
The chart shows that the price heads towards the South with good bearish momentum. It produces two bullish candles and heads towards the South. Look at the last candle. It comes out as a bullish inside bar. It makes a bullish correction. However, the sellers may wait for a bearish engulfing candle to go short in the pair.
The price has been in a bullish correction. It produces some bearish reversal candles, but it does not create any bearish momentum. The last candle comes out with a little bullish body having a long upper shadow. Let us proceed to the next chart to find out what happens next.
The last candle comes out as a bearish engulfing candle. It is a strong sign that the price may head towards the South again. The sellers may flip over to the minor chart to trigger entry.
The price heads towards the South with extreme bearish pressure. The last candle comes out as a bearish Marubozu candle. It seems that the price may continue its bearish journey towards the South further. Let us find out what actually happens.
It does not continue its bearish journey. It finds its support. Upon producing a hammer, it heads towards the North with one more bullish candle. It seems that it may continue its bearish journey considering bearish engulfing candle as a reversal candle. Next, two candles come out as strong bearish candles too. What may be the reason that the price makes a bullish reversal here? Let us find this out with Fibonacci levels.
If we calculate, we find that the price makes a bearish reversal from Fibonacci 50% level. It then heads towards the South with extreme bearish momentum. However, it finds its support at the Fibonacci 100.00 level. Usually, this is what happens when the price trends from the 50% level. A question may be raised here whether we should take entry if the price trends from the 50% Fibo level. It depends on risk-reward. If it offers a good reward, then we may take an entry. In most cases, it does not offer a good reward; thus, we may skip taking those entries.
In our previous educational article, we reviewed how the identification of double top and double bottom formations could provide a trading setup, which, according to its technical configuration, returns a risk to reward ratio equivalent to 1:1.
In this educational article, we’ll review the use of Fibonacci retracements and extensions to generate trading signals.
Trading the Market Corrections
Trading based on corrective movements has its origin in the idea that when the price action makes an impulsive move, the market develops a corrective movement before continuing to develop a new motive move.
This method’s risk derives from the possibility of false breakouts, which, depending on the primary trend, could be a “bearish trap” or “bullish trap.”
Considering that there is a broad range of Fibonacci ratios, Fischer & Fischer propose filtering the trading volume using the 61.8% level as a conservative level. The use of 61.8% provides the technical trader the possibility to invest risking a reduced part of its capital.
As a second entry filter criteria, traders could use the swing size average of the asset under analysis. Considering that every financial asset holds a different personality and volatility, this filter demands the technical trader to develop statistical backtesting to understand the asset’s inherent volatility under study.
Trade Setup
Entry Setup: Considering that the entry rule requires a unique Fibonacci level, the entry will occur once the price touches and closes above (or below) the level 61.8%. This criterion could help shield the technical investor against a potential false breakout.
Stop-Loss: The trade invalidation level will be set above/below the last peak/valley preceding the entry-level. The benefit of trading using the 61.8% level as the point of market entry is the reduced risk compared with other typical Fibonacci levels, such as 38.2% or 50%.
Trailing Stop as Profit Protector: This method by itself doesn’t make the use of a profit target level. As an alternative, the use of a trailing stop could help protect profits with a trailing criterion of the last peak or valley. The disadvantage of this method is that, constrained by the volatility observed in the real market, it is unlikely that the resulting risk to reward ratio goes beyond a mere 1:1.
Trading the Market Progress
As the Elliott Wave Theory states, the price tends to advance in three or five waves. This method uses Fibonacci extensions to define target levels.
In general, when the price action develops a price movement on strong momentum and, then, its correction doesn’t violate the starting level of the initial move, it means the market is not building a bullish or bearish trap; thus, it is likely the action will continue progressing in the direction of the first move.
Entry Rule: In the same way as in the case of a price correction setup, the entry should be set when the price retraces and closes, starting a new impulsive move. This condition doesn’t require that the price retraces to the 61.8% level of the initial movement.
Stop-Loss: The invalidation level of the trade setup should be located below the last peak or valley preceding the entry-level.
Profit Target (Three Movements Case): When the price evolves following a three-move sequence, the profit target should be set at 161.8% of the projection of the first sequence, as illustrated in the next figure.
Profit Target (Five Movements Case): This scenario considers two options. The first one is when the progress happens in the third segment and the second one when the price action has completed the third move and could be initiating its fifth movement. These scenarios are illustrated in the following figure.
Conclusions
In this educational article, we reviewed two cases in which to use as Fibonacci retracements as the extensions tool. Both methods presented in this article offer specific risks. The use of the corrections method provides a reduced risk to the technical trader, due to the trailing stop use criterion, this doesn’t mean that it could deliver a risk to reward ratio of over 1:1.
On the other hand, the use of the Fibonacci extensions, according to Fischer & Fischer, always means to invest against the trend. However, a combination of both methods could provide an opportunity to enter in favor of the market direction.
To reduce the noise and risk in the investment process, the technical trader must evaluate the performance strategy developing statistical backtesting with historical data before risking real money.
Suggested Readings
Fischer, R., Fischer J.; Candlesticks, Fibonacci, and Chart Patterns Trading Tools; John Wiley & Sons; 1st Edition (2003).
In today’s lesson, we are going to demonstrate an example of a chart where the price makes a strong move from the 61.8% Fibonacci level. However, in this example, things are slightly different. We know the world is not perfect; neither is the Forex market. Today’s lesson is going to show that. Let us get started.
In today’s lesson, we are going to demonstrate an example of a chart where the price makes a strong move from the 61.8% Fibonacci level. However, in this example, things are slightly different. We know the world is not perfect; neither is the Forex market. Today’s lesson is going to show that. Let us get started.
In today’s lesson, we are going to demonstrate an example of a chart where the price makes a strong move from the 61.8% Fibonacci level. However, in this example, things are slightly different. We know the world is not perfect; neither is the Forex market. Today’s lesson is going to show that. Let us get started.
The chart shows that the price makes a strong bearish move. After that, the price may have found its support. The last candle comes out as a bearish candle with a long lower shadow. The price may make a bullish correction and, then, a bearish breakout at the lowest low of the wave to offer a short entry.
The price makes its bullish correction. Upon producing a doji candle followed by a bearish Marubozu candle, it heads towards the South. The last candle closes within the level of support, where the price gets a rejection earlier. The sellers are going to eagerly wait for a bearish breakout.
The price makes a breakout at the lowest low of the wave, consolidates, and produces a bearish reversal candle. The sellers may trigger a short entry right after the last candle closes by setting Stop Loss above consolidation resistance. We talk about Take-profit in a minute. Let us find out how the entry goes.
The price heads towards the South with extreme pressure. It seems like the Bear is in a real hurry to hit the target. It produces only one bullish candle before the last one. The last candle comes out as a bullish inside bar. Typically, it suggests that the chart is still bearish biased. We find that out whether it really is or is it time for the sellers to come out with their profit. Let us draw Fibonacci levels.
Here it is. Despite producing an inside bar, the price heads towards the North for a bullish correction. It may change the trend as well. The reason for this is the price hits 161.8%. Typically, the price makes a reversal once it hits 161.8% of an existing trend when the trend starts from 61.8%. The question is whether the price really trends from 61.8% or not? If you closely look at the chart, the price does not hit 61.8%, but it trends from well below. Nevertheless, it trends from the zone of 61.8% to 78.6%. As long as the price trends from that zone, the Fibonacci traders consider that it trends from 61.8%. This is what makes the price behave as if it trends right from the Fibonacci level of 61.8%. When it trends from there, we know where to set our Take Profit. Yes, it is to be set at 161.8%.
In today’s lesson, we are going to demonstrate an example of H1-15 combination trading. The price trends from the level of 61.8%. Usually, when the price trends from the level of 61.8%, it does not take that long to make a breakout. However, in this example, we will demonstrate that it may sometimes take longer than our expectations. Let us get started.
In today’s lesson, we are going to demonstrate an example of H1-15 combination trading. The price trends from the level of 61.8%. Usually, when the price trends from the level of 61.8%, it does not take that long to make a breakout. However, in this example, we will demonstrate that it may sometimes take longer than our expectations. Let us get started.
In today’s lesson, we are going to demonstrate an example of H1-15 combination trading. The price trends from the level of 61.8%. Usually, when the price trends from the level of 61.8%, it does not take that long to make a breakout. However, in this example, we will demonstrate that it may sometimes take longer than our expectations. Let us get started.
The chart shows that the price makes a strong bullish move towards the North. The last candle comes out a bearish inside bar. It indicates that the price may make a bearish correction. The buyers are to wait for the price to produce a bullish reversal candle followed by a bullish 15M breakout at the highest high of the wave to go long in the pair. This is the plan of the game. Let us find out how it goes.
The next candle comes out as a bearish candle as well. The last bearish candle has a long lower shadow. It indicates that the chart may produce a bullish reversal candle anytime soon. The buyers are to wait here with patience.
As expected, the chart produces a bullish reversal candle. The candle comes out as a bullish engulfing candle. The H1-15M combination traders are to flip over to the 15M chart and wait for a bullish 15 candle breaching the wave’s highest high to trigger a long entry.
You may have noticed that the price has been within the level of resistance for several candles. It means the buyers are to keep their eyes on this pair for a long time. Look at the last candle. After so many hours of waiting, the 15M chart produces a bullish candle that closes above the level of resistance. The buyers may trigger a long entry right after the last candle closes. Let us flip over to the H1 chart with Fibo levels on and find out what happens here.
The Fibo level shows that the price trends from the level of 61.8%. This is one of the levels, which usually produces good momentum. In this example, it produces a good bullish momentum after the breakout, but it takes a long time to make the breakout. The H1-15 combination traders’ patience is tested here. The buyers who wait and keep the belief that it may end up producing the signal make money out of this setup in the end. It is not easy, but this is what trading is all about. Having a belief in analysis helps a trader be a better trader.
In today’s lesson, we are going to demonstrate an example of an H1 chart offering an entry. We find out how Fibonacci levels and 15-min chart help us take the entry. Let us get started.
In today’s lesson, we are going to demonstrate an example of an H1 chart offering an entry. We find out how Fibonacci levels and 15-min chart help us take the entry. Let us get started.
In today’s lesson, we are going to demonstrate an example of an H1 chart offering an entry. We find out how Fibonacci levels and 15-min chart help us take the entry. Let us get started.
This is an H1 chart. The chart shows that the price after making a strong bearish move has been making an upward correction. The chart produces a Shooting Star and creates a bearish momentum. However, the sellers are to wait for the chart to make a breakout at the lowest low of the wave. Let us proceed to the next chart to find out what the price does next.
The price keeps driving towards the South and makes a breakout at the lowest low. The breakout candle has a long lower shadow, but it closes well below the level of support. The H1-15M combination traders may flip over to the 15M chart now.
This is how the 15M chart looks. The last candle comes out as a bullish candle. The sellers are to wait for a bearish reversal candle to go short in the pair. They must concentrate hard on the chart. It is waiting time for the sellers.
The 15M chart produces a bearish reversal candle. The candle has a long lower shadow but has a thick bearish body. Moreover, the H1 chart makes a breakout, so a 15M bearish reversal candle means a lot to the sellers. The sellers may trigger a short entry right after the last candle closes. There is another equation, which we will reveal in a minute. Let’s now find out how the trade goes.
The price heads towards the South with good bearish momentum. The 15M chart shows that it consolidates now and then. The H1 chart should look much more bearish than this. Ok, here is the equation we have pointed out a bit earlier. Let us draw Fibonacci levels and find out how it may help us set our stop-loss and take-profit levels.
The Fibonacci levels show that the price trends from the level of 61.8%. It makes a breakout at the level of 100.0 and heads towards the level of 161.8. When the price trends from 61.8%, it creates an extra momentum. This is what this example shows, as well. With Fibonacci, we know where to set the take-profit level. Yes, it is to be at 161.8%. With stop-loss, you may set it above 61.8% if you are too defensive a trader. If you want to be too tight with your stop loss, you may set it between 78.6% to 100.0%. The first one offers less risk-reward, but it has a higher winning percentage. On the other hand, the second one offers excellent risk-reward but has less winning percentage. The choice is yours.
In today’s Fibonacci lesson, we are going to demonstrate an example of a chart, which makes a bearish move. We dig into the charts and find out how we can take an entry based on Fibonacci levels and how the levels may help us giving clues to execute our plan. Let us get started.
In today’s Fibonacci lesson, we are going to demonstrate an example of a chart, which makes a bearish move. We dig into the charts and find out how we can take an entry based on Fibonacci levels and how the levels may help us giving clues to execute our plan. Let us get started.
In today’s Fibonacci lesson, we are going to demonstrate an example of a chart, which makes a bearish move. We dig into the charts and find out how we can take an entry based on Fibonacci levels and how the levels may help us giving clues to execute our plan. Let us get started.
The above figure shows an H1 chart. The chart shows that the price makes a bearish move at a moderate pace. It seems that the price finds its support. It has been having consolidation around the level of support having bounces three times. The last candle in this chart comes out as a bullish Marubozu candle. This may push the price towards the North. However, the sellers may still have the hope that they may get a bearish breakout here. Let us proceed to the next chart to find out what the price does.
The chart produces a bearish engulfing candle breaching the level of support. The pair trades for two more candles after the breakout. An important point is to be noticed here that the price is having an upside correction after the breakout. Sometimes price keeps trending after a breakout, whereas sometimes price makes the correction. Fibonacci levels have an important role to play in this. Thus, if we use Fibonacci levels, we are able to find out whether the price trends or makes correction well ahead. Let us now find out how we take the entry. We are to flip over to the minor chart. Since this is an H1 chart, we may flip over to the 15 M chart to trigger the entry.
Look at the arrowed candle. The candle comes out as a bearish Marubozu candle forming track rail. The candle is formed right at a flipped resistance. A short entry may be triggered right after the arrowed candle closes. The chart also shows how the price heads towards the South after the signal candle. Let us now see the H1 chart with Fibonacci levels.
The chart shows that the price trends from 78.6% level. Thus, it may reverse at 138.2%. It hits 161.8% here. However, we may set our target at 138.2% if the price trends from 78.6% to be safe. The Stop Loss may be set here above 100.0 Fibonacci level.
These are the things we must remember when we trade a chart trending from a 78.6% level.
The price may make a reversal at 138.2.
If the price trends from 78.2%, it most probably makes a correction after the breakout. Otherwise, it does not give a good risk-reward as well.
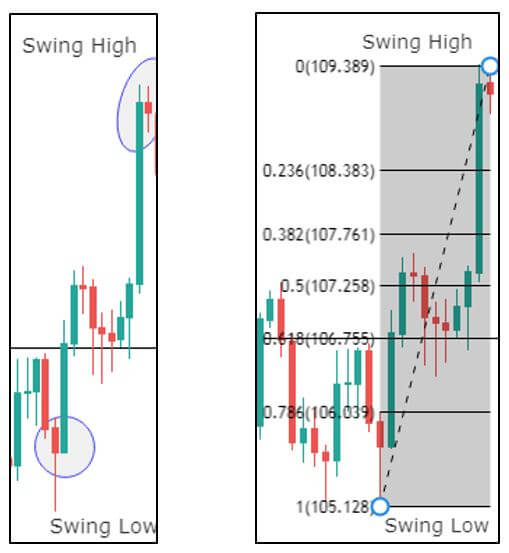
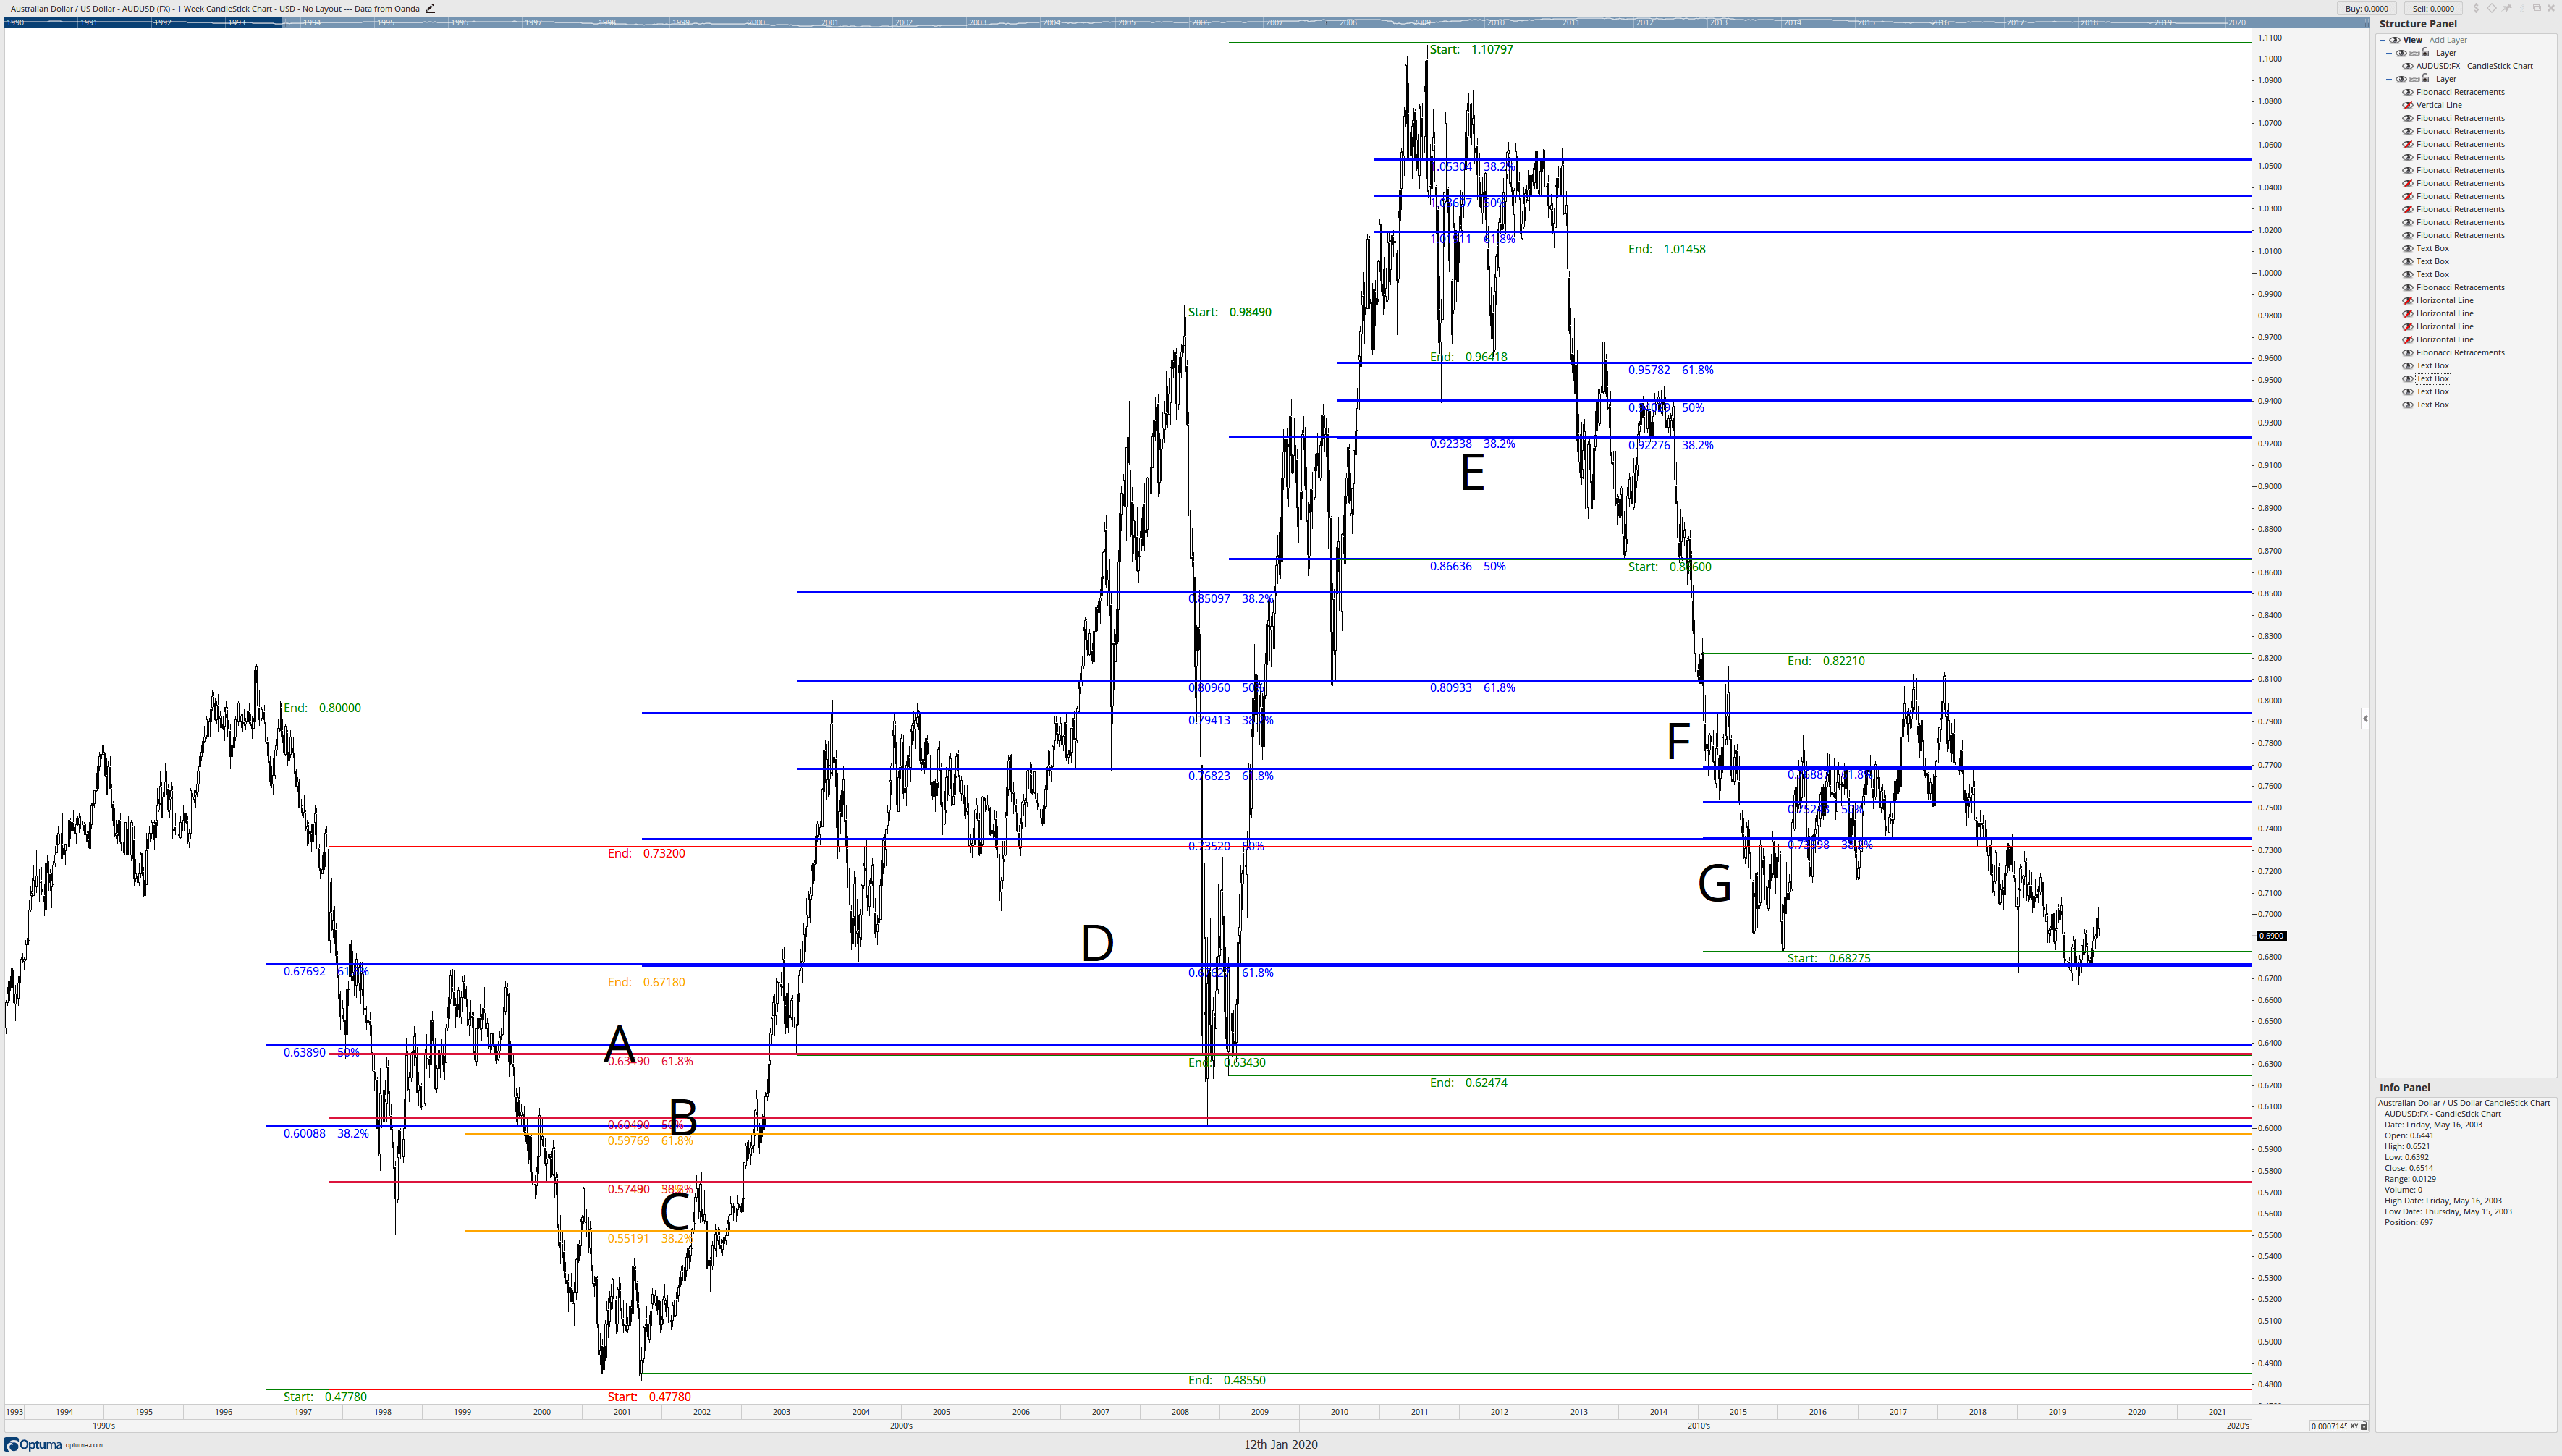
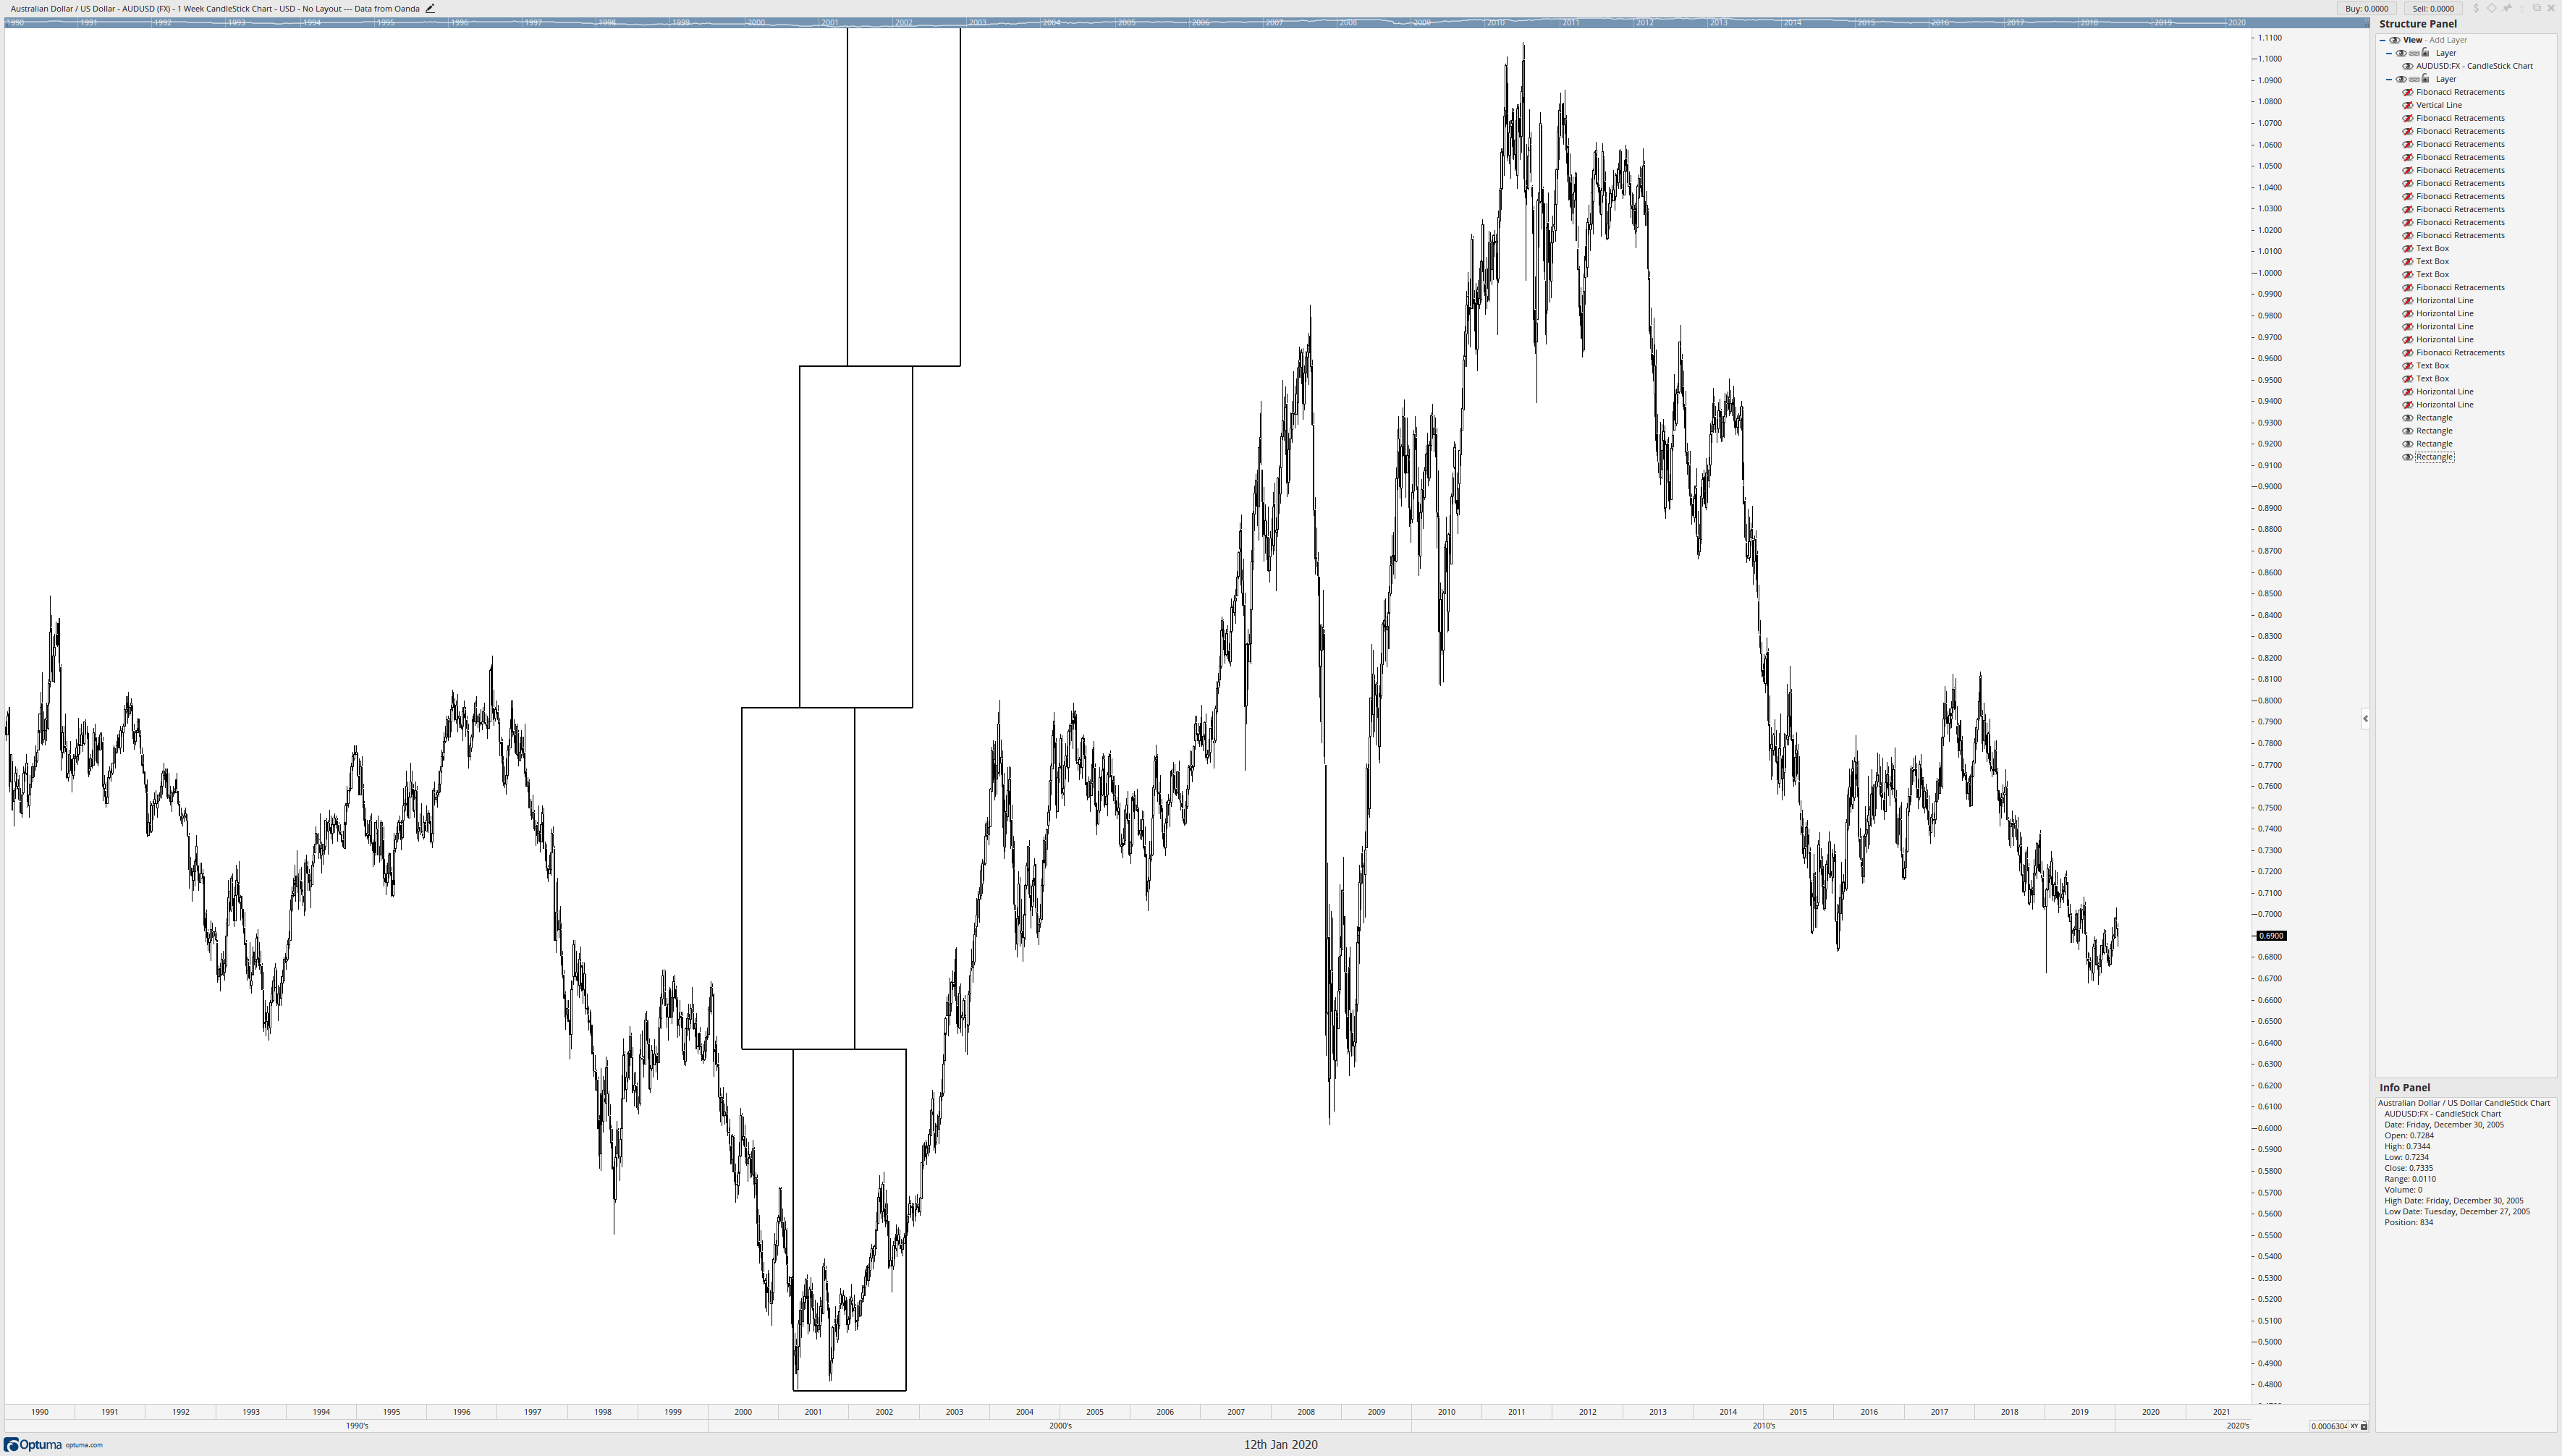
Fibonacci levels are obtained by using higher highs or lower lows. A chart may have many higher highs/lower lows. Thus, Fibonacci levels can be obtained at different levels. A trader may find it difficult to spot out the levels where the price may react. In today’s lesson, we are going to see how different higher highs may lead us to having Fibonacci levels where the price does not react.
Fibonacci levels are obtained by using higher highs or lower lows. A chart may have many higher highs/lower lows. Thus, Fibonacci levels can be obtained at different levels. A trader may find it difficult to spot out the levels where the price may react. In today’s lesson, we are going to see how different higher highs may lead us to having Fibonacci levels where the price does not react.
Fibonacci levels are obtained by using higher highs or lower lows. A chart may have many higher highs/lower lows. Thus, Fibonacci levels can be obtained at different levels. A trader may find it difficult to spot out the levels where the price may react. In today’s lesson, we are going to see how different higher highs may lead us to having Fibonacci levels where the price does not react.
This is an H1 chart. The price heads towards the North with good bullish momentum before making a bearish correction. The point can be used to draw Fibonacci levels. The price then makes another bullish move and makes a new higher high. Some traders may want to use the last higher high to draw their Fibonacci levels. To make it clear, look at the chart below.
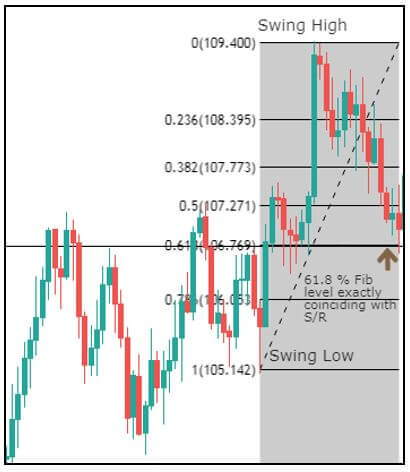
Some traders may use AB, while some others may use AC to draw Fibonacci levels. These two arms point out Fibonacci levels at different levels. Let us assume that we draw our Fibonacci levels by using AC.
The chart shows that the price after making the last higher high has started having a bearish correction. The buyers are to wait for the price to come at 78.6% level and make a breakout at the level of 100.0 to offer them a long entry. If the 78.6% is breached, 61.8% may do the same and offer them an entry as well. Let us proceed to the next chart to find out what happens next.
The price does not even come at 78.6%. It heads towards the North and makes a breakout at the level of 100.0. The price then never looks back. It hits the level of 161.8% in a hurry. The Fibonacci buyers do not find an entry here since the price does not trend from a 78.6% level. It trends way above the level of 78.6%.
Let us draw the Fibonacci levels with AB arm.
If we draw Fibonacci levels by using AB, we see that the price trends from 78.6% level. One candle breached through the level, but the next candle closes well above the level of 100.0. The buyers may set their target around 138.2% since it trends from 78.6%. However, it goes up to 161.8%.
To sum up the lesson, Fibonacci traders are to be well calculative at the time of selecting the first arm. With AC, there is no correction. The price trends towards the North straight. With AB, the price makes a correction and then makes another bullish move. Usually, a straight arm works well and provides accurate Fibonacci Fibonacci levels. Over here, we have seen that AB provides the Fibonacci levels, where the price reacts and help the buyers take a trading decision.
Horizontal Channel Alert with Custom Fibo can be found within the MQL5 marketplace under the indicators heading. It was first uploaded to the marketplace on the 13th of October 2017 by its creator Yurij Izymunov and received a number of updates. It was most recently updated on the 7th of January 2019 and is currently […]
Horizontal Channel Alert with Custom Fibo can be found within the MQL5 marketplace under the indicators heading. It was first uploaded to the marketplace on the 13th of October 2017 by its creator Yurij Izymunov and received a number of updates. It was most recently updated on the 7th of January 2019 and is currently […]
Horizontal Channel Alert with Custom Fibo can be found within the MQL5 marketplace under the indicators heading. It was first uploaded to the marketplace on the 13th of October 2017 by its creator Yurij Izymunov and received a number of updates. It was most recently updated on the 7th of January 2019 and is currently at version 1.7 of the software.
Overview
Horizontal Channel Alert with Custom Fibo is an indicator designed for the MetaTrader 4 trading platform (a MetaTrader 5 version is also available). The indicator was created to trade during horizontal channel breakthroughs, it will search for prices that are exceeding the extreme points and then bouncing back, it will offer you sound alerts any time that this occurs.
The indicator is able to plot channels both at high/low and open/close prices. The indicator will automatically attach the channels to the prices, the channel area can be expanded or reduced on the chart, it can also draw horizontal and Fibonacci levels on the timeframe that you need without removing any other details.
There are also some settings that come with the indicator, these include reverse Fibonacci levels, to auto-build Fibonacci levels by range, time range, the color of channels, channel width, channel length, alerts, notifications, to limit alerts, price mode, custom Fibo lines, and more.
Service Cost
The indicator can currently be purchased for $30, this is a one-time payment that will get you up to 1000 product activations. There is also an option to rent the indicator, this can be done monthly and will cost you $10 per month.
Horizontal Channel Alert with Custom Fibo also offers a free demo version, this will only be usable with the strategy tester within MetaTrader 4 but may still be worth downloading to try out before you make a purchase.
Conclusion
Unfortunately, there aren’t currently any user reviews or ratings, so we do not know whether people are finding it useful and that it does what it was designed to do, there are some comments from people who have purchased or rented it, they are mainly asking for support, the developer has been replying to each one which is a great sign as to the kind of support you would receive. There have not been any comments since the start of 2019, so before making a purchase, we would suggest sending any queries that you have to the developer, this is a way to check that there will still be some support once it has been purchased.
Enter Use Fibonacci can be found within the MQL5 marketplace, it was first uploaded to the marketplace on the 22nd of March 2020 by its creator Chaiya Srisawat, it received an update on the same date that it was uploaded and is currently at version 1.10. Overview Enter Use Fibonacci is an expert advisor that […]
Enter Use Fibonacci can be found within the MQL5 marketplace, it was first uploaded to the marketplace on the 22nd of March 2020 by its creator Chaiya Srisawat, it received an update on the same date that it was uploaded and is currently at version 1.10. Overview Enter Use Fibonacci is an expert advisor that […]
Enter Use Fibonacci can be found within the MQL5 marketplace, it was first uploaded to the marketplace on the 22nd of March 2020 by its creator Chaiya Srisawat, it received an update on the same date that it was uploaded and is currently at version 1.10.
Overview
Enter Use Fibonacci is an expert advisor that can be used with the MetaTrader 4 trading platform, its main purpose is to use Fibonacci levels to work out the current market conditions. It will wait for the price to reverse to the desired levels in line with the Fibonacci levels. The EA will use ZigZag indicators to help calculate the high and low points which are then used to create the Fibonacci levels.
The parameters of the EA adjust themselves automatically but are limited to the H4 timeframe and D1 timeframes only. When the price is closed above or below the LevelforOpen, the EA will open an order in the opposite direction to the trend, it will also create stop loss and take profit levels
There are some parameters that come with the EA, these include magic numbers, lot sizes, risk management settings, Fibonacci settings, line colors, level colors, and more.
Service Cost
The Enter Use Fibonacci can be purchased with a single payment of $40, this will get you up to 5 activations of the software with no further limitations. Unlike many EAs on the MQL5 marketplace, there is no option to rent the EA, there is a free demo version available, but this can only be used with the strategy tester within the MT4 platform.
Conclusion
There are no reviews or ratings available for his expert advisor which makes it quite hard to work out whether people are finding it useful or profitable, there are also no comments available which also makes it hard to know whether the developer is still providing active support. Due to both of these reasons, we would suggest contacting the developer with any queries that you may have, this is a way to make sure that the EA will function how you need it to, and as a way to find out whether the developer is still around to offer support for those that purchase the EA.
Advanced Fibonacci Tool can be located within the indicators section of the MQL5 marketplace, there may be several Fibonacci tools so we have provided a link to the exact one that we are looking at. The indicator was uploaded by its creator Onur Uzuncakmak on the 20th of September 2017, it was last updated on […]
Advanced Fibonacci Tool can be located within the indicators section of the MQL5 marketplace, there may be several Fibonacci tools so we have provided a link to the exact one that we are looking at. The indicator was uploaded by its creator Onur Uzuncakmak on the 20th of September 2017, it was last updated on […]
Advanced Fibonacci Tool can be located within the indicators section of the MQL5 marketplace, there may be several Fibonacci tools so we have provided a link to the exact one that we are looking at. The indicator was uploaded by its creator Onur Uzuncakmak on the 20th of September 2017, it was last updated on the 16th of November 2016 and is currently on version 1.2.
Overview
Advanced Finobbacci Tool is an indicator designed for the MetaTrader 4 trading platform, there is also a MetaTrader 5 version available too. Its main purpose is to give a more advanced version of the standard Fibonacci levels indicator and will draw the levels onto the charts.
Some of the key features of the indicator:
-Drawing of Fibonacci retracement and expansion levels using hotkeys.
-Auto-adjusting of retracement levels once the market makes new highs/lows.
-Ability to edit/remove any retracement & expansion levels on the chart.
-Auto snaps to exact high and low of bars while plotting on the chart.
-Getting very clear charts even though many retracement and expansion series marks.
In terms of parameters, there is a number available that you can alter. Some of the options include the text font, font size, color of retracement levels, the color of expansion levels, width of resistance and expansion levels, custom retracement, and custom expansion.
Service Cost
The Advanced Fibonacci Tool can be purchased with a one-off payment of $89 which gets you unlimited access and no limitations. Unlike many indicators on the MQL5 marketplace, there is no option to rent it. There is also a free demo version, this will have some limitations attached to it, unfortunately, the site does not indicate what they are so we cannot say for sure, it may still be worth downloading to try out, just to see if it functions how you need it to be for making a purchase.
Conclusion
There are only two reviews for the indicator but they are both positive giving it an overall rating of 4.5 out of 5.
“Best Fibonacci Indicator in the market!!” – A 5-star review.
“Please add some function for multi-timeframe” – Not really a review but it gave 4-stars.
So the indicator has received some good rating and the developer has been replying to comments offering support which is a good indication towards the type of post-purchase customer support that you will receive. We would advise you to try out the demo version, and send any queries you have to the developer so you can be sure that it is the right indicator for you before you make a purchase.
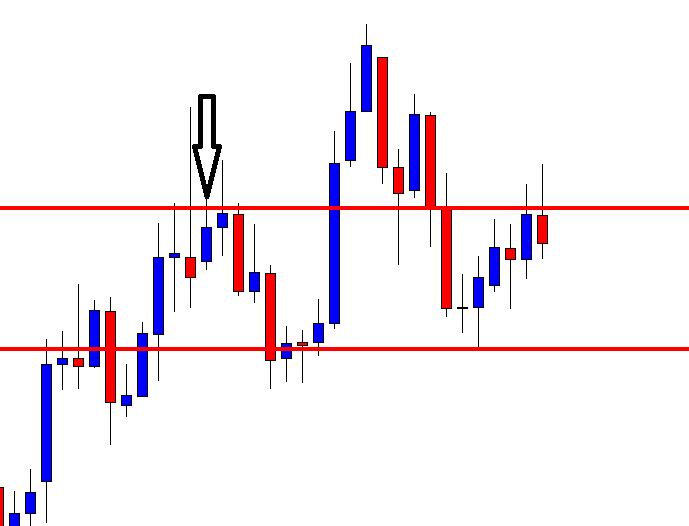
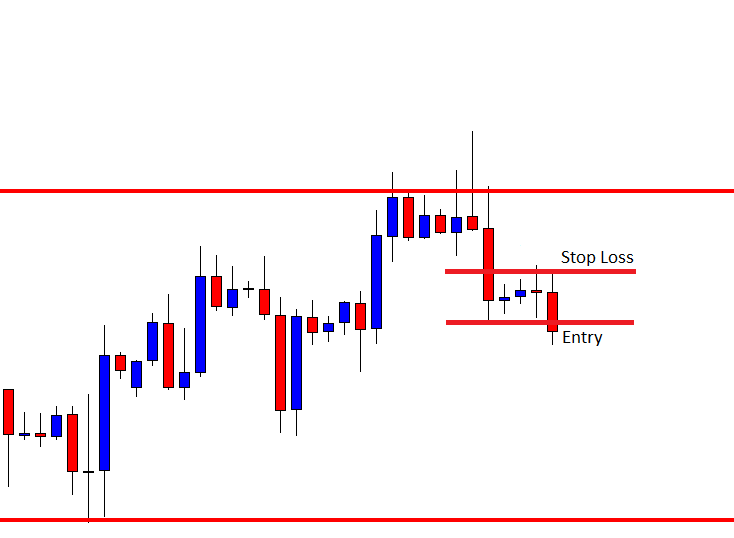
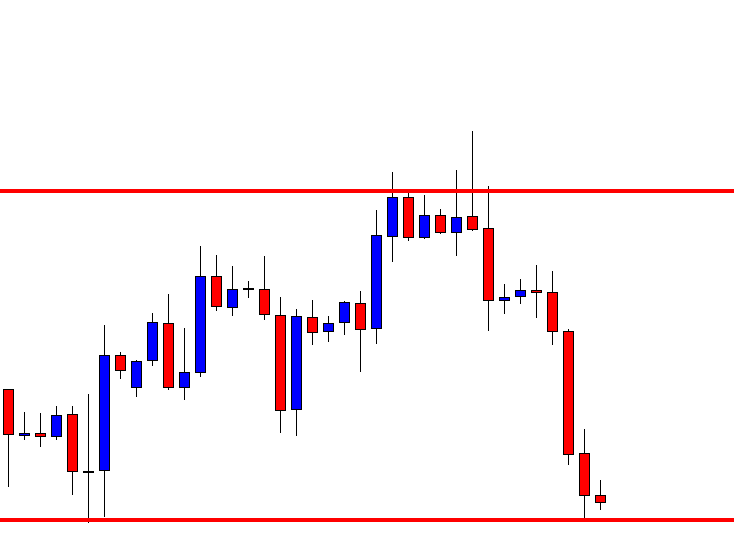
Breakout plays a very vital role in the Forex market. Traders use breakout, breakout levels to make a trading decision. Fibonacci traders are to make sure whether a particular level is breached or it holds the price to make a better trading decision. In today’s lesson, we are going to demonstrate an example where Fibonacci traders may need to concentrate more to be sure about the Fibonacci level from where the price trends. Let us get started.
Breakout plays a very vital role in the Forex market. Traders use breakout, breakout levels to make a trading decision. Fibonacci traders are to make sure whether a particular level is breached or it holds the price to make a better trading decision. In today’s lesson, we are going to demonstrate an example where Fibonacci traders may need to concentrate more to be sure about the Fibonacci level from where the price trends. Let us get started.
Breakout plays a very vital role in the Forex market. Traders use breakout, breakout levels to make a trading decision. Fibonacci traders are to make sure whether a particular level is breached or it holds the price to make a better trading decision. In today’s lesson, we are going to demonstrate an example where Fibonacci traders may need to concentrate more to be sure about the Fibonacci level from where the price trends. Let us get started.
This is an H1 chart. The chart shows that the price makes a strong bearish move. It makes an upside correction followed by a strong bearish move again. The price has been having an upside correction again. Fibonacci traders are to draw the Fibonacci levels in the chart to find out where the price makes a bearish reversal and how far it may go up to.
Here are the levels. The chart shows that the price produces a bearish engulfing candle and heads towards the South with good bearish momentum. The question is whether the price trends from 78.6% or 61.8%. It is a vital issue since the price heads towards either 138.2% or 161.8% based on these two levels. If we concentrate on the chart, we see one of the bullish candles closes above the 78.6% level. However, the price comes back within the 78.6% level with the next candle. This means the H1 chart does not make a bullish breakout at 78.6%. The sellers may plan their entries to go short up to 138.2% in this chart. Let us proceed to the next chart to find out what price does.
The price breaches the 100.0 level and trades below for several candles. The sellers may wait for a bearish reversal candle and go short in the pair as long as they are satisfied with the risk-reward factor. Usually, it is best if the price goes back to the 100.0 level and produces a bearish reversal candle around the level as far as the risk-reward ratio is concerned. However, it may be produced anywhere between 100.0% to 123.6%. The sellers with different strategies may set their stop loss at different levels, but their last take profit level is to be set at 138.2 %. Let us proceed to the next chart to find out what the price does next.
The chart shows that the price hits 138.2%. As expected, it has been roaming around the level. It seems that the price may have found its support around 138.2% level, and it may make a bullish reversal. The sellers with Fibonacci levels have completed their mission with perfection.
Traders wait for the price to trend from 61.8% Fibonacci level. This is what attracts more traders to trade, which generates good momentum. When the price trends from 61.8% level, it usually goes up to 161.8%. Since the price gets enough space to move, it offers better risk-reward. This is another reason that Fibonacci traders love to trade in a chart when the price trends from 61.8%. However, the Forex market is uncertain. We may see that the price does not head towards 161.8% with good momentum upon trending from 61.8% from time to time. In today’s lesson, we are going to demonstrate an example of this.
Traders wait for the price to trend from 61.8% Fibonacci level. This is what attracts more traders to trade, which generates good momentum. When the price trends from 61.8% level, it usually goes up to 161.8%. Since the price gets enough space to move, it offers better risk-reward. This is another reason that Fibonacci traders love to trade in a chart when the price trends from 61.8%. However, the Forex market is uncertain. We may see that the price does not head towards 161.8% with good momentum upon trending from 61.8% from time to time. In today’s lesson, we are going to demonstrate an example of this.
Traders wait for the price to trend from 61.8% Fibonacci level. This is what attracts more traders to trade, which generates good momentum. When the price trends from 61.8% level, it usually goes up to 161.8%. Since the price gets enough space to move, it offers better risk-reward. This is another reason that Fibonacci traders love to trade in a chart when the price trends from 61.8%. However, the Forex market is uncertain. We may see that the price does not head towards 161.8% with good momentum upon trending from 61.8% from time to time. In today’s lesson, we are going to demonstrate an example of this.
This is an H1 chart. The chart shows that the price heads towards the South with good bearish momentum. Upon producing a strong bearish candle, it starts having a bullish correction. Fibonacci traders shall get themselves ready by drawing Fibo levels on the chart to find out potential short opportunities in the pair.
Here it is. The chart shows that the price breaches 78.6% level and trades above the level for two more candles. This means the price is in 61.8% zone. If the price trends from here, it may go towards 161.8% level. Yes, it would be better if the price goes towards the North and trends right from the level 61.8%. Nevertheless, the sellers still are to count the move from 61.8% zone. The chart produces a bearish engulfing candle followed by a doji candle. Since the reversal candle comes out as a bearish engulfing candle forming from 61.8% zone, some sellers may trigger a short entry (some may wait for the price to breach the last lowest low). Let us proceed to the next chart to find out what the price does.
The price heads towards the South and it makes a breakout at the last swing low as well. The pair may get more short orders now. However, the price does not head towards the South. It seems that 161.8% level is far away for the price to reach. It does not usually happen but this is how the Forex market runs. It does not always run on a single equation. A question may be raised here what does a trader do with his entry? Since it is an H1 chart based entry, it must be left behind and let it decide its fate by setting Stop Loss and Take Profit accordingly.
In today’s lesson, we are going to demonstrate a chart where the price makes a strong bearish move from a Fibonacci level. It has two messages, which we will find out soon. Let us get started with the chart’s price action.
In today’s lesson, we are going to demonstrate a chart where the price makes a strong bearish move from a Fibonacci level. It has two messages, which we will find out soon. Let us get started with the chart’s price action.
In today’s lesson, we are going to demonstrate a chart where the price makes a strong bearish move from a Fibonacci level. It has two messages, which we will find out soon. Let us get started with the chart’s price action.
The chart shows that the price makes a strong bearish move. The last candle comes out as a long bearish candle, which states that the sellers dominate over the buyers. Traders may want to wait for the price to make a bullish correction to go short in the pair with more aggression.
The chart produces a bullish inside bar. The sellers are to keep their eyes on the pair to get a bearish reversal candle to go short. It seems that the pair may produce a strong bearish reversal candle (the signal candle) soon.
The chart produces a bearish inside bar, which is not the sellers’ favorite to go short. The price makes a little bearish move and heads towards the North again. Look at the last candle in the chart. It comes out as a bearish engulfing candle, which is one of the strongest bearish reversal candles.
As expected, the bearish engulfing candle drives the price towards the South. The sellers on the minor chart are going short. Thus, the price is about to make a breakout at the last swing low on the chart as well.
The price makes a breakout at the last swing low and heads towards the South further. Then, it produces two bullish candles in between but continues its bearish journey again. The price may have found its support since it produces four consecutive bullish candles. The price may continue its bearish journey, or it may make a bullish reversal. The bull looks good here. Let us draw Fibonacci levels and see whether it gives us a clue about the trend continuation or a reversal.
The chart produces a bullish inside bar right at 138.2 level. Please note that the price makes its bearish move from 78.6 level. The level of 78.6 has a strong relation with 138.2. If the price trends from 78.6, it often makes a reversal at 138.2. This is what happens here.
To sum up, if we learn the art of using Fibonacci levels and understand how a level is related to others, it becomes easy for us to take trading decisions such as entry, exit, and taking a partial profit. In the end, it makes us prolific traders.
In today’s lesson, we are going to demonstrate an example where the chart produces a reversal candle at a Fibonacci level, but the price does not head towards the trend’s direction. It then makes a deeper correction. It finds its new resistance and heads towards the trend’s direction with good momentum. Let us now have a look.
In today’s lesson, we are going to demonstrate an example where the chart produces a reversal candle at a Fibonacci level, but the price does not head towards the trend’s direction. It then makes a deeper correction. It finds its new resistance and heads towards the trend’s direction with good momentum. Let us now have a look.
In today’s lesson, we are going to demonstrate an example where the chart produces a reversal candle at a Fibonacci level, but the price does not head towards the trend’s direction. It then makes a deeper correction. It finds its new resistance and heads towards the trend’s direction with good momentum. Let us now have a look.
The price heads towards the South with excellent bearish momentum. It produces six consecutive bearish candles, four of them having solid long bearish bodies. The sellers are to wait for the price to make a bullish correction and to produce a bearish reversal candle at the value area. Let us proceed to the next chart.
The price makes a bullish correction and produces a bearish engulfing candle. However, the price does not make a bearish breakout. It rather goes towards the North again. The last two candles come out as bullish candles. The price goes towards the North further for a deeper correction.
The chart produces a bearish Marubozu candle. The combination of the last two candles is called Track Rail. The Track Rail is one of the strongest reversal signal candles. The sellers may keep their eyes on this chart with attention. The Fibonacci traders may draw their Fibonacci levels to find out which level it is trending from.
Let us proceed to the next chart to find out what the price does.
The chart produces another bearish candle and makes a breakout at the wave’s lowest low. The Sellers then take control of the pair and drive the price towards the South at an extreme pace. The last candle on this chart comes out as an inverted hammer. It suggests that the price may keep heading towards the South. However, do not forget that the chart produces a bullish Pin Bar as well, and the last candle closes within the level of support where the Pin Bar bounces off.
Anyway, let’s draw the Fibonacci level on the chart and see how the price reacts to some levels.
The chart gives us a clearer picture. At first, the price produces the bearish reversal candle at 78.6. The asset does not make a breakout. Instead, it goes towards the North and finds its resistance at 61.8. The level produces a bearish reversal candle followed by a breakout at the wave’s lowest low. The price then hits 161.8 level with ease.
If the price makes a breakout by trending from 78.6, it may not hit 161.8 level. The price usually reverses at 138.2 if it trends from 78.6. Stay tuned. We are going to study with some live examples on this soon.
Fibonacci levels and price action around those levels give traders clue what they should do with their potential trade setup. The 61.8% level is the most significant level, which is paid attention by the traders to make a trading decision. The price usually goes towards the level of 161.8% when it trends from 61.8%. Since it creates enough space for the price to travel, different traders trade and make use of the wave-length in differently. We will learn some other strategies that are integrated with Fibonacci levels. Meanwhile, let us demonstrate an example of a chart where the price reacts at 61.8% and trends towards 161.8% afterwards.
Fibonacci levels and price action around those levels give traders clue what they should do with their potential trade setup. The 61.8% level is the most significant level, which is paid attention by the traders to make a trading decision. The price usually goes towards the level of 161.8% when it trends from 61.8%. Since it creates enough space for the price to travel, different traders trade and make use of the wave-length in differently. We will learn some other strategies that are integrated with Fibonacci levels. Meanwhile, let us demonstrate an example of a chart where the price reacts at 61.8% and trends towards 161.8% afterwards.
Fibonacci levels and price action around those levels give traders clue what they should do with their potential trade setup. The 61.8% level is the most significant level, which is paid attention by the traders to make a trading decision. The price usually goes towards the level of 161.8% when it trends from 61.8%. Since it creates enough space for the price to travel, different traders trade and make use of the wave-length in differently. We will learn some other strategies that are integrated with Fibonacci levels. Meanwhile, let us demonstrate an example of a chart where the price reacts at 61.8% and trends towards 161.8% afterwards.
The chart shows that upon producing a double bottom, the price heads towards the North and makes a new higher high. The buyers are to wait for the price to make a bearish correction now.
The price heads towards the South upon producing a bearish inside bar. The last candle comes out as a bearish engulfing candle closing within a flipped support. Let us wait and see whether the level produces a bullish reversal candle.
The price produces three bullish candles at the flipped support. The last candle looks to be the strongest one. The price may head towards the North and makes a breakout at the highest high of the wave.
As expected, the price heads towards the North and makes a breakout at the highest high of the wave. The price continues its journey towards the North further. The last candle on the chart comes out as a bullish candle having a long upper shadow. Do you notice anything interesting here? Look at the next chart.
The price after making a bullish move, it starts having a bearish correction. The price consolidates around the 61.8% level. It produces a hammer and heads towards the North. It makes a breakout at the last highest high and heads towards the North with good bullish momentum. The price hits 161.8% as it usually does when it trends from 61.8% level.
Some traders go long in this chart before the price makes the bullish breakout. As long as 61.8% level produces a strong reversal candle, they trigger their entry. It provides an excellent risk-reward but less winning percentage. On the other hand, some traders trade once the price makes a breakout. This offers not that great a risk-reward but an excellent winning percentage.
Fibonacci traders are to find out a good move, followed by a price correction. They keep their eyes on the 61.8% level with extreme attention. If the level of 61.8% produces a reversal candle, traders trigger for entry. Usually, the price goes up to the level of 161.8% if the price trends from 61.8%. This allows an excellent risk-reward to the traders as well. In today’s article, we are going to demonstrate an example of how the golden ratio of 61.8% plays such an important role in moving the market towards the trend. Let us get started.
Fibonacci traders are to find out a good move, followed by a price correction. They keep their eyes on the 61.8% level with extreme attention. If the level of 61.8% produces a reversal candle, traders trigger for entry. Usually, the price goes up to the level of 161.8% if the price trends from 61.8%. This allows an excellent risk-reward to the traders as well. In today’s article, we are going to demonstrate an example of how the golden ratio of 61.8% plays such an important role in moving the market towards the trend. Let us get started.
Fibonacci traders are to find out a good move, followed by a price correction. They keep their eyes on the 61.8% level with extreme attention. If the level of 61.8% produces a reversal candle, traders trigger for entry. Usually, the price goes up to the level of 161.8% if the price trends from 61.8%. This allows an excellent risk-reward to the traders as well. In today’s article, we are going to demonstrate an example of how the golden ratio of 61.8% plays such an important role in moving the market towards the trend. Let us get started.
The chart shows that it makes a bullish move upon producing a bullish engulfing candle. The price makes a downside correction and moves towards the North again. This time the price makes the move with good bullish momentum. The Fibonacci traders are to wait for the price to make a downside correction and draw Fibonacci levels to go long in the pair. Let us proceed to the next chart to find out whether it starts having downside correction or heads towards the North further.
This is an interesting move by the chart. It has a bearish gap, but the candle comes out as a bullish candle. Despite having an upper shadow, this is a bullish reversal candle. Let us find out how the price reacts upon getting such a bullish reversal candle.
The price heads towards the North with extreme bullish momentum. The bull outplays the bear. This is such a strong bullish move that the buyers would love to make full use of it. Do you notice something interesting? Yes, the price trends from the 61.8% zone. Let us draw the Fibonacci levels and see how it looks.
The chart shows that despite having a bearish gap, the chart produces a bullish candle within 61.8% zone and heads towards the North. It hits the level of 161.8% in a hurry as well. This is what the Fibonacci golden ratio level does almost all the time. There are different ways of trading and catch such a move. Some traders enter before the breakout, while some enter after the breakout at the highest high of the wave. Both have merits and demerits, which we will learn in our forthcoming Fibonacci lessons. Meanwhile, concentrate on your chart and practice drawing Fibonacci levels by pointing out the highest high and the lowest low. Start practicing this, so you get well acquainted with Fibonacci significant levels and how the price reacts to them. This will help you trade much better soon.
Fibonacci trading is one of the most prolific trading methods, which is widely used by Forex traders. Retracement length, Fibo levels as well as reversal candle are three factors that Fibonacci traders need to pay attention to. In today’s article, we are going to demonstrate an example of a chart, which makes an excellent bearish move after having a retracement. The length of retracement, the most significant Fibo level, and the reversal signal all play their part in this example. Thus, fasten your seat belt and read through.
Fibonacci trading is one of the most prolific trading methods, which is widely used by Forex traders. Retracement length, Fibo levels as well as reversal candle are three factors that Fibonacci traders need to pay attention to. In today’s article, we are going to demonstrate an example of a chart, which makes an excellent bearish move after having a retracement. The length of retracement, the most significant Fibo level, and the reversal signal all play their part in this example. Thus, fasten your seat belt and read through.
Fibonacci trading is one of the most prolific trading methods, which is widely used by Forex traders. Retracement length, Fibo levels as well as reversal candle are three factors that Fibonacci traders need to pay attention to. In today’s article, we are going to demonstrate an example of a chart, which makes an excellent bearish move after having a retracement. The length of retracement, the most significant Fibo level, and the reversal signal all play their part in this example. Thus, fasten your seat belt and read through.
The chart shows that it makes a strong bearish move and makes a breakout at long-held support. The price heads towards the South, searching for its support. The sellers are to wait for the price to have a retracement.
The price starts having retracement. It produces a bullish inside bar followed by another bullish candle. The sellers are to wait for the price to find its resistance and produce a bearish reversal candle. However, the Fibonacci traders are to wait for the price to produce a bearish reversal candle at a very particular level, which is the 61.8 level.
The chart produces a bearish engulfing candle closing well below the last bullish candle. The Fibonacci traders must draw the Fibonacci retracement levels to find out which level produces this reversal candle. If this is the level of 61.8, the Fibo sellers are going to go short in the pair.
The highest high is the level of 0.00, and the lowest low is the level of 100.0. The price has a retracement and produces a bearish engulfing candle right at Fibo level 61.8. Usually, when the level of 61.8 works as support/resistance, it drives the price towards the level of 161.8. This means the price may head towards the South and hit the level of 161.8 next. Let us proceed to the next chart and see what the price does here.
The price hits 161.8 level. It makes an upward correction on its way. However, it reaches the level at last. The last candle shows that it breaches the level of 161.8. The price may head towards the South further.
The level of 61.8 is called the Golden ratio. It is a super significant level as far as Fibonacci Retracement is concerned. The buyers in a buying market and the sellers in a selling market wait for the price to produce a reversal candle/signal candle to go long/short in a pair. Yes, there some equations for the traders to know and obey to be able to trade with Fibonacci retracement. Once they learn them well, Fibonacci trading can make them a handful.
Financial traders rely a lot on a tool called Fibonacci Retracement. This shows the percentage of retracement that the price makes after making a strong bullish/bearish move. The percentage of retracement is very significant to the traders. There are some particular levels, where the price reacts heavily and creates a new trend. Thus, financial traders use Fibonacci Retracement tool to measure retracement length and find the potential whether it is going to create a new trend or not. The Forex traders love using the Fibonacci Retracement tool as well. Once we know how to draw it on the chart accordingly, we find out that the currency pairs on almost all the timeframes obey the Fibonacci retracement ratio.
Financial traders rely a lot on a tool called Fibonacci Retracement. This shows the percentage of retracement that the price makes after making a strong bullish/bearish move. The percentage of retracement is very significant to the traders. There are some particular levels, where the price reacts heavily and creates a new trend. Thus, financial traders use Fibonacci Retracement tool to measure retracement length and find the potential whether it is going to create a new trend or not. The Forex traders love using the Fibonacci Retracement tool as well. Once we know how to draw it on the chart accordingly, we find out that the currency pairs on almost all the timeframes obey the Fibonacci retracement ratio.
Financial traders rely a lot on a tool called Fibonacci Retracement. This shows the percentage of retracement that the price makes after making a strong bullish/bearish move. The percentage of retracement is very significant to the traders. There are some particular levels, where the price reacts heavily and creates a new trend. Thus, financial traders use Fibonacci Retracement tool to measure retracement length and find the potential whether it is going to create a new trend or not. The Forex traders love using the Fibonacci Retracement tool as well. Once we know how to draw it on the chart accordingly, we find out that the currency pairs on almost all the timeframes obey the Fibonacci retracement ratio.
Leonardo Fibonacci, an Italian mathematician, identified a series of numbers such as 0, 1, 1, 2, 3, 5, 8. 13, 21, 34, 55, etc. Each number is the sum of the preceding two numbers. These numbers produce some significant ratios, such as 23.6. 38.2, 50, 61.8. 78.6, 100, 123.6, 138.2, 161.8. These ratios and the Fibonacci sequence are found in nature as well. Thus, people love using the sequence ratios in their design and plan. At the end of the day, people run financial markets. They buy or sell at certain levels. Since Fibonacci ratios are much related to our nature and life, traders love using these ratios to help decide where to buy and where to sell.
As far as Fibonacci ratios are concerned, the 61.8 is considered as the golden ratio. It is found in flower petals, seed heads, pinecones, fruits and vegetables, tree branches, shells, spiral galaxies, hurricanes, fingers, animal bodies, reproductive dynamics, animal fight patterns, DNA molecule, etc.
In the financial/Forex market, the ratios are used by using a tool called Fibonacci Retracement. There are other Fibonacci tools, but this one may be the trader’s most favorite.
In a buying market, a trader draws his Fibonacci retracement levels from the lowest low to highest high.
The level of 00.00 is the lowest low, and the 100.00 is the highest high of a bullish wave. Traders are to wait for the price to make a bearish retracement. All these levels are significant, and the price reacts to these levels. However, the buyers pay more attention when the price is around 61.8 level to go long in a pair.
In a bearish market, it is just the opposite. Let us have a look at how it looks like.
Fibonacci Retracement levels help traders spout out the trend’s initiating point. Thus, it becomes easy for the traders to take entry with excellent risk-reward. In our forthcoming articles, we are going to demonstrate charts on different pairs, time frames to find out how the price reacts to different Fibonacci levels. Stay tuned.
When getting started with trading, the first things people look out for are indicators. Indicators exist in both technical analysis and fundamental analysis. The difference between the two beings, fundamental indicators indicate or predict a long-term trend while technical indicators predict or confirm a short-term trend.
One of the best forms of analyzing the markets is by using indicators, as it helps interpret the trend in the market and also the opportunities available in them. Indicators are of two types, namely, leading indicators and lagging indicators. The former one is used to predict the future trend while the latter is used to confirm a trend.
What is a Leading Indicator?
It is a type of technical indicator that forecasts future prices in the market using past prices. That is, when the indicator makes its move, the prices follow a similar move. These indicators lead the price; hence they are called leading indicators.
However, never there is a 100 percent surety that the price will move in the direction as predicted by the indicator. Yet, traders can get their ideas from the indicators, see how the market unfolds, and then act accordingly.
What is a lagging indicator?
A Lagging indicator is also a technical indicator that uses past prices and confirms the trend of the market. It does not predict future price movements. Basically, it follows the change in the prices.
Classifying Indicators
There are five types of indicators in technical analysis. Let’s put these indicators in the right bag.
Trend indicators – It is a lagging indicator to analyze if the market is moving up or down.
Mean reversion indicators – A lagging indicator that measures the length of the price swing before it retraces back.
Relative strength indicators – It is an oscillator which is a leading indicator that measures the buying and selling pressure in the market.
Momentum indicators – This leading indicator evaluates the speed with which the price changes over time.
Volume indicators – could act as a leading or a lagging indicator that tallies up trades and quantify the buyers and sellers in the market.
Examples of leading indicators
The widely accepted and used leading indicators include:
Fibonacci Retracement
Donchian channel
Support and Resistance levels
Difference between Leading and Lagging Indicators
Conclusion
All novice traders are in the hunt for the so-called “best indicator” in trading. But there is no such thing as ‘best’ indicator. Every indicator is a useful indicator if applied in the right way. For instance, we cannot use a trend indicator to predict the future of the market and then undermine that it does not work. Instead, one must understand the category under which an indicator falls and then use it accordingly.
I hope you were able to comprehend the types of indicators and the difference between them. In the next lesson, we shall apply some of the indicators into the real market and test them.
In the previous six lessons, we discussed pivot points right from understanding what they are, to the strategies one can apply to trade the markets. Now, let’s summarize what we’ve learned so far and move on with another exciting tool for analyzing the markets.
Pivot Point Basics
A pivot point is a technical indicator in technical analysis trading, which determines potential support and resistance levels in the market. This indicator is stationary, unlike the other indicators that move with the change in price.
The pivot points are levels that are essentially determined using the previous day’s high, low, and close price. So, every trading day, we can obtain one set of the pivot point.
What is the pivot point made up of?
There are up to six levels that make up the pivot point levels. One of the levels is the pivot point level, and the rest are support and resistance levels. The six pivot levels are symbolized as follows:
Pivot Point (PP/P)
First Support (S1), First Resistance (R1)
Second Support (S2), Second Resistance (R2)
Third Support (S3), Third Resistance (R3)
Fourth Support (S4), Fourth Resistance (R4)
Fifth Support (S5), Fifth Resistance (R5)
Note that, most of the time, we stick to the levels until S3/R3 because the price does not usually touch the levels beyond it.
How are the pivot levels calculated?
As mentioned, the pivot points are calculated using the close, high, and low of the prior trading day.
For example, the Pivot Point, First Support, and First Resistance are calculated as follows:
PP = (High + Low + Close) / 3
S1 = (2 x PP) – High
R1 = (2 x PP) – Low
Similarly, one can calculate levels until R5/S5. However, these values need not be calculated practically. There are trading platforms that automatically calculate these values.
According to this strategy, one can consider buying when the support level of the pivot points coincides with the support level of the range. A similar strategy can be applied for shorting as well.
As the name pretty much suggests, traders can consider going long or short when the price breaks above the resistance or below the support level.
Measuring Sentiment
Traders can use the pivot point level (PP) to determine the trend of the market. If the market breaks above the PP, it indicates a buyer’s market and vice versa.
Summing it up
The pivot point is that indicators that can be used every level of traders from beginners, intermediate to the advance trades. However, this indicator is not a standalone indicator. It must always be used in conjunction with other indicators and tools to have higher odds of favoring you. We hope you enjoyed this series on pivot points. Happy trading!
In all the previous lessons of pivot points, we considered the traditional pivot points. But this is not the only type of pivot points that are existing. There are three other types to it as well. In this lesson, we shall cover the four different types of pivot points that exist.
Types of Pivot Points
The four types of pivot point are mentioned as follows:
Traditional Pivot point
Woodie Pivot point
Camarilla Pivot point
Fibonacci Pivot point
Since we’ve already discussed the traditional pivot point in detail, we shall be concentrating on the rest of the types. Note that, in all the different types of pivot points we will be studying, the only difference is the calculation of the pivot point levels. As far as the concept to trade using these pivot points is concerned, it remains the same as the traditional approach.
Woodie Pivot Point
The Formulae
Pivot point (P) = (High + Low + 2Close) / 4
First Resistance (R1) = (2 x P) – Low
Second Resistance (R2) = P + High – Low
First Support (S1) = (2 x P) – High
Second Support (S1) = P – High + Low
From the above formulas, we can notice that the way of calculations is pretty different from that of the traditional type. In the traditional, we considered the difference between High and Low to calculate support and resistance levels. But, in this case, consider the range as well as the close of the previous day. Some traders prefer this over the traditional pivots because it gives more weightage to the close price of the previous day.
Camarilla Pivot Points
The Formulae
P = (High + Close + Low) / 3
S1 = Close – ((High – Low) x 1.0833)
S2 = Close – ((High – Low) x 1.1666)
S3 = Close – ((High – Low) x 1.2500)
S4 = Close – ((High – Low) x 1.5000)
R4 = Close + ((High – Low) x 1.5000)
R3 = Close + ((High – Low) x 1.2500)
R2 = Close + ((High – Low) x 1.1666)
R1 = Close + ((High – Low) x 1.0833)
If we look closely, we can infer that the support and resistance levels are calculated using the range and the close price similar to the Woodie calculation. The only major difference being, in Camarilla, four levels of Support and Resistance is calculated and is multiplied by a multiplier.
The theory with which Camarilla was created is based on the concept that the price has a natural tendency to return to the mean (here, close of the previous day). So, the simple strategy here is to sell when the price reaches the R3 or R4 level and buy when the price bottoms to S3 or S4 level. However, if the price breaches the S4 or R4 level, it indicates a strong trend in the market.
Fibonacci Pivot Points
The Formulae
P = (High + Low + Close) / 3
S1 = P – ((High – Low) x 0.382)
S2 = P – ((High – Low) x 0.618)
S3 = P – ((High – Low) x 1.000)
R3 = P + ((High – Low) x 1.000)
R2 = P + ((High – Low) x 0.618)
R1 = P + ((High – Low) x 0.382)
For calculating Fibonacci level, the pivot point level is calculated using the traditional method. Then the Support and Resistance levels are obtained by finding the product of the previous day’s range and the corresponding Fib level. The most used Fib levels are 38.2%, 61.8%, and 100%. Finally, adding/subtracting this value with the pivot point yields the Support and Resistance levels.
All of these indicators will be available with most of the brokers and charting tool software. Consider trying all of these pivot points on a demo account and use the ones that work the best for you. This hence brings us to the end of this lesson as well as the concepts involved in the pivot points. In the next lesson, we’ll summarize this topic and move ahead with another interesting technical analysis tool. Cheers!
In the previous course article, we have briefly discussed the basics of indicator-based trading. We have also understood the different types of indicators. Before considering how to trade using these indicators, let’s see if indicator based trading is for you or not. For that, we will be listing down some of the significant pros and cons involved in indicator-based trading. After going through this article, we will know why we should be using indicators to trade the markets and what we should be cautious about while using these indicators.
Pros of using Technical Indicators
Simplification
As discussed in the previous course article, Indicators mainly present the existing price and volume data on the price charts. For novice traders who have less knowledge of reading this data, can take the help of indicators to understand the price charts in a more precise way. Also, indicators act as a great tool to identify market strength.
For instance, using the Moving Average indicator, the direction of the trend can be found. By using the stochastic indicator, overbought and oversold areas can be found. These cannot be easily identified by the novice traders if not for these indicators.
Swift Decision Making
Since you aren’t entirely aware of most of the indicators, we would like to give you an example of the indicators we have learned till now. If you remember trading Fibonacci levels, we have taken our entries right after the price bounces after touching the respective Fib levels. It is impossible to make such swift decisions in the absence of these indicators. Hence we can say that indicator based trading allows us to make quick decisions comparatively.
Confirmation Tool
Indicators act like an excellent confirmation tool for experienced traders as well. For example, a technical trader identifies a candlestick pattern and wants to take trades based on that pattern. To confirm if the signal provided by the pattern is accurate or not, he can take the help of any technical indicator like RSI or Stochastic. If the indicator supports the signal provided by the pattern, the trader can confidently make trades.
Combination Capability
Indicators can be combined to understand the market more clearly. For instance, Moving Averages can be combined with Fibonacci levels, and Stochastic can be combined with many other reliable indicators to generate accurate signals. If we wish to, we can even add an end number of indicators, but these additions should able to simplify the price chart rather than making it more complex.
Cons of using Technical Indicators
Unawareness of the complete picture
Novice traders who get used to trading with these indicators can never get an entire background on what’s happening behind the charts. If they get used to this, they can never become a professional technical trader. Also, they won’t be able to identify if the signal generated by the indicator is accurate or not. Hence, it is always crucial to understand why the indicator is moving the way it is so that we can make better trading decisions.
Not for pure price action traders
Price action trading is also a part of technical trading. It is purely based on the price movements of the asset alone. So price action traders might find indicator based trading a bit redundant because they know why the price is moving the way it is moving. Hence we can say that indicators don’t add more value to pure price action traders.
Lag Issue
By now, we know that there are lagging indicators that portray what has already happened in the market. These indicators do add significant value to indicator based trading, but they can’t be completely used to take the trades.
Final Word
These are some of the pros and cons involved in using indicators for trading the markets. So the answer to the question ‘If the Indicator based trading is for you or not?’ is yes. It is for you. But we have to be cautious and understand the entire picture instead of blindly following the indicators. In the upcoming articles, we will start learning how to take trades using various reliable indicators in the market. Cheers!
How to make money in crypto using Fibonacci retracements – part 1/2
The Fibonacci retracement level tool is one of the most popular and most effective tools in crypto trading (and trading in general). This tool is associated with helping traders determine the key levels to place buy and sell orders.
Traders who properly know how to utilize this tool can determine crucial levels of support and resistance with ease. However, to fully understand how and why this tool works, we have to go over how the Fib retracement tool has been created.
About Fibonacci
Leonardo Bonacci, widely known as Fibonacci, was an Italian mathematician born in 1170. Besides being a brilliant mathematician, Leonardo was also an avid traveler.
While traveling, he discovered a Hindu-Arabic numerical system that he explored. He saw that this system had some advantages over the current European system (at that time).
Bonacci published a book called “Liber Abaci.” The book included examples on how to use these calculations in every day uses such as bookkeeping, weight and measurement conversions, and human interest calculations, among other things.
Fibonacci Levels
An interesting proposal within Bonacci’s book was based on an observation of how the population of rabbits grew in ideal conditions. The solution to the rabbit problem was found within a mathematical sequence, which we now know as Fibonacci numbers.
What’s even more strange is that this was not the first time that this sequence of numbers was recorded. In fact, there were many more.
The ratio of numbers, which we know today as the Golden Ratio, was discovered by a Greek architect called Phidias between the years of 500BC and 432BC.
So, why are these levels important in trading?
The history and the research of many people showed that the Fibonacci sequence is found all over the geometry of nature. This sequence can be found in things like animal skin, DNA structure even spirals within a seashell.
Most financial markets (and the cryptocurrency market is no exception) will reveal this Golden Ratio on its time and price periods, where a retracement of 61.8% is typically found after a 100% gain or loss.
Conclusion
So to sum it up, Fibonacci retracement levels are referring to simple areas of support and resistance, and that is derived from the way nature works. These retracement levels are often used by traders to determine how much a move to one side will retrace once it stops. This way, they can have a better grasp on support and resistance levels as well as possible entry and exit points.
Check out part 2 of making money using Fibonacci retracements to see examples of how these levels work in real trading.
In the previous lessons, we understood how to use the Fibonacci tool to trade the pullback of a trend. We have also learnt how these Fib levels are not foolproof. Now, in this lesson, let’s extend this discussion to see how the Fibonacci tool can be used in conjunction with Support and Resistance – arguably the most critical levels on a price chart.
Support is the area where the price rejects to go down and bounce back further. This area acts as a floor where the price gets stopped. Resistance is the opposite of Support. At this level, the price finds it very hard to go up as it acts as a ceiling. The general idea is to buy at the Support and sell at Resistance. But blindly buying and selling at these levels carry huge risk as there is no guarantee that these levels will work each time.
So let’s use Fibonacci levels to determine the working of these S&R levels. Basically, we are combining both Support Resistance and Fib levels to increase the accuracy of trading signals generated. Let’s get started.
In the below chart, we have identified a strong resistance area, and now we must wait to see if it creates an area of Support after breaching the Resistance. It is always advisable to buy at ‘resistance turned support.’ Also, if the price has broken a strong resistance with multiple touches, there is a higher chance of it turning into Support. At the marked region below, we can see the price breaking the strong resistance area.
In the marked regions below, we can see the price retracing after breaking the Resistance. So in order to combine this support resistance level with Fib levels, we must identify the swing low and a swing high. As we can see below, we have also plotted the Fibonacci levels on the chart using a Fib indicator.
Ideally, if we get a retracement at the 61.8% Fib level and a confirmation candle, we can confidently enter for a buy. If the market does not react at any of the Fib levels, this could be a sign that the Support is no longer strong, and it can be broken.
As per the theory of Support and Resistance, the market must react at the previous Resistance and bounce off. From the below chart, it is clear that the retracement has reached our S/R line, which is exactly coinciding with the 61.8 Fib level. Now it is a clear indication for us to go long once we see a confirmation candle.
In the below chart, we can see that the price has exactly bounced off from the 61.8% Fib level and printed a bullish candle giving us a confirmation sign. Right after the confirmation candle, we can place our buy trade with a stop-loss at 78.6% Fib level and take-profit anywhere near the high.
Further, in the below chart, we can see the market making higher highs breaking the previous resistance levels. From this trade, we learn that, when Fibonacci is used near S/R as a confirmation tool, it increases the odds of that level performing. The price will surely take Support at the Fib levels and continue its trend.
One can notice that the ‘buy’ happens precisely at the 61.8% Fib level near Resistance turned support line. The market continues to take Support at this level until, eventually, it breakouts on the upside. This shows the power of the Fibonacci indicator when combined with S&R levels.
There are many other credible indicators that are reliable and can be combined with S&R levels. But Fibonacci is one of the most used ones by the traders across the world.
We have learned about the ABC pattern in some of our previous lessons. The C point is the most crucial factor to trade on the ABC pattern. Traders use Fibonacci retracement, flipped support/resistance to spot out the C point. Fibonacci retracement works like magic, which we will learn soon. In today’s article, we will demonstrate […]
We have learned about the ABC pattern in some of our previous lessons. The C point is the most crucial factor to trade on the ABC pattern. Traders use Fibonacci retracement, flipped support/resistance to spot out the C point. Fibonacci retracement works like magic, which we will learn soon. In today’s article, we will demonstrate […]
We have learned about the ABC pattern in some of our previous lessons. The C point is the most crucial factor to trade on the ABC pattern. Traders use Fibonacci retracement, flipped support/resistance to spot out the C point. Fibonacci retracement works like magic, which we will learn soon. In today’s article, we will demonstrate an example of an ABC pattern and try to find out whether it gives us any clue about the level before it produces the C point.
This is a daily chart. The price after being very bearish makes a bullish move. The price produces a bearish reversal candle. It is an inside bar not being a strong bearish reversal candle. However, we must notice where it is produced. Let us have a look at the same chart with some horizontal lines.
Look at the chart now. The price reacted at the level earlier. The level worked as a strong level of resistance and drove the price towards the downside. This time, the level produces a bearish reversal candle. The ABC pattern traders usually wait for such price action around such levels. To take an entry, the daily-H4 chart combination traders are to flip over to the H4 chart.
The price produces a reversal candle. It may consolidate now. The sellers are to get a bearish reversal candle and to find out a level of resistance to set their Stop Loss above it. A breakout at the level of support is the signal to trigger a short entry.
The price consolidates. Upon getting its resistance, it makes a breakout. A short entry may be triggered right after the last candle closes. The price may find its next support at the red-marked level (point B). Let us find out how the trade goes.
The trade goes well. The price heads towards the Take Profit with extreme bearish pressure. Since this is an ABC pattern’s daily-H4 chart combination, the price may travel towards the South further. The sellers may consider taking partial profit here. Taking Partial Profit usually increases our chance of getting more pips. When we can find out an ABC pattern, and we are trading on the C point, it often gets us more profit in the end. To be able to spot out the C point, we must practice a lot with Fibonacci retracement, eyeing on flipped levels, and previous levels of support/resistance.
If you have not first read my article, ‘You’re still misusing Fibonacci retracements,’ please do so before reading this article. This article will continue where we left off in discussing the new and improved way of drawing accurate and efficient Fibonacci retracements using the Brown Method. I am going to use the same Forex pair that we used in the first article. The purpose of this article is to show you how you can create Fibonacci Confluence Zones to create natural price levels that act as future support and resistance. First, I am going to start my first swing using the March 2001 low and then retracing back to the confirmation swing high in March 1997. See below.
Fibonacci Retracement from low to confirmation lower swing high.
First, I want to know if this retracement is appropriate given how much time has passed – we’re 23 years from the March 1997 high and 19 years from the March 2001 low. Do these Fibonacci retracement levels still work? Do they remain valid? The black vertical line is the start of the retracement, so anything before the retracement is not used, it’s the data afterward that matters. Let’s look.
Fibonacci Retracement – testing of 20 year old retracement range.
Are these Fibonacci retracement levels we drew still relevant? I would say so. A quick look at A, B, C, and D prove it. Especially for the most recent data at D on the AUDUSD weekly chart – seven-year lows bounce off of the 61.8% Fibonacci retracement level from 20+ years ago! But let’s look at some more Fibonacci retracements made off of other significant swings. Fair warning: there’s going to be several images here.
Fibonacci Retracement 2011 to 2008
The Fibonacci retracement above is from the swing high in July 2018 to the confirmation swing low in October 2001. Like the previous Fibonacci image, we can see that prices have respected the retracement levels even a decade after the retracements were established. But we’re not done.
Fibonacci Confluence Zones
The above image is the first retracement we looked in this article (the same swing low in March 2001) using the same swing low; we draw more retracements to the next confirmation swing lower highs. I’ve drawn two additional Fibonacci retracements in Red and Orange. Notice how some of the Fibonacci retracements occur within proximity of one another. Letter A is shared retracement zones of the 50% and 61.8% of two different retracements. B has a confluence zone of three Fibonacci retracement levels, 50%, 61.8%, and 38.2%. And C has two overlapping retracements of 50% and 38.2%. Now let’s get to the fun part.
The previous image showed three Fibonacci retracement confluence zones at A, B, and C. Those confluence zones were just three of many that will appear on any chart on any time frame. What happens if we draw a series of retracements using major swings as the start point of the Fibonacci retracements and then retrace to the next confirmation swing highs and lows? We’ll get a chart that looks like the one below.
Full Confluence Zones
I’ve added some other letters to identify more confluence zones. I admit the chart does look like a mess. And it should. Not every Fibonacci retracement to a new confirmation swing high or low will coincide with shared Fibonacci levels, but they frequently do. Once we’ve drawn out a series of retracements, we should see a set of these confluence zones. Now begins the cleanup phase. We’re going to place horizontal lines where there are confluence zones of Fibonacci retracement levels.
Horizontal Lines replace confluence zones.
The letters A, B, C, D, and E show where the Fibonacci confluence zones have formed, and are represented by horizontal lines (black) on the chart. Now, you can either delete or hide all of the Fibonacci retracements so that we are left with only the horizontal lines at A, B, C, D, and E.
Just the horizontal lines
I know that the horizontal line at D represented the most confluence zones on the AUDUSD weekly chart, but it also represented some of the longest-lasting and respected Fibonacci retracement levels. Starting at the horizontal level at D, I draw a box from D down to the major low on the AUDUSD chart. Now, the width of this box doesn’t matter – just the range.
First Box
After I’ve established that box from D down to the major low, I can remove the horizontal lines. Then I start to copy the box all the way to the top of the range. All I’m doing here is copying and pasting the box so they ‘stack.’
Stacking Boxes
Now comes the cool part. I’m going to treat each box like its own range and place Fibonacci retracements inside each box, moving from bottom to top.
Fibonacci Retracements drawn inside boxes
No matter how many times I’ve done this, it still blows my mind. But there is probably a lingering question. You’re probably looking at the chart and saying, ok, cool, but there are some massive gaps between these Fibonacci levels. You are correct if you are thinking about this. Now, Connie Brown never wrote about this next part; it’s something I discovered and developed on my own. The approach comes from the idea that markets are fractalized and proportional, so we should be able to break down like zones into smaller ranges. This is especially important and useful for traders who prefer to trade on faster time frames like four-hour or one-hour charts. Using price action that is more recent and relevant, I can draw a Fibonacci retracement from the 50% level at 0.71688 to the start/end of the box at 0.6368.
Intra Fibonacci level retracements
Letters a and b on the chart above identify the 50% Fibonacci level and start/end level described in the prior paragraph. The black horizontal lines represent the Fibonacci retracement drawn from a to b. I’ve also switched the chart from a weekly chart to a daily chart. When we see that daily chart, we get a real idea of how powerful the Brown Method of Fibonacci analysis is and how precise the study of these confluence zones can be.
In summary, to utilize the Brown Method, the followings steps are as follows:
Create Fibonacci retracements by using a major swing high/low and drawing to the confirmation swing with a strong bar – not the next extreme high/low.
After identifying Fibonacci confluence zones, place horizontal lines on the major price levels where multiple Fibonacci levels share the same price range.
Delete or hide the Fibonacci levels so that only the horizontal lines are present – make sure you identify which horizontal line had the most powerful collection of Fibonacci levels.
After identifying which horizontal line was the most potent and relevant, determine if it is closer to the all-time high or all-time low. Draw a box or a price range from that horizontal line to the all-time high or low – whichever is closest.
Repeat the boxes by copying the same box and ‘stack’ it to the all-time high/low – the opposite of whichever was used to establish the box/price range.
Draw Fibonacci retracements in the boxes.
Sources:
Brown, C. (2010). Fibonacci Analysis: Fibonacci Analysis. Hoboken: Wiley.
Brown, C. (2019). The Thirty-Second Jewell: Thirty Years Behind Market Charts From Price To W.D. Gann Time Cycles. Tyton, NC: Aerodynamic Investments Inc.
You’re still using Fibonacci retracements incorrectly Like any discipline or field of study, Technical Analysis goes through changes. Old theories and approaches are rigorously utilized and tested, new ideas are studied, and advancements in the field occur. And, like any discipline or study, it takes a while for people to adapt to the new way […]
Brown Method: Confirmation higher swing low
You’re still using Fibonacci retracements incorrectly Like any discipline or field of study, Technical Analysis goes through changes. Old theories and approaches are rigorously utilized and tested, new ideas are studied, and advancements in the field occur. And, like any discipline or study, it takes a while for people to adapt to the new way […]
You’re still using Fibonacci retracements incorrectly
Like any discipline or field of study, Technical Analysis goes through changes. Old theories and approaches are rigorously utilized and tested, new ideas are studied, and advancements in the field occur. And, like any discipline or study, it takes a while for people to adapt to the new way of doing things. There is a shocking amount of updated theory and application in Technical Analysis that has yet to make its way down to the retail trader and investor – some of it is almost 25+ years old! One of the updates to old application and practice is how we use a tool known as a Fibonacci retracement. For many years, the method has been to draw a retracement from one extreme swing to the next (from swing high to swing low or swing low to swing high). In practice, there are a few incidents where this may work out just fine, but the new and better way shows how much more accurate and useful the update has been.
Old vs. New
I want to start off right away by showing you the difference between the old and new methods – I reference the new approach as the Brown Method. The AUDUSD Weekly chart below shows the old way of drawing Fibonacci retracements. With the old process, the Fibonacci retracement is drawn from the extreme swing high on the week of August 5th, 2011, to the extreme swing low on the week of October 31st, 2008. The vertical line delineates the starting point of the retracement, and no data to the left of that vertical line should be used to determine the efficacy of the retracement. It is only the data after the vertical line that is important and relevant.
Fibonacci Retracement: Incorrect
Now, contrast the image above with the new Brown method below.
Fibonacci Retracement: Correct
You will observe how much more accurate the Fibonacci retracement levels are on the Brown Method vs. the old method. What changed? Observe the swing low retracement on both charts – they are different. They both start at the same level, but the retracement end for the Brown method is drawn to the swing low on the week of February 6th, 2009. But why? Why do you draw to a seemingly random or ‘off’ swing and not the extreme? The reason for this is based on the writings of W.D. Gann.
The Brown Method
I call this new Fibonacci retracement method, the Brown Method, after Connie Brown. It is Connie Brown who discovered this new theory and wrote about it in her 2008 book, Fibonacci Analysis. It is not a very large book, under 200 pages, but it is one of the single most important works in Technical Analysis of the past 15-years. Her discoveries of how confluence zones of Fibonacci retracements dictate the normal rhythm and pulse of the market are truly groundbreaking. But to the first question of why I did not draw the retracement to the extreme low? Connie Brown points out that W.D. Gann made the point that the end of a trend is not established by the extreme high or low – it is the secondary high/low that confirms the change in trend (sometimes known as the confirmation swing). This makes sense because the extreme is very rarely the level where the participants in a market agree that a trend is finished.
So how do we identify what swing to use? How did I identify what candlestick was the confirmation swing low on the weekly AUDUSD chart? Again, this goes back to Brown – but this information is from her penultimate work (her magnum opus in my opinion), The 32nd Jewel. The first chapter of her massive book (it weighs about eight lbs., is three inches thick and nearly 1100 pages long) addresses some of the problems students of hers have had with the application of her updated Fibonacci retracement method. To identify the correct swing to use, we look for the strongest bar. Let’s take a ‘zoomed’ in look at the swing low used on the AUDUSD weekly chart above.
Brown Method: Confirmation higher swing low
It will take you some practice to find the swing bar (also, gaps are used, but that is for another article) that would be considered the ‘strong bar.’ What constitutes a strong bar? That can be somewhat subjective, but look at the candlestick that I’ve identified as the strong bar compared to the candlesticks before it and around it. Why did I pick this candlestick? First, it is a bullish engulfing candlestick on the weekly chart. Second, that candlestick rejected any further downside pressure after a consecutive four week period of weekly candlestick closes below the open. Third, the open and low of the candlestick created the support zone for the next five weeks. In a nutshell, the candlestick is massive, its sentiment overwhelmingly one-directional, and the lows of that candlestick were respected. That candlestick was the confirmation swing low because it confirmed the end to lower prices and was the most substantial candlestick before the new uptrend occurred.
Side note: Connie Brown also said to look for gaps in the price action as areas to draw the confirmation swing. Finding gaps is a much easier process when looking at traditional markets like the stock market. Forex data can vary from broker to broker as some data providers show gaps, and others do not.
The following articles will go into further detail on how to implement more of the Brown Method. I believe that what you will read and learn will be one of the ‘wow’ moments you experience in the study of Technical Analysis. To say that what Connie Brown has discovered is truly amazing is an understatement when we learn about the confluence of Fibonacci zones and how they create the natural price zones that an instrument swings to, it is a truly eye-opening experience.
Sources:
Brown, C. (2010). Fibonacci Analysis: Fibonacci Analysis. Hoboken: Wiley.
Brown, C. (2019). The Thirty-Second Jewell: Thirty Years Behind Market Charts From Price To W.D. Gann Time Cycles. Tyton, NC: Aerodynamic Investments Inc.
Introduction
The Fibonacci tool was developed by Leonardo Pisano, who was born in 1175 AD in Italy. Pisano was one of the greatest mathematicians of the middle ages. He brought
Introduction
The Fibonacci tool was developed by Leonardo Pisano, who was born in 1175 AD in Italy. Pisano was one of the greatest mathematicians of the middle ages. He brought
Introduction
The Fibonacci tool was developed by Leonardo Pisano, who was born in 1175 AD in Italy. Pisano was one of the greatest mathematicians of the middle ages. He brought the current decimal system to the western world ( learned from Arab merchants on his trips to African lands). Before that, mathematicians were struggling with the awkward roman numerical system. That advancement was the basis for modern mathematics and calculus.
He also developed a series of numbers using which he created Fibonacci ratios describing the proportions. Traders have been using these ratios for many years, and market participants are still using it in their daily trading activities.
In today’s article, we will be sharing a simple Fibonacci Retracement Trading Strategy that uses Fibonacci extensions along with trend lines to find accurate trades. There are multiple ways of using the Fibonacci tool, but one of the best ways to trade with Fibonacci is by using trend lines.
With this Fibonacci trading strategy, a trader will find everything they need to know about the Fibonacci retracement tool. This tool can also be combined with other technical indicators to give confirmation signals for entries and exits. It also finds its use in different trading strategies.
Below is a picture of the different ratios that Leonardo created. We will get into details of these lines as we start explaining the strategy.
Strategy Prerequisites
Most of the charting software usually comes with these ratios, but a trader needs to know how to plot them on the chart. Many traders use this tool irrespective of the trading strategy, as they feel it is a powerful tool. The first thing we need to know is where to apply these fibs. They are placed on the swing high/swing low.
A swing high is a point where there are at least two lower highs to its right
A swing low is a point where there are at least two higher lows to its right
If you are uncertain of what the above definitions meant, have a look at the below chart.
Here’s how it would look after plotting Fibonacci retracement on the chart.
In an uptrend, it is drawn by dragging the Fibonacci level from the swing high all the way to swing low. In case of a downtrend, start with the swing high and drag the cursor down to the swing low. Let’s go ahead and find out how this strategy works.
The Strategy
This strategy can be used in any market, like stocks, options, futures, and of course, Forex as well. It works on all the time frames, as well. Since the Fibonacci tool is trend-following, we will be taking advantage of the retracements in the trend and profit from it. Traders look at Fibonacci levels as areas of support and resistance, which is why these levels could be a difference-maker to a trader’s success.
Below are the detailed steps involved in trading with this strategy
Step 1 – Find the long term (4H or daily time frame) trend of a currency pair
This is a very simple step but crucial, as well. Because we need to make sure if the market is either in an uptrend or a downtrend. For explanation purposes, we will be examining an uptrend. We will be looking for a retracement in the trend and take an entry based on our rules.
Step 2 – Draw a line connecting the higher lows. This line becomes our trendline.
The trend line acts as support and resistance levels for us. In this example, we will be using it as support.
Step 3 – Draw the Fibonacci from Swing low to Swing high
Use the Fibonacci retracement tool of your trading software and place it on swing low. Extend this line up to the swing high. Since it is an uptrend, we started with a 100% level at the swing low and ended with 0% at the swing high.
Step 4 – Wait for the price to hit the trend line between 38.2% and 61.8% Fibonacci levels.
In the below-given figure, we can see that the price is touching the trend line at two points (1 and 2). There is a significant difference between the two points. At point 1, the price touches the trend line between 78.6% and 100%, whereas, at point 2, the price touches the trend line between 38.2% and 61.8%.
The region between 38.2% and 61.8% is known as the Fibonacci Golden Ratio, which is critical to us. A trader should be buying only when the price retraces to the golden ratio, retracements to other levels should not be considered. Therefore, point 2 is where we will be looking for buying opportunities.
Step 5 – Entry and Stop-loss
Enter the market after price closes either above the 38.2% or 50% level. We need to wait until this happens, as the price may not move back up. However, it should not take long as the trend should continue upwards after hitting the support line.
For placing the stop loss, look at previous support or resistance from where the price broke out and put it below that. In this example, stop loss can be placed 50% and 61.8% Fibonacci level because if it breaks the 50% level, the uptrend would have become invalidated. The trade would look something like this.
Final words
The Fibonacci retracement tool is a prevalent tool used by many technical traders. It determines the support and resistance levels using a simple mathematical formula. Do not always rely only on Fibonacci ratios, as no indicator works perfectly alone. Use additional tools like technical analysis or other credible indicators to confirm the authenticity and accuracy of the generated trading signals. One more important point that shouldn’t be forgotten is not to use Fibonacci on very short-term charts as the market is volatile. Applying Fibonacci on longer time frames yield better results.
We hope you find this strategy informative. Try this strategy in daily trading activities and let us know if they helped you to trade better. Cheers!
The Cypher Pattern
The Cypher Pattern is another type of Harmonic Pattern – except it isn’t – but it is. This is one of the few patterns not identified by
The Cypher Pattern
The Cypher Pattern is another type of Harmonic Pattern – except it isn’t – but it is. This is one of the few patterns not identified by
The Cypher Pattern
The Cypher Pattern is another type of Harmonic Pattern – except it isn’t – but it is. This is one of the few patterns not identified by Scott Carney. Darren Oglesbee discovered this particular pattern.
This pattern is very similar to the Butterfly in both it’s construction and where it typically will occur (near the end of trends). However, the Cypher Pattern is a rare pattern and not one that shows up with a high amount of frequency. Don’t confuse rarity with being more powerful or profitable. I do not know enough about this pattern, nor have I had the opportunity to trade it enough to gauge it’s ‘power’ versus its peers. All I do know is that in the times I have traded it, its positive expectancy rate is high, no different than a Bat or Alternative Bat in my experience. The same goes for the Crab and Deep Crab, for that matter. Just like all of the other Harmonic Patterns that you will have learned about, the Cypher has specific rules and conditions that must be met for it to be a specified Cypher pattern.
Cypher Confirmation Conditions
B must retrace to an expansive range between 38.2% and 61.8% of XA. At least 38.2% but not exceeding 61.8%
C is an extension leg and moves beyond A – but must move to at least 127.2%, but it is normal for it to go as far as the 113% – 141.4%. It is considered invalid if it moves beyond the 141.4%
CD leg should break the 78.6% level of XC.
The PRZ (Potential Reversal Zone) of D is a wide range where the price must get to. Price can move anywhere between 38.2% to 61.8%.
I’ve created a simplified approach to how to ‘see’ this pattern.
Simplified Approach (Bullish Cypher)
C must be higher than A.
D must be less than B but greater than X.
We should see a higher high (C > A) and a higher low (D > X).
Simplified Approach (Bearish Cypher)
C must be less than A.
D must be more than B but less than X.
The same approach as above, reverse: lower high (D < X) and a lower low (C < A).
This pattern can be confusing (all harmonic patterns can be complicated), but in a nutshell, what we see happening with the Cypher pattern is the first pullback/throwback of a trend (B). After B, the small pullback/throwback of B occurs with the C leg. From a bullish perspective, when we see prices making lower highs and lower lows, but there is no follow-through shorting pressure, we should be on the lookout for some powerful and influential moves to occur in a very short period of time. It is not uncommon to see a bullish candle engulf several days of consolidation with this pattern.
Sources: Carney, S. M. (2010). Harmonic trading. Upper Saddle River, NJ: Financial Times/Prentice Hall. Gilmore, B. T. (2000). Geometry of markets. Greenville, SC: Traders Press. Pesavento, L., & Jouflas, L. (2008). Trade what you see: how to profit from pattern recognition. Hoboken: Wiley.
Harmonic Pattern Example: Alternate Bat Bullish
The Alternate Bat Pattern
The Alternate Bat Pattern is another pattern by Scott M. Carney. This pattern comes from his second Volume Two in
Harmonic Pattern Example: Alternate Bat Bullish
The Alternate Bat Pattern
The Alternate Bat Pattern is another pattern by Scott M. Carney. This pattern comes from his second Volume Two in
Harmonic Pattern Example: Alternate Bat Bullish
The Alternate Bat Pattern
The Alternate Bat Pattern is another pattern by Scott M. Carney. This pattern comes from his second Volume Two in his Harmonic Trading series of books. He discovered this pattern roughly two years after (2003) his discovery of the Bat Pattern (2001). Carney wrote that ‘the origin of the alternate Bat pattern resulted from many frustrated and failed trades of the standard framework. The standard Bat pattern is defined by the B point that is less than a 0.618 retracement of the XA Leg.’ Essentially, with the Alternate Bat Pattern we observe an extension beyond the 88.6% level at D, where D moves slightly below X (in a bullish Bat) or above X (in a bearish Bat). I view Alternate Bats as classic and powerful bear traps and bull traps. And they are just plain nasty if you find yourself thinking that a new low means further downside movement and a continuation lower – but instead to you get whipsawed by a massive reversal.
Alternate Bat Elements
Whereas the 88.6% retracement is nearly singular to the Bat Pattern, the Alternate Bat Pattern utilizes the 113% retracement of XA to determine the endpoint.
B must be a 38.2% or less retracement of XA.
Minimum projection of 200%
The AB=CD pattern must be an extended AB=CD and often is a 161.8% level.
The pattern is potent when using a form of divergence detection, such as the Composite Index, to confirm the pattern.
Sources: Carney, S. M. (2010). Harmonic trading. Upper Saddle River, NJ: Financial Times/Prentice Hall. Gilmore, B. T. (2000). Geometry of markets. Greenville, SC: Traders Press. Pesavento, L., & Jouflas, L. (2008). Trade what you see: how to profit from pattern recognition. Hoboken: Wiley.
Harmonic Pattern Example: Bearish Bat
The Bat Pattern
The Bat Pattern is another harmonic pattern that was not identified by Gartley, but instead by the great Scott M. Carney –
Harmonic Pattern Example: Bearish Bat
The Bat Pattern
The Bat Pattern is another harmonic pattern that was not identified by Gartley, but instead by the great Scott M. Carney –
Harmonic Pattern Example: Bearish Bat
The Bat Pattern
The Bat Pattern is another harmonic pattern that was not identified by Gartley, but instead by the great Scott M. Carney – found in Volume One of his Harmonic Trading series (I believe that Mr. Carney’s work is essential in your trading library).
I am particularly grateful to Carney’s work because it was his work that introduced me to a very powerful Fibonacci retracement level: 88.6%. Previously, I have followed Connie Brown’s suggestions in her various books utilizing only the 23.6%, 50%, and 61.8% Fibonacci levels – the 88.6% is now a near-constant in my own analysis and trading. That particular level, the 88.6% level, is the primary level to reach with the Bat pattern.
One of the key characteristics of this pattern is the strength, power, and speed of the reversals that occur after a confirmed and completed pattern is verified. As a Gann based trader, this is the pattern I personally look for to identify the ‘confirmation’ swing in a new trend (the first higher low in a reversing downtrend and the first lower high in a reversing uptrend).
Bat Pattern Elements
B wave must be less than the 61.8% retracement of XA – ideally the 38.2% or 50%.
BC projection must be at least 1.618.
The AB=CD pattern is required and is often extended.
C has an expansive range between 38.2% and 88.6%.
The 88.6% Fibonacci retracement is a defining and particular level to the Bat Pattern.
The 88.% D retracement is the defining and exact limit of the end of this pattern.
C should be inside the 50% and 61.8% retracement range.
Ideal Bearish Bat Conditions
B wave must be less than the 61.8% retracement of XA – ideally the 38.2% or 50%.
BC projection must be at least 88.6%.
BC projection minimum of 161.8% with the max extensions between 200% to 261.8%.
AB=CD is required, but the Alternate 127% AB=CD is ideal.
C wave retracement can vary between the 38.2% to 88.6% retracement levels.
Sources: Carney, S. M. (2010). Harmonic trading. Upper Saddle River, NJ: Financial Times/Prentice Hall. Gilmore, B. T. (2000). Geometry of markets. Greenville, SC: Traders Press. Pesavento, L., & Jouflas, L. (2008). Trade what you see: how to profit from pattern recognition. Hoboken: Wiley.
Leonardo Bonacci, AKA Fibonacci, was a mathematician, born around 1170, and became known for developing the Fibonacci sequence: where each number is the sum of the two preceding
https://youtu.be/WssOy8yCqTs
Leonardo Bonacci, AKA Fibonacci, was a mathematician, born around 1170, and became known for developing the Fibonacci sequence: where each number is the sum of the two preceding
Leonardo Bonacci, AKA Fibonacci, was a mathematician, born around 1170, and became known for developing the Fibonacci sequence: where each number is the sum of the two preceding ones, starting from 0 and 1. Such as; 0, 1, 1, 2, 3, 5, 8, 13, 21, 34, 55, 89,144, and on to infinity.
From this theory, the ancient Greeks founded the Golden Ratio, AKA Golden Section, Golden Mean, and Divine Proportion (proportions) where many things in the universe and in nature can be measured by such Golden Ratios.
In Forex, the most commonly used Fibonacci ratios are: 38.2%, 50%, 61.8% and sometimes 23.6% and 76.4%. These ratios are better known as retracement levels and are used in technical analysis to help traders establish support and resistance levels and areas where a trade might turn in direction.
Traders simply place their Fibonacci retracement tool onto their chart and set position ‘1’; the lowest point in a move and then drag the tool to position ‘2’, the highest point of a move. The tool will automatically open retracement levels on the chart showing dividing lines with individual ratios of 23.6%, 38.2%, 50%, 61.8%, and 100%. The idea is that the swing high on the trader’s chart will be followed by a pullback or retracement, and then the trader must decide at which level, if any, the price action will stall and then continue its upward move. For example, if the pullback falls to the 23.6% and then continues higher (above our initial high point), this would be considered a strong bullish move. A slightly weaker bullish move would be indicated by a pullback to the 38.2% retracement line. Therefore, the shorter the pullback, the more likelihood of a stronger push higher and continuation of the trend. See our article, Introduction To Elliot Wave Theory – Accurately Predicting Forex trends.
This above set-up is used for a bullish move on a Forex pair. If the trader wishes to look at a bearish move, he/she simply places position one at the highest point in a move and drags position 2 to the lowest, in which case the opposite applies to the original set up.
Let’s look at example A: –
This is a 5-minute chart of the EUR:USD pair. We have brought our Fibonacci tool on to the screen at the lowest point of the move (1.0990) as denoted by the X and then dragged it to the highest point of the move (1.1044), as denoted by the second X. The tool has opened six vertical levels on the screen: 0, 23.6, 38.2, 50, 61.8, and 100. These show, in percentage terms, the level of pull back from the lowest point to the highest point. What is evident by the green candlesticks is that there was a strong push high early in the move and then price action entered a ‘sideways’ move before pulling back to the 23.6% line, and then after a move higher, price action pulled back to the 23.6% line and then moved lower, stopping briefly at the 38.2% level before finding support at the 50% retracement level (1.1018) before moving higher. Had a trader bought the pair at the 50% retracement, where price action clearly stalled, they would have seen an 18 pip move to the upside. If this was to be used on every trade and consistently yielded the same results a couple of times a day, it would prove to be an immensely powerful trading tool.
However, we strongly advise not to solely trade with a Fibonacci tool for the following reasons. That initial spike higher in the EUR:USD pair in example A, from 1.0990 to 1.1044, was the result of an unexpected news flash release where the European leaders had agreed on an initial draft acceptance verbiage relating to a breakthrough in the Brexit negotiations, and a possible way forward. These types of news releases are inclined to be put down to rumor and conjecture and can often cause spikes and rapid reversals in price action.
Therefore, while Fibonacci is a very useful way of reading and predicting moves, we will always advocate that they are used in tandem with other tools, such as up to the minute news releases
information (being informed), Stochastics (overbought and oversold) indicators, Bollinger bands and focus on key exchange rate levels, especially round numbers. Also, always be mindful of economic new release schedules, which can also adversely affect price action.
The AB=CD Harmonic Pattern is the most basic and common pattern in harmonic geometry. It is the building block of all other patterns. It is the ‘bread and butter’ pattern. Pesavento and Carney recommended that this pattern should be learned first – and reading this article does not qualify for having learned this pattern. Like any form of analysis, you will need to regularly and consistently train your brain and eyes to find this pattern. You won’t be able to get very far in the study of harmonic patterns until you can see this pattern just by glancing at a chart.
CD is an extension of AB, generally from the Fibonacci ratio of 1.27% to 2.00%.
CD’s slope is steep or longer/wider than AB.
BC often corrects to the Fibonacci ratios of 38.2%, 50%, 61.8%, or 78.6%.
AB=CD Pattern Reciprocal Ratios
Point C Retracement
BC Projection
38.2%
24% or 261.8%
50%
200%
61.8%
161.8%
70.7%
141%
78.6%
127%
88.6%
113%
Sources: Carney, S. M. (2010). Harmonic trading. Upper Saddle River, NJ: Financial Times/Prentice Hall Gartley, H. M. (2008). Profits in the stock market. Pomeroy, WA: Lambert-Gann Pesavento, L., & Jouflas, L. (2008). Trade what you see: how to profit from pattern recognition. Hoboken: Wiley
Wave five is the last movement in the direction of the trend. In this educational article, we will review two ways to trade the fifth wave.
Trend following
The first
Wave five is the last movement in the direction of the trend. In this educational article, we will review two ways to trade the fifth wave.
Trend following
The first
Wave five is the last movement in the direction of the trend. In this educational article, we will review two ways to trade the fifth wave.
Trend following
The first choice to trade the fifth wave is looking to join the primary trend. The following chart shows the trading setup.
There are two ways to place the order. The first option is following the retracement of a wave 4, which could extend from the Fibonacci levels 23.6% to 50%. The second option is to wait for the breakout and close above wave B of wave four.
For the invalidation level placement, we have to remember the Elliott Wave rule “wave four never end in the territory of wave one.”
To define the profit target levels, we use the Fibonacci projection from waves 3 and 4. In this case, the first target will be at 61.8%, the second at 78.6%, and the third target at 100%.
In some cases, if wave three is the extended wave, there is the possibility that wave five has the same extension that wave one.
Ending diagonal pattern
The second alternative to trade the fifth wave is when the price action builds an Ending diagonal pattern. In this case, we have two options to enter the market. The first one is to place the order after the breakdown of the lower trendline. The second one is after the close under the swing of wave 4.
The invalidation level is above the wave 5, and the profit target is at the end of wave 2.
The fifth wave in the real market
The next chart corresponds to PayPal Holdings (NYSE:PYPL) in its 8-hour timeframe. PYPL developed a rally from the Christmas 2018 low at $76.70 per share.
From the bullish cycle, we observe the wave three and the retracement developed by wave 4. PYPL retraced until the Fibonacci level 38.2%. In this sense, we can look for long positions from 23.6% until 50% of the Fibonacci retracement.
The price action drove to PYPL until 61.8% of the Fibonacci projection at $121.48 on July 16, 2019. As can be noted, PayPal Holdings started to decline once it reached the highest level of the year.
The invalidation level could be placed on two different levels. The first one is at the end of wave one at $94.59. The second alternative is at the 61.8% of the Fibonacci retracement at $97.34 per share.
The next weekly chart corresponds to the e-mini NASDAQ futures (CME:NQ). In this example, we observe an ending diagonal structure.
The sell position could be placed in two different ways, after the lower trendline, or once the price closes below the end of wave 4. Finally, NQ dropped until the bearish target at the end of wave 2 at 1,457.75 pts.
Leonardo da Pisa developed the Fibonacci sequence in the thirteen century. The series starts like this: 1-1-2-3-5-8, and so on. Elliott, in his work “Nature’s Law,” said Fibonacci provides
Leonardo da Pisa developed the Fibonacci sequence in the thirteen century. The series starts like this: 1-1-2-3-5-8, and so on. Elliott, in his work “Nature’s Law,” said Fibonacci provides
Leonardo da Pisa developed the Fibonacci sequence in the thirteen century. The series starts like this: 1-1-2-3-5-8, and so on. Elliott, in his work “Nature’s Law,” said Fibonacci provides the mathematical basis of the Wave Principle. In this educational article, we will review how to apply the Fibonacci sequence to the Elliott Wave Theory.
The Fibonacci ratios
The Fibonacci sequence has its origin in Leonardo da Pisa’s work, “Liber Abacci.” In his work, the mathematician responses to the question:
How many pairs of rabbits placed in an enclosed area can be produced in a single year from one pair of rabbits if each pair gives birth to a new pair each month starting with the second month?
The answer to this question resulted in the series calculated as follows: The first month, there will be zero plus one that results in one pair. The next month, the rabbits will reproduce, expanding to two pairs. In short, the sequence of rabbits is as follows, 0, 1, 1, 2, 3, 5. The series concludes that at the end of the year, there will be 144 pairs of rabbits.
From the Fibonacci series, we obtain the main ratios of this sequence; these are 0.618 and 1.618; this number is known as the Golden Ratio.
In the Elliott Wave Analysis, we use some specific level to evaluate the retrace and potential next movement of the market; these levels are as follows:
Retracement:
0.09
0.146
0.236
0.382
0.5
0.618
0.764, some authors prefer to use the 0.786 level.
0.854, some authors prefer to use the 0.886 level.
Expansion:
0.618
1
1.272
1.414
1.618
2
2.272
2.618
Use of Fibonacci tools in the financial markets
Until now, we used neither a mathematical method to determine price targets. Consider that the price action is not compelled to respect a Fibonacci level by itself. These tools provide a probability zone to a reaction.
The following chart corresponds to AT&T (NYSE:T) in its daily timeframe. The bullish cycle started on August 24, 2019, when T found buyers at $30.97 per share.
The first Elliott wave movement calls for a leading diagonal structure, which made the wave 1 of Intermediate degree. Using the Fibonacci retracement tool, we observe that wave (2) retraces near to 38.2% o wave (1).
The wave (3) accomplishes the rule that commands “wave 3 is the largest wave.” In wave (4), we observe that respect the alternation rule that says, “if wave two is simple, wave four will be complex, and vice-versa.” This wave retraces between 23.6% and 38.2% of wave (3).
Finally, from wave (5), the price action drove to strike over the upper-line of the ascending channel.
Hello, and welcome to this latest edition of courses on demand brought to you by Forex dot Academy. In this course, we will be
[embed]https://youtu.be/11pW-JTdYHQ[/embed]
Hello, and welcome to this latest edition of courses on demand brought to you by Forex dot Academy. In this course, we will be
Hello, and welcome to this latest edition of courses on demand brought to you by Forex dot Academy. In this course, we will be discussing an introduction to Fibonacci. There is, of course, in risk when trading in the financial market. So, just before, we do begin please take a moment to familiarise yourself with the following disclaimer.
So, in this lesson, what, we hope to cover is really develop a basis with the introduction to Fibonacci. What is it all about and how do, we use it? As a technical indicator, we’ll discuss its mathematical significance, and it does actually have some significance in many walks of life in nature. We will discuss it as a technical indicator in relation to its support and resistance. So, that is really what It does. It looks for these areas within the market that, we look for trading opportunities, on congestion of price action around levels of support, and resistance. We will be really discussing how to use it as an indicator. Looking at these Fibonacci levels how to use it from high to low in the markets, and how significant. It can be, as a technical influence on our trading, and then we’ll be discussing some of the limitations obviously, as a technical indicator many other technical indicators. As technical analysts, we know and accept that they have various limitations. We’ll discuss the limitations of Fibonacci retracements themselves. So, let’s delve into our introduction to Fibonacci retracement levels, and these levels are very important to technical traders, as the highlight long-term support, and resistance levels that often identify potential market reversals. It is perhaps one of the most commonly used techniques that indicators, and us such generates additional interest when the market rates in, and around these levels okay. So, as technical traders, we are aware of these levels within the market, and that actually generates an additional level of interest, and is often a self-fulfilling prophecy, as price movement tends to react quite volatile and shift away from such levels. As an indicator, it is more applicable to trading longer time frames and is not suitable for trading shorter time frame analysis, for example, five-minute price action charting. Okay, however, given its objective in identifying potential reversal signals. It does work much better in markets that experience long-term volatility, and continued price change, and we will discuss this in much more detail throughout the webinar.
It is much more applicable for those markets that experienced volatility obviously, if we’re looking to trade off levels were, we see market pullbacks, we see levels of contraction, and potentially look to buy from those areas, if it’s selling off in that direction that fall eternity will actually give us opportunity with our Fibonacci retracement levels. So, these Fibonacci retracement levels, they alert traders to possible support and resistance areas in the market. A possible reversal is based on the prior move.
Okay, so, we’re looking potentially for market pullback to reverse, and the trading decision a bounce is expected to retrace a portion of the prior decline while a correction is expected to retrace a portion of the prior advance when a market pullback occurs technical traders identify a retracement levels for monitoring okay, and because, as I said, they are a self-fulfilling prophecy many traders are speculating in, and around these areas, we know how they’re going to react let’s say potentially the market is trading at all-time highs, and it pulls back to a 50 percent a level of retracement, we know that is very significant, and an area, where many traders are indeed monitoring the Fibonacci retracement has of course mathematical significance. It derives its values from a series of numbers these numbers were developed by Italian mathematician Leonardo of Pisa they’re in 1175 to 1250. So, those are the Fibonacci numbers they’re ranging from 1 to 144, and of course, they continue in the Fibonacci sequence, they are very significant, and, we often see them in many natural Universal proportions both mathematicians, and scientists conclude that their significance you can see them, and, as you look at the image there to the left resembles almost a share like, and make sure that you see on a beach with the formation of the swirl the Fibonacci swirl very famous indeed, they are important to us, as traders, as, they can identify these possible levels in the market support or resistance traders often trade these levels or look for breaker, and opportunities. So, when, we see them bounce from, as support to resistance within a level, they can often range, and that can cause range buying opportunities for a long consistent period of time or perhaps when these eventually break down, we can look for these breakout opportunities there is an acknowledgement of such levels often because trading congestion that leads to I suppose a lot of interest within the markets at these key for Fibonacci levels that’s generally what we’ll see there are a lot of speculative traders looking to trade these levels, and, as prices congest down to these levels that’s why you often see a breakouts after a mature trading trend almost expires from the level you can see a quick shift a quick burst of a volume in, and around these levels.
So, they’re technically very significant. Let’s discuss our Fibonacci levels, as technical support, and resistance for a moment in identifying in January levels of support, and resistance this obviously helps traders to discover both floors, and ceilings in the market okay. So, these prices are often supported by floors unresisted by the ceilings just like our house there, we have an image of the house, where the floor is actually supporting I say your body weight, and everything in the house on the ceiling would be resisting anything from the outside have perhaps weatheror rain anything like that a downward pressure on the house itself these levels are particularly important over long periods of time, they are never a sure signal just like many other technical indicators prices often breakthrough such levels with strength, and, we see that, as a breaker, and, where exactly this is the common question, we get asked, as trading educators, where exactly should support, and resistance levels be pray be placed in the markets. So, here, we have a gold market, and, we can observe just technically, where you see our technical levels of support, and resistance, and it’s really not too difficult a question to ask why do, we choose these levels of support or resistance well, as, we look at the gold market we’re looking at the daily comments like structure albeit it’s over a long period of time, we can see that there are very significant areas or inflection points within these markets, we can see, we have a long-time high in, and around, and when, we have our level of support one-three-five-six, and of course, we have some very strong bounces from such an area. So, what I’d like to do is actually highlight some of these areas within the market here these areas, of course, I’m going hole we’re back to 2014 it’s technically significant for us. It is a long-time high in regards to the last three years of price action, and obviously the market has concluded that, It cannot break these highs for a long period of time that would lead us to believe that this level of support or resistance either one-three-five-six level is technically significant but, we can see throughout that there are some very important price inflection points here would be another level where we can see yes the market traded down all but a few times but. It punched quite strongly from these levels did break it on several occasions, but you can see over the long term. It does provide some real technical support, and, we get some very consistent bounces from the area these areas can convey an or these bounces can actually only last for a I suppose a short period of time, as, we see our next level of support holds up quite well over many significant areas within the market.
So, these are genuine levels of support, and resistance over the long term in the markets that seem to hold up, and quite well how does this relate in terms of ahead establishing the Fibonacci retracements well that is the real focus of Fibonacci retracement. It is to look for further levels of technical support, and resistance that can give you more evidence to actually look a tradeoff these areas or levels. So, as I move across to in the price chart here this is the dollar-yen daily chart the question I would like to pose for technical traders is how do we identify genuine levels of support, and resistance within the markets well let’s try, and look at, and just visibly see for a moon, if, we can see some highs, and lows over the price action that can give us our own identifiable levels of support of resistance obviously in observing these price action charts, we can see initially that some will be more significant than others. So, here, we have three very strong structured highs, and lows within the markets and they’re providing some technical support, and within this technical support, we have about a few various branches that are providing perhaps some shorter time levels of support and resistance. So, just by observing the price section chart what, we can do is look at these previous highs, and lows existing in the markets to give some technical at January levels of support, and resistance let’s look at identifying this technical support, and resistance areas over asset classes here on what, we have in front of us is the German DAX it’s an equity index in Europe, and, we have daily price action from left to right, we can see already, we have placed an overlay of some genuine levels of support, and resistance again they’re based on previous highs, and lows which give us a very strong inflection points within the markets what, we can see here is that we have a ceiling that is actually providing resistance over a sustained period of time, and, as the market trades up through, and breaks that level that ceiling then becomes a floor in the market. So, it’s very important to note that, as, we trade the markets can break through these levels, and obviously once the breakout occurs that previous level of support and resistance has actually faltered, and can actually change or shift to become a new level of support or resistance in the market
That again provides us with trading opportunity, as, we look to more relative price action we’ve seen a very strong break to the downside in this German DAX market, and that breakout opportunity has moved quite swiftly in terms of the price, and that’s generally what can occur in these markets we’ve seen the floor here. It provided support over a sustained period of time the market, and trade up to new high reverted from new highs, and with that weakness looking at the Japanese the structure of that Japanese candlestick, we see a very strong consistent breakthrough to the downside over of our new floor here, we have the gold market in front of us again, if, we look at the price section its daily candlesticks, and moving from left to right over a long consistent period of time what, we can see is a technical overlay is actually a Fibonacci retracement, and it is extending from a recent high to low point. So, that’s how we actually use these Fibonacci indicators, we look for a recent a real high or low point or a high to low, and actually stretch the indicator from those areas that stretch across our Fibonacci retracement levels of support, and resistance. So, it creates these retracement support levels, as a function of the Fibonacci numbers, as a technical indicator. It works better for particular asset classes, and, we will discuss that again in more detail, and the question I would like to pose is what happens next, we can see the blue circle indicating almost relative price action, and it is our 23.6 Fibonacci retracement level well what happens next, we know that there could be a significant move from this level, we could see a points up to new highs again or, we could see the price break down I have from our Fibonacci retracement level right the whole way down to 38.2 potentially lower over 50% retracement level. So, let’s branch across to a different asset class here in front, we have the US dollars are, and the question again I would like to pose here, where exactly do, we place the Fibonacci retracement indicator, if, we remember back to the previous slide we’re looking for a high, and low within this market something that can give us a real genuine insight, as to, where the Fibonacci numbers may be significant we’re not looking to perhaps pick a high, and a low from the past week we’re looking for an overall a genuine level of reflection over that consistent period of trading looking at these daily candlesticks high, and low that can give us a subjective level to, where the indicator is more observable. So, here, as, we input our indicator ins in the market, we can see the most recent long term high in the most recent long term lows are the most significant areas in which to place this Fibonacci indicator. So, let’s delve into the actual study of Fibonacci retracement, as a technical indicator in terms of what it means for our trading notice that I’ve used this market before quite a few times the gold market because gold is quite significant in terms of technically adhering to the Fibonacci retracement level, and again I wanted to use this because it is a good example, to use the indicator, and actually applying it to the markets. Notice in this chart, now, that I have my Fibonacci level, as the second most recent high there, and I want to really give you this, as an indicator in terms of high price section moves, as, we look to trade.
So, let’s just say for example, we begin trading where, we have our begin trading point marked how could, we look to perhaps trade this in terms of looking for levels of support, and resistance, and pullbacks within the market, and actually looking to trade, and corrections or our bounces from such levels will be, we have here our green circles here which actually give us very good strong signals to trade this market, we can look to buy or sell, as the market trades up or down between our indicator levels. So, very good term structures indeed but notice again that, we have some areas, where the signal actually is a pure signal on. It actually gives us some losing trades, if, we decided how it decided to take these trading positions on. So, there is a level of inconsistency with the indicator itself and, if we hadn’t started other begin trading signal there, we would have made have various good trades, and a few bad trades, as well. So, there is that level of inconsistency again, as, we approach our most recent price action the question is often well what happens here what’s going to happen next, and all, we can do is observe the price actually ask technical traders looking for closing perhaps the structure of the Japanese candlesticks – – perhaps volume, and momentum shifts to see, if we can get more of a signal that this market will actually bounce from this level or break through it, we know that it’s technically significant and that many other traders are focusing on monitoring their technical trading decisions around this retracement level. It is the awareness of these Fibonacci levels therefore that the markets often focus their attention on this can then become a self-fulfilling prophecy, as traders observe price action around these levels, and that leads us nicely on them to discussing the limitations of Fibonacci retracement, as a technical indicator the underlying principle of any Fibonacci tool is only a numeric anomaly and is not grounded in any logical proof, and that is a very important point to make there, guys. Okay, just like any other indicator of the Fibonacci retracement is not a standalone signal that, we can use for trading decisions, we could potentially look for let these levels of support, and resistance of course, and look how a price-action and trades around these areas perhaps congest perhaps there’s more volatility perhaps there is more volume but, we can see that. It is inconsistent in terms of providing us with assured signals or logical proof that this market is either going to reverse or look for sustained movement and from a breakthrough.
So, it is only one indicator, and to be coupled or used to try, and heighten your probability of a trade the indicator is not applicable to all asset classes to another’s one of the reasons of course why I chose to present the Forex pairs in the gold market again because those markets are quite volatile over the long run, they can see a shorter-term shifts in sentiment, they can see shorter-term shifts in trend, and status, as well, and that’s what we’re looking for. We’re looking for potential pullbacks in these markets, where the Fibonacci retracementcan be met, and actually look for trading opportunities again, if I use the example, of an equity market or an equity market bull run, and which were actually seen in the markets. Now, we aren’t given the best opportunities in terms of seeing these long-term Corrections or volatility to maybe get, as many trades off from our long-term high-to-low, and Fibonacci retracement perhaps, if, we see a real structured correction in an equity market that can give us a signal, and to maybe look for a pullback in the Fibonacci retracement pergolas, we know that volatility isn’t, as such that, we get. So, many variants of price action over a long term price action chart when observing the equities. So, it, as an indicator is not, as applicable to observing such asset classes, as equity markets class retracement only points to possible Corrections reversals on counter Tran bounces and struggles to confirm any logical buy or sell signals, and that is very significant for us, as traders, we know that we’re very much concerned with trying to find these big moves in the market, if you’re particularly a long-term trader you’re looking to either buy or sell the market, and have a directional bias in the long term the Fibonacci retracement given that it’s looking for pullback. So, market reversals or counter-trend bounces it’s looking to find out volatility to find, and perhaps opportunity within the volatility. It doesn’t actually give us those buy or sell long-term signals in the markets. So, that’s very significant in terms of trying to try, and trade, and it doesn’t necessarily help her age or decision making whatsoever, and of course it can experience a high degree of inconsistency.
This is something we’ve seen even by observing the price charts throughout the webinar we’ve seen the gold market how. It was providing us with some very good signals. It was providing us with some per Cygnus that would have led to some losses of course, as well but that’s part, and parcel of using these technical indicators, they are not always an assured sign of a high probability trade, they can often be quite inconsistent, and that’s why, as technical traders, and certainly when trading Fibonacci retracements. It is advised to look to use many of these technical indicators to really stack the odds in your favour in terms of decision making, as a technical trader okay. So, that brings us to the end of this introduction to Fibonacci webinar. Let’s have a quick review of what we’ve actually learned! Obviously in discussing both introduction to Fibonacci, and mathematical significance, we know that it is derived from the mathematical, as significance really of the Fibonacci sequence, or numbers those in turn, give us an outlay which, we can stretch on to our price action chart, and, they help us derive technical support, and resistance but, they are observable in price inflection points long-term price inflection points that, we can look to look to add our own genuine levels of support, and resistance, if, we can use perhaps the Fibonacci retracement levels across these price action charts, as well not gonna help us, and give us another signal to actually looking for mathematical levels of support, and resistance. So, that could lift a couple upon, and really giving us more probability in terms of a possible level or genuine level within the market. We then went on to actually express these Fibonacci retracement levels across various asset classes. So, we looked at the gold market, and some Forex pairs, and highlighted some trading opportunities there, and that led us nicely into discussing the limitations of Fibonacci retracement, as an indicator, it is often providing us with some very well structured levels of support, and resistance in the market what perhaps is a time very consistent with its trading opportunities given that. It gives us good signals and some false signals, as well. So, that brings us to the end of this webinar. Thank you very much for joining us on this installment of courses on demand brought to you by Forex dot Academy. We do hope to see you very soon. Bye for now.
The market is returning all the gains of the beginning of the week in an interesting movement of the bears that shows that the general trend has not changed and
The market is returning all the gains of the beginning of the week in an interesting movement of the bears that shows that the general trend has not changed and
The market is returning all the gains of the beginning of the week in an interesting movement of the bears that shows that the general trend has not changed and that more consolidated movements are needed in order to define a real change.
General Overview
Market Cap: $263.141.302.151
24h Vol: $15.751.561.828
BTC Dominance: 42.2%
The cryptocurrency market capitalisation has dropped by 10 billion in 24-H
Only 14 of the top 100 Cryptos are in green numbers today, this is showing the big percentage of sellers around.
Top 100 Gainers of the day
Syscoin 49,61%
Decentraland 33,11%
Steem 6,66%
Status 6,54%
SmartCash 6,24%
Top 100 Losers of the day
BCN -16,35%
Golem -14,02%
WAX -12,46%
Mixin -12,24%
Loom Network -11,34%
News
There is not any considerable news that moves the market in the last hours, here is a short summary extracted from the portal CCN.com.
Binance Leads $12 Million Funding Round in the Tokenisation Startup Republic
A retail investment platform called Republic recently completed $12 million in financing to tokenise its platform and introduce its own security token, led by Binance Labs and NGC ECO Fund. The financing round was also supported by ZK Capital, Oyster Ventures, FBG Capital, Hazoor Capital, East Chain, Zhen Fund and others.
Source: CCN.com
Microsoft Launches Enterprise Blockchain Partnership in Taiwan
Microsoft Taiwan has entered into a partnership with Digital China and Hot Cool in the hope that the three companies can use blockchain technology to improve the financial, e-commerce, entertainment, and other industries.
Source: CCN.com
Bermuda Amends Banking Act to Favour Blockchain Startups
Bermuda continues its push to become a global hub for blockchain and fintech innovation, having recently announced plans to change its banking laws to create a class of banks catering to blockchain and fintech companies, according to Finextra. The amendment to the country’s Banking Act follows the recent passage of a Digital Asset Business Act and an initial coin offering (ICO) bill.
Source: CCN.com
COIN MARKET TRENDS ANALYSIS
NEO/USD
NEO is trying to cross the lower side of the bullish pennant pattern in this 60-minute chart after bouncing in the upper side around $37.40. A breakout of this level could be an opportunity to go short in the short term and against the rules of the trend, the bulls have lost strength and they are returning an important part of the 22% of gains of the last two days.
We must wait for a confirmation of the break to enter about $35.31 and look for the $35.17 (Fib. 61.8%) and then the $34.28 (Fib. 76.4). We can go short in $35.31, placing a stop loss at $36.17, take 70% profit at $34.28 and look for the Pivot S2 at $33.16 or the 100% Fib Retracement.
BTC/USD has lost -2.34% in the last 24-H while the buyers weren’t strong enough to maintain the upside momentum and to beat the important resistance at $6,700, with the opening of the Asian Market, the bearish pressure has started and Bitcoin goes back to lower levels close to the Pivot S1 and is sitting at $6,460.
The technical perspective is showing us a possible bounce in this EMA-100 of this 1H chart according to the readings of the RSI and Stochastic showing oversold levels, another test to the EMA-100 could encourage the buyers to push the price again and send it to test $6.676 again.
Market sentiment
Hourly chart signals buy.
Oscillators are leaving oversold levels and neutral.
XRP has returned more than 62% of its last rally in just 24 hours and has not been able to keep the support at $0.4889, at this moment the price is held by the EMA-100 and if a break by the bears happens we could see a fast drop down to the $0.4500 zone.
Market sentiment
Hourly chart signals sell.
Oscillators are in oversold levels and pointing up.
Coin Market Trends: Although a correction in the rise was expected, this has been quite long and it is still possible that we continue to see minimums in most of the pairs while the BTC continues to feel the pressure of the sellers.
US Trade Balance Falls.
Euro raises supported by ending bonds debate.
European Indices Move Sideways.
US Trade Balance Falls
The US Trade Balance deficit falls in April to
Hot Topics:
US Trade Balance Falls.
Euro raises supported by ending bonds debate.
European Indices Move Sideways.
US Trade Balance Falls
The US Trade Balance deficit falls in April to
Hot Topics:
US Trade Balance Falls.
Euro raises supported by ending bonds debate.
European Indices Move Sideways.
US Trade Balance Falls
The US Trade Balance deficit falls in April to the lowest level for seven months, boosted by the shipments of industrial materials and soybeans.
GBPUSD continues moving higher, aided by the weakness in the Dollar Index. For the coming sessions, we expect that the price makes a bearish connector, probably in the 1.348 zone before it sees new higher highs. Invalidation level is at 1.3254.
The USDCHF pair still moves sideways above the bullish long-term trendline. If the price breaks down the trendline, we expect more dips. In the first instance to the target should be 0.9783; in the second instance, the next support is 0.9725. Invalidation Level is 0.9983.
Euro Raises Supported by Ending Bonds Debate
In the next week, the ECB could start to debate the end of their bonds buying said Peter Praet, the ECB chief economist. This is not the first signal of the QE ending, on May 29th, the ECB member Sabine Lautenschlaeger noted that “June might be the month to decide once and for all to gradually end net asset purchases by the end of this year.”
EURUSD continued rising after the flag breakout and supported by the macroeconomic data. The next resistance levels are 1.1889, 1.19635 and 1.2102. Invalidation level is updated to 1.1616.
EURJPY continues its rally that started on May 29th when it tested the support 124.621. The first corrective structure it developed was brief, this move makes us suspect that the rally continuation could lead to the 132 to 133 area. In the short-term, the cross could see the 130.270 level for bringing steps to a consolidation structure before it continues the bullish cycle. Invalidation level is 126.330.
EURNZD is making a bullish connector inside a bearish major degree structure. Our vision is that the price could visit the area between the 38.2% to 50% of Fibonacci Retracement before it continues its downtrend. In the short-term, the price made a breakout of the 1.6713 level; this move could lead the price to areas between 1.6866 as first resistance and 1.6947 as the second resistance. Invalidation level is below 1.66.
European Indices Move Sideways
The FTSE 100 is moving in a range between 7,680 and 7,720, expecting more volatility. The price could make a limited high completing an A-B-C pattern before it continues the bearish cycle.
The DAX 30 is running sidelong but could complete three waves move in the zone between 12,946 to 13,014 pts before it continues the bearish sequence started on May 23rd, with the bearish target in the 12,528 pts area. If the price plunges below 12,386, the DAX could complete the bearish cycle near to the 12,000 pts. Invalidation level is updated to 13,102.7 pts. In case that price breaks above this level, the next bullish target is 13,250 pts.
The cross is developing a bearish structure that has reached the level of Fibonacci retracement F(61.8) 1.07181, from where we turn on alerts of the possible formation of a reversal pattern that could lead to new highs. Our objective level is 1.1363 and in the longer term the levels 1.17 and finally 1.21. The invalidation level is 1.0222.
Background
Traders use the Elliott Wave mostly as a continuously developing price map, on which they try to guess the most probable future path. Sometimes the trader waits for
Background
Traders use the Elliott Wave mostly as a continuously developing price map, on which they try to guess the most probable future path. Sometimes the trader waits for
Background
Traders use the Elliott Wave mostly as a continuously developing price map, on which they try to guess the most probable future path. Sometimes the trader waits for some unfinished wave to end, to pull the trigger or take profits. When this occurs, he or she commonly uses Fibonacci ratios in trading to forecast a price level for that event.
Ian Copsey on his book The Case for Modification of R.N. Elliott’s Impulsive Wave Structure, says he has found that harmonic ratios derived from the square root of two are also a very helpful tool.
My personal belief is that those ratios are really artefacts, a product of the random nature of the trading activity. In the age of computers and Big Data, a statistical study on the retracements ratios might reveal much more precise information about those proportions. Even better, a computer study might be developed to show the most likely retracement levels as a function of the latest N-retracements, taking account of the recent volatility changes.
Nonetheless, Fibonacci ratios and Sqrt-2 ratios may serve as an approximation to forecast retracements or extensions when a better information tool is unavailable.
Fibonacci
Leonardo Pisano Bigollo (1170-1250), known as Leonardo Fibonacci, was an Italian mathematician and traveller, who studied and brought the Indo-Arabic numerical system to Europe. This revolutionary numerical system on which the absolute value of a digit is established by its position within the number made possible the mathematical and scientific revolution in Europe.
In his Liber Abaci book of 1202, Fibonacci introduced the arithmetic systems he learned from the merchants working on the Mediterranean coast that he called modus Indorum (The way of the Indians). The book made a case for a 0-9 digits and place value, as well as examples of how to use it in business to calculate interest rates, money-changing, and other applications.
The Fibonacci sequence
The book also discusses irrational numbers, prime numbers, and the Fibonacci series, as a solution to the problem of the growth of a population of rabbits.
The Fibonacci sequence starts with two ones: 1,1. The following numbers in the series are calculated as the sum of the preceding two numbers. He carried the calculation up to 377, but he didn’t discuss the golden ratio as the limit ratio of consecutive numbers in the sequence.
Below, Table 1 shows in yellow the first 27 Fibonacci numbers. The other columns, from 1 to 6 show the results of the n-following divisions, as a percentage. That is the result of dividing the Fibonacci number by next one, two apart, three apart etc.
The last column shows the stabilized Fibonacci ratios generated:
Table 2 shows the Fibonacci ratios of the n-preceding division as a percentage.
As with the preceding table, the last column shows the stabilized Fibonacci ratios generated:
Two more sets of Fibonacci multiplying ratios are obtained by multiplication and division of the N-following ratios:
As we can observe, except for ratios smaller than 5% and the 100% ratio, all of them are already present in the original series.
The Square root of two
Well, the square root of two is the first known irrational number, and the one that raised heated passions in ancient Greece, that ended with a crime. At a date around 520 BC, a man called Hippasus of Metapontum was dropped from a boat into open waters to die. The man’s crime was revealing to the world a “dirty” mathematical secret. The secret of the relation between the sides of the square triangle of length 1, and its hypotenuse.
According to the well known Pythagoras theorem, the sum of the squares of the sides a rectangle is equal to the hypotenuse squared.
Therefore, for unity sides: 12+12 = 2, therefore the hypotenuse length is the square root of 2.
The square root of two including its four decimal places is 1.4242
This article is not focused on the proof that the square root of two is not rational, so I’d recommend the curious reader the following page:
Ian Copsey explains that he was told about this ratio applied to the markets by some acquaintance, who stated that it was commonly occurring between musical notes.
After studying it, Mr Copsey began to find out that two derivations of this ratio usually happened: 41.4% and it complementary 58.6%, being 100-41.4%.
Usual wave relationships
Ian Copsey says in his book that, after many research hours into normal relationships between waves, he has found the most usual to be:
To this list, you can add those derived from the square root of 2: 41.4% and 58.6%.
And, specifically on Wave (iii), it’s possible to take those ratios and add 100%, 200% and on occasions 300% and 400%.
The most common extensions he has found were: 138.2%, 176.4%, 223.6%, 261.8%, 276.4%, and 285.4%. Additionally, but less frequently, he found 158.6%, 166.7%, 238.2%, and 361.8% and occasionally 423.6% and also 461.8%
It’s important to observe the underlying ratios of a particular market trend. It’s better to stick with the ratios that often show in the most recent retracements of the same kind.
As is usual, the help of visual channels, spotting important supports and resistances or pivot points may show which one of those ratios best fit the rest of the clues.
It is also noteworthy that the projections of the Wave (v) and also of the Wave (c) should match the end of higher-order waves as well, so the most probable final ratio is the result of that confluence.
The data below was taken from Mr Copsey’s study, published in the referred book.
Wave (i)
There is no relationship to any previous wave as this is the start of a five-wave sequence.
Wave (ii)
This is a corrective wave of Wave (i). This retracement is one of the most difficult to assess. According to Ian Copsey, it can go from 14.5% up to 100%. He also mentions that on a 5 min chart it’s complicated to observe the sub-waves composing Wave(ii), however on a daily chart it shows the typical A-B-C pattern or, even, more complex patterns.
Wave (iii)
Wave (iii) is an extension of Wave (i), projected from the end of wave (ii).
Projections:
The most typical forecast are 176.4%, 185.4%, 190.02%, 223.6%, 276.4%, and 285.4% projections of Wave (i).
Less recurring projections are: 138.2%, 166.7%%, and 261.8%.
Sporadically it goes to: 123.6%, 238.2%, 361.8%, 423.6%, and 476.4%.
Wave (iv)
Wave (iv) is, of course, a retracement starting from the top of Wave (iii). At this stage, noting the implications of the alternation rule with Wave (ii) or Wave (b) there is a stronger basis to identify the end of the pullback.
Potential retracement percentages:
For small retracements: 14.6%, 23.6%, 33.3%, and 38.2%.
For mid retracements: 41.4% and 50%.
For intense retracements: 58.6% and less often 61.8% or 66.7%.
Wave (v)
Wave (v) is an extension of the total price move from the beginning of Wave (i) to the end of Wave (iii), projected from the end of Wave (iv).
Having identified Wave (iv) makes it much easier to build up a projection for Wave (v).
Projections:
The bulk of projections go to 61.8%, 66.7%, and 76.4%.
In a truncated Wave (v), usual ratios are 58.6% and 50%.
In an extended Wave (v), the most usual projections are: 85.6%, 100%, 114.4%, and sometimes 123.6% and 138.2%.
Wave (A)
Wave (A) is similar to Wave (I) in its unpredictability. There is no reference to spot its end because there is no relation to other prior waves. The best method is to find a higher order price channel in which this wave might end, observe support/resistance levels or pivot points.
Another method is to go to a shorter time frame, watch the 5-wave pattern that constitutes the A wave and try to project Wave (v) by matching it with a previous Wave (B) of Wave (v) or the prior Wave (iv).
Wave (B)
Wave (B) is a retracement of Wave (A), but it’s a correction within a correction so that it can be really complicated and random. The retracement ratios range from 15% to 100%. The use of pivot, swing high and low, and support/resistance levels give more clues than simple mathematical ratios.
As stated in other articles, it doesn’t pay to trade Wave (B) or any other 3-wave corrective pattern for that matter, because of it’s poor reward-to-risk ratio.
Wave (C)
Wave (C) is an extension of Wave (A) projected from the end of Wave (B).
Projections:
The most usual projections are: 100%, 105.6%, 109.2%, 114.4%, 138.2%, and 161.8%.
Less common are: 76.4%, 85.6%, 123.6%, and 176.4%.
Sporadic projections are: 123.6%, 223.6%, and 261.8%, but sometimes, as short as 61.8%.
It is important to note that Wave (C) is related to the next higher and lower degrees. Thus, its sub-wave (v) should, also, match Wave (A) extension and, if it’s part of a higher degree’s Wave (iii) or Wave (v), their possible projections.
Wave (x)
Wave (x) usually retrace similarly to Wave (b).
Triangles
Wave a: retraces deeply. In a Wave (iv) this exceeds 50% of Wave (iii)
Wave b: commonly retraces beyond 76% of Wave a
Wave c: projects 66.7% to 76.4% of Wave a, from the end of Wave b
Wave d: 66.7% to 76.4% of Wave b from the end of Wave c
Wave e: a zigzag less than 66% of Wave d
Expanded Flat Corrections
Wave a: 50% of the preceding wave
Wave b: 15% to 38%, occasionally as low as 9% and rarely up to 41%
Wave c: Back to the end of Wave or beyond.
Final guidance
Those values are only a guide. Every market has its characteristics; therefore you should know them to trade efficiently. Additionally, every timeframe behaves differently.
In intra-day trading, you should add pivot points to this analysis as pivots are used heavily by professional traders.
Visual clues offer better information than numerical values. If the projection or retracement touches a trendline drawn on price channel or support/resistance area, then the chance of that projected value increases substantially.
Reference:
The Case for Modification of R.N. Elliott’s Impulsive Wave Structure, Ian Copsey
In the previous article, we’ve exposed a brief introduction to the Fibonacci Sequence, retracements, and projection concepts. In this article, we will show how to make a trading plan using Fibonacci Tools, specifically, the retracement and expansion, although we will not explain Risk or Money Management rules and methods.
In practically all industries, with every task, there are procedures to define what to do in each process stage. Professional traders too, have operating methods. In this sense, retail traders have a significant procedural disadvantage compared with professional traders. A way to reduce this gap is to make a working plan. A Trading Plan is a route map, not a treatise, where we will answer the following questions*:
What market to trade? I.e., Forex, Indices, Commodities, EUR-USD, DAX, Gold.
What timeframe should we choose?
What are the market conditions, the arguments for the entry setup?
Where is our stop-loss level; this is the invalidation level of the scenario.
Where to set a profit target or the objective zone of the trade setup.
Finally, a chart including market conditions and its analysis
* Note that this is not an exhaustive list; the reader could incorporate or eliminate decision criteria.
Practical Example
Once we have a good trading plan, let’s consider a specific market and propose a scenario for a trading opportunity. In figure 1, the cross EUR-AUD <EURAUD> in the hourly chart has lost the latest minimum (1.55681) on the 5th December, then it moved on a retracement segment from F(50) to F(76.4). That area could be a potential entry zone for a short-selling setup on a bearish continuation movement.
Fig 1: Potential Reversal Zone. (source: Personal Collection)
In figure 2, we define Profit Target zones; these levels are FE(100) 1.54099, FE(1.618) 1.52333 and FE(200) 1.51424. The invalidation point is 1.57705; this is the maximum reached on the 1st of December.
Fig 2: Potential Profit Taking zone (source: Personal Collection)
Some entry possibilities are:
Sell Market, i.e. spot price 1.56555.
Sell Limit, i. e., F(76.4) = 1.57026.
Sell Stop, i.e., F(50) = 1.56267.
Sell if price closes below the last low 1.56016.
A summary of the arguments exposed in the Trading Plan example are:
The price has broken down through a relevant minimum, and currently, it has made a retracement to the F(50) – F(76.4), this is a potential zone for a bearish continuation…
Chart
Trade Result (**)
(**) Trade Result: This is not a section for self-flagellation nor a best-trader-in-the-world award as if we were to record +100 pips at the end of a trade. This part is about the “learned lessons” of a finished trade, independently of its result, bringing a higher objectivity to the performance. In summary, the Trade Result is the way to learn about the trades, it is where we have the opportunity to visualise and avoid future mistakes in the execution or to improve the analysis criteria on market entries and exits.

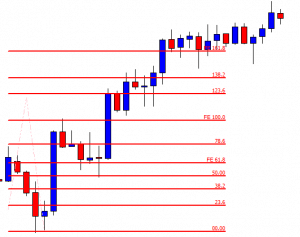
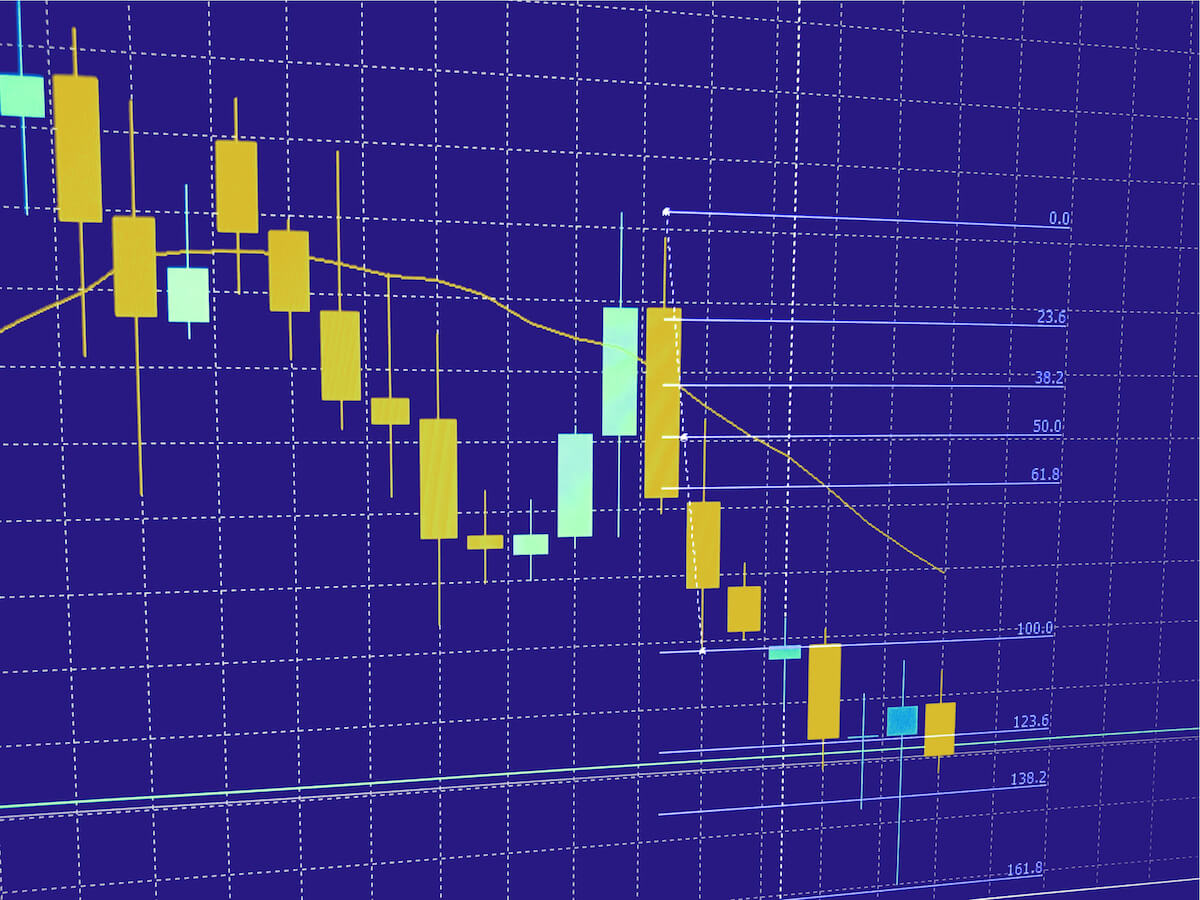
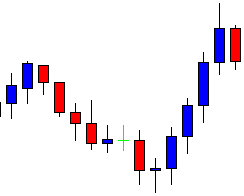
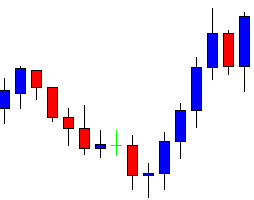
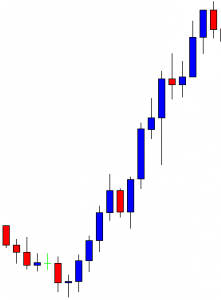
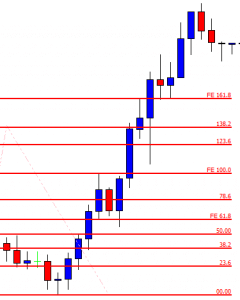
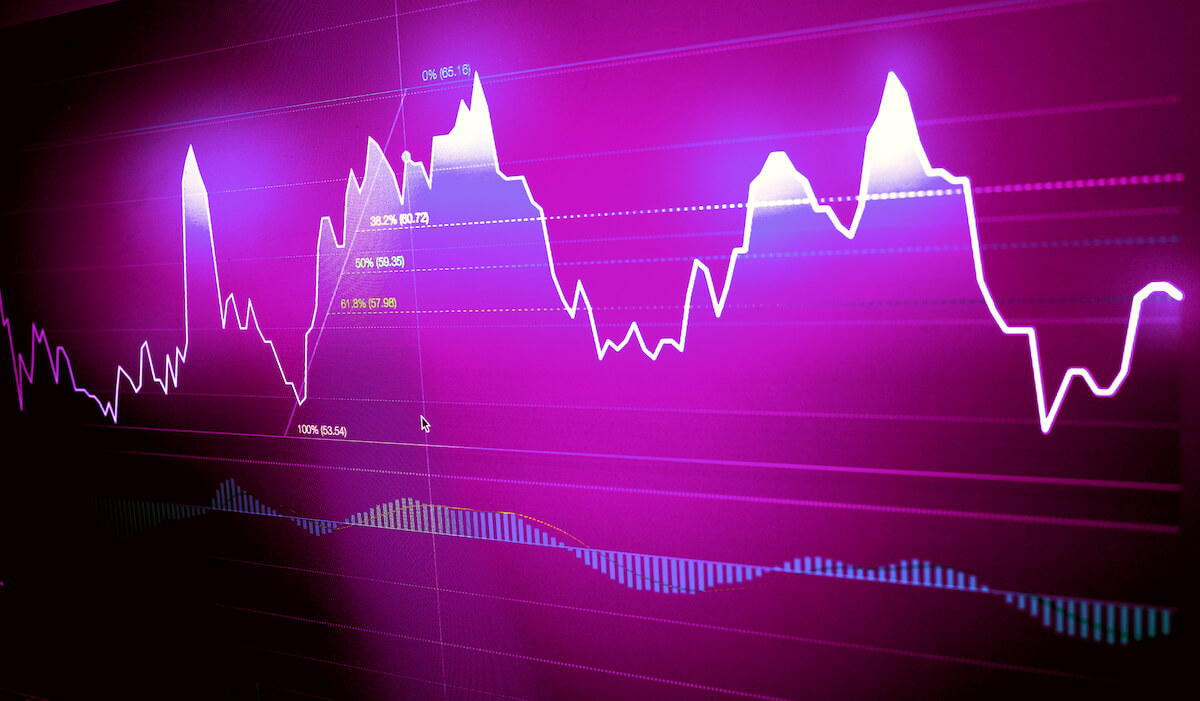
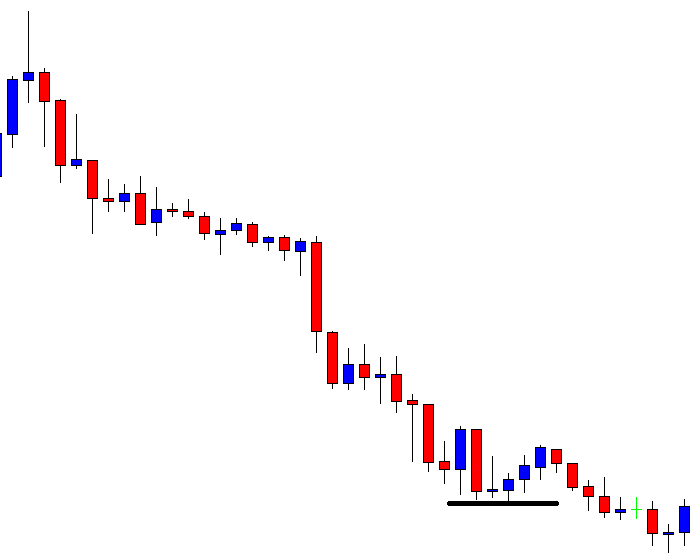
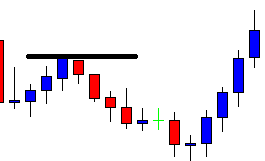
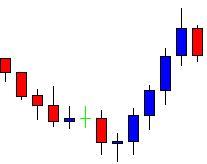
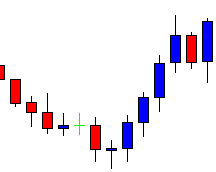
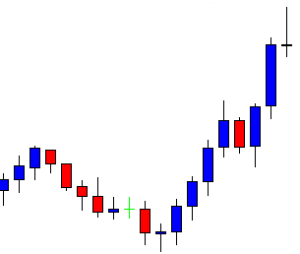
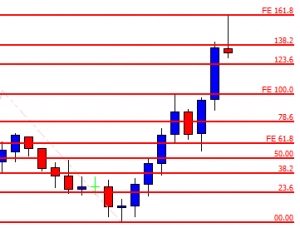

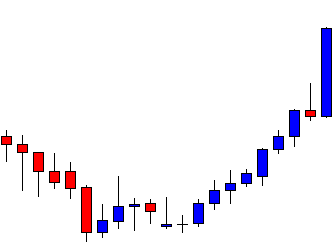
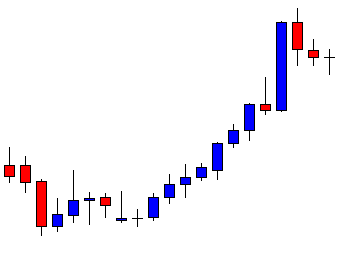
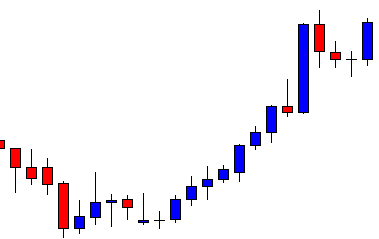
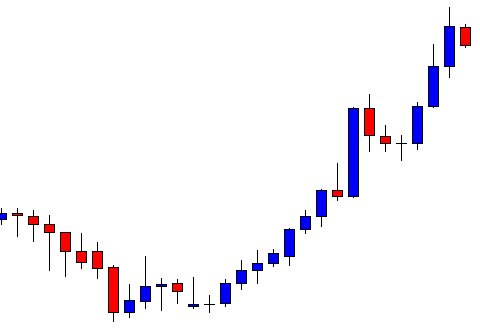
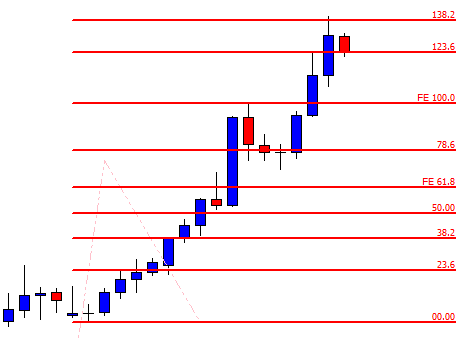
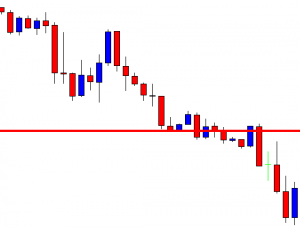
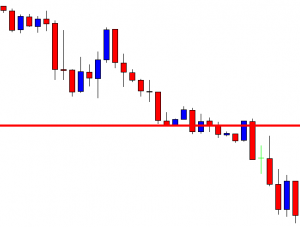
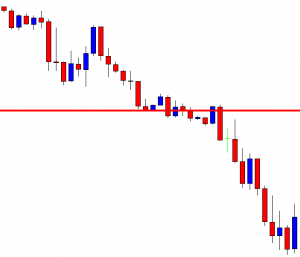
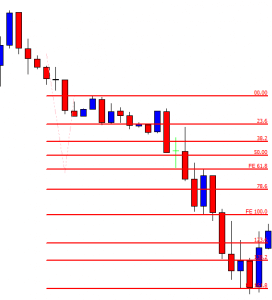

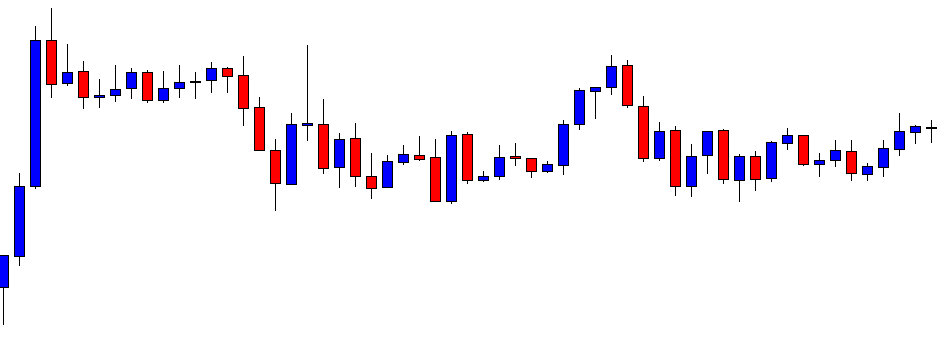
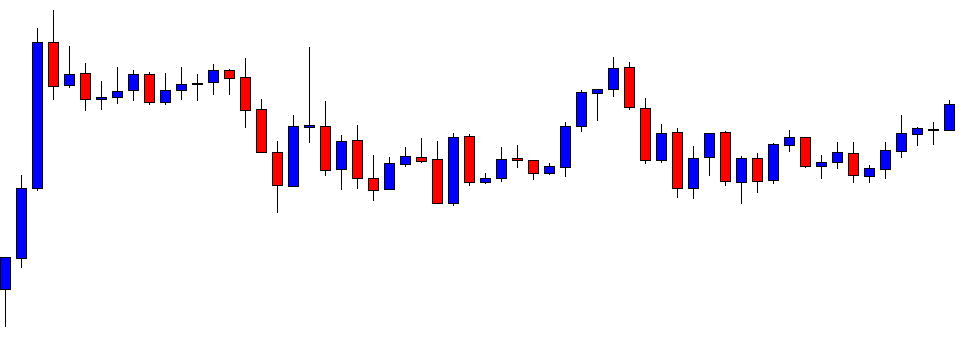
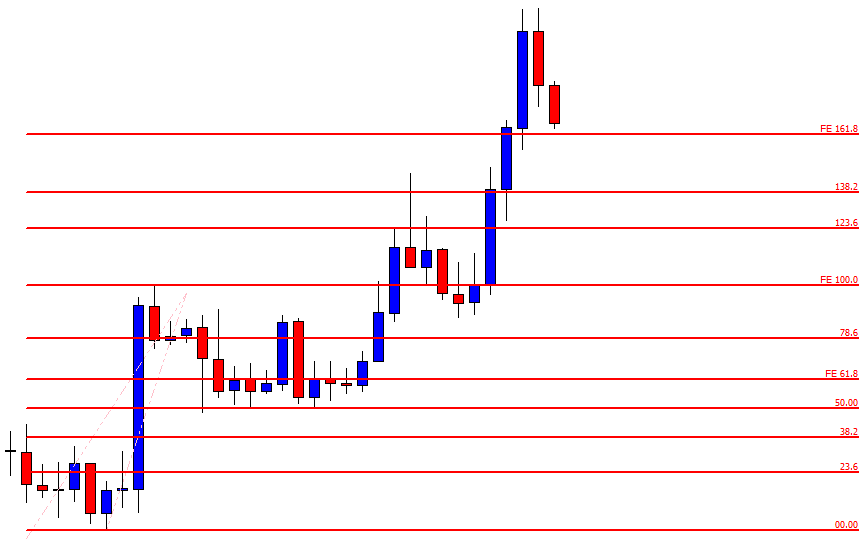
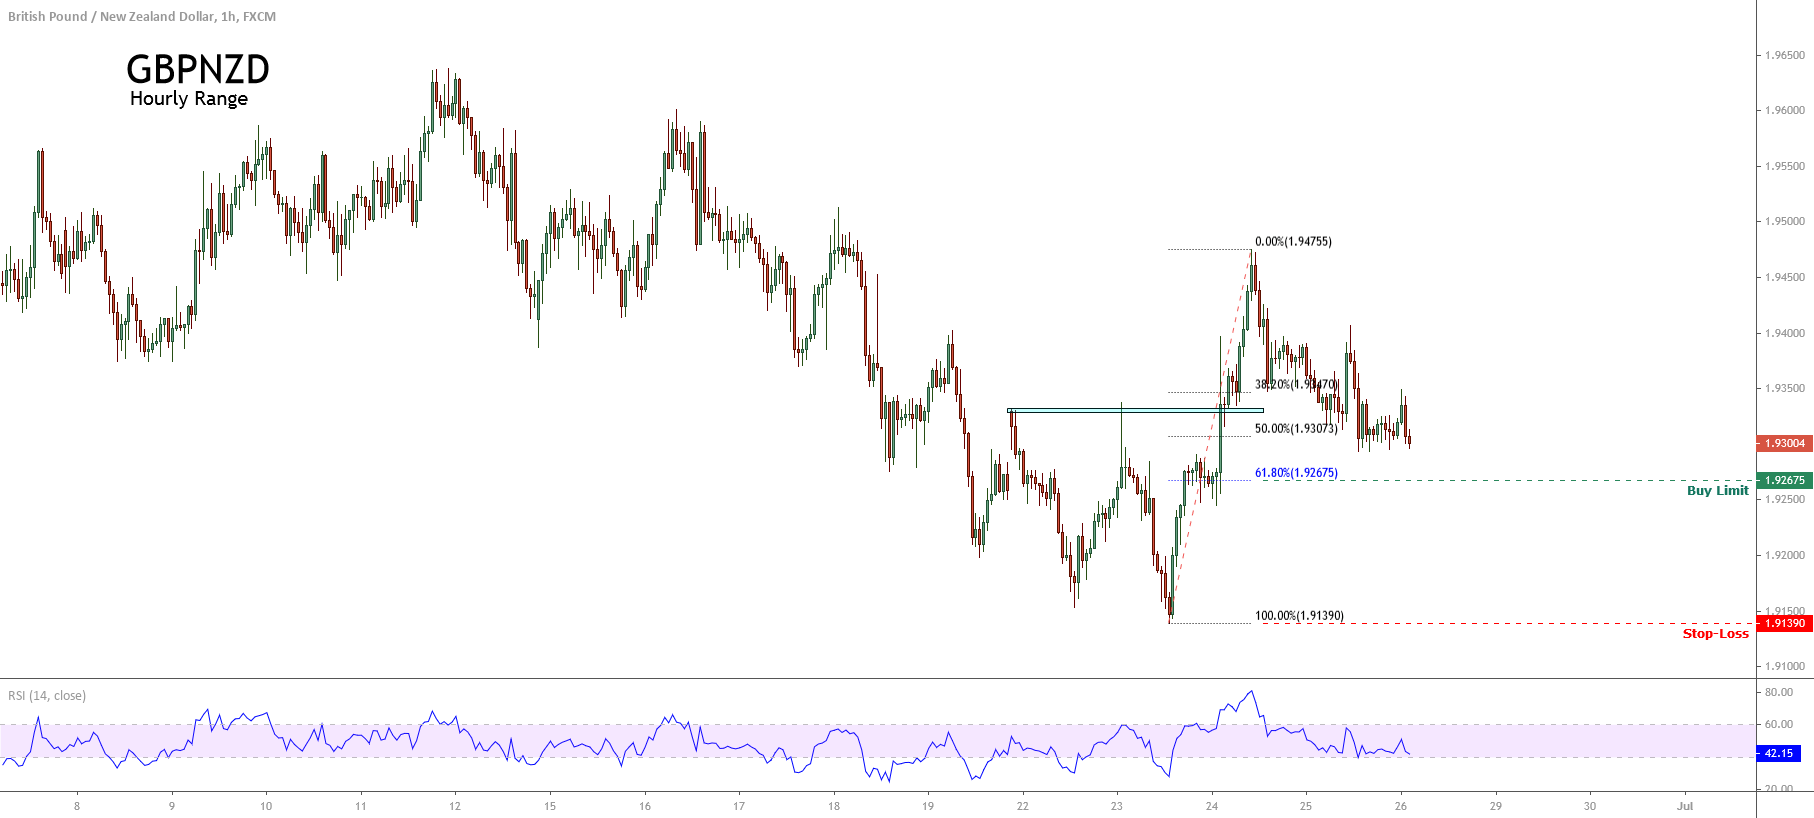
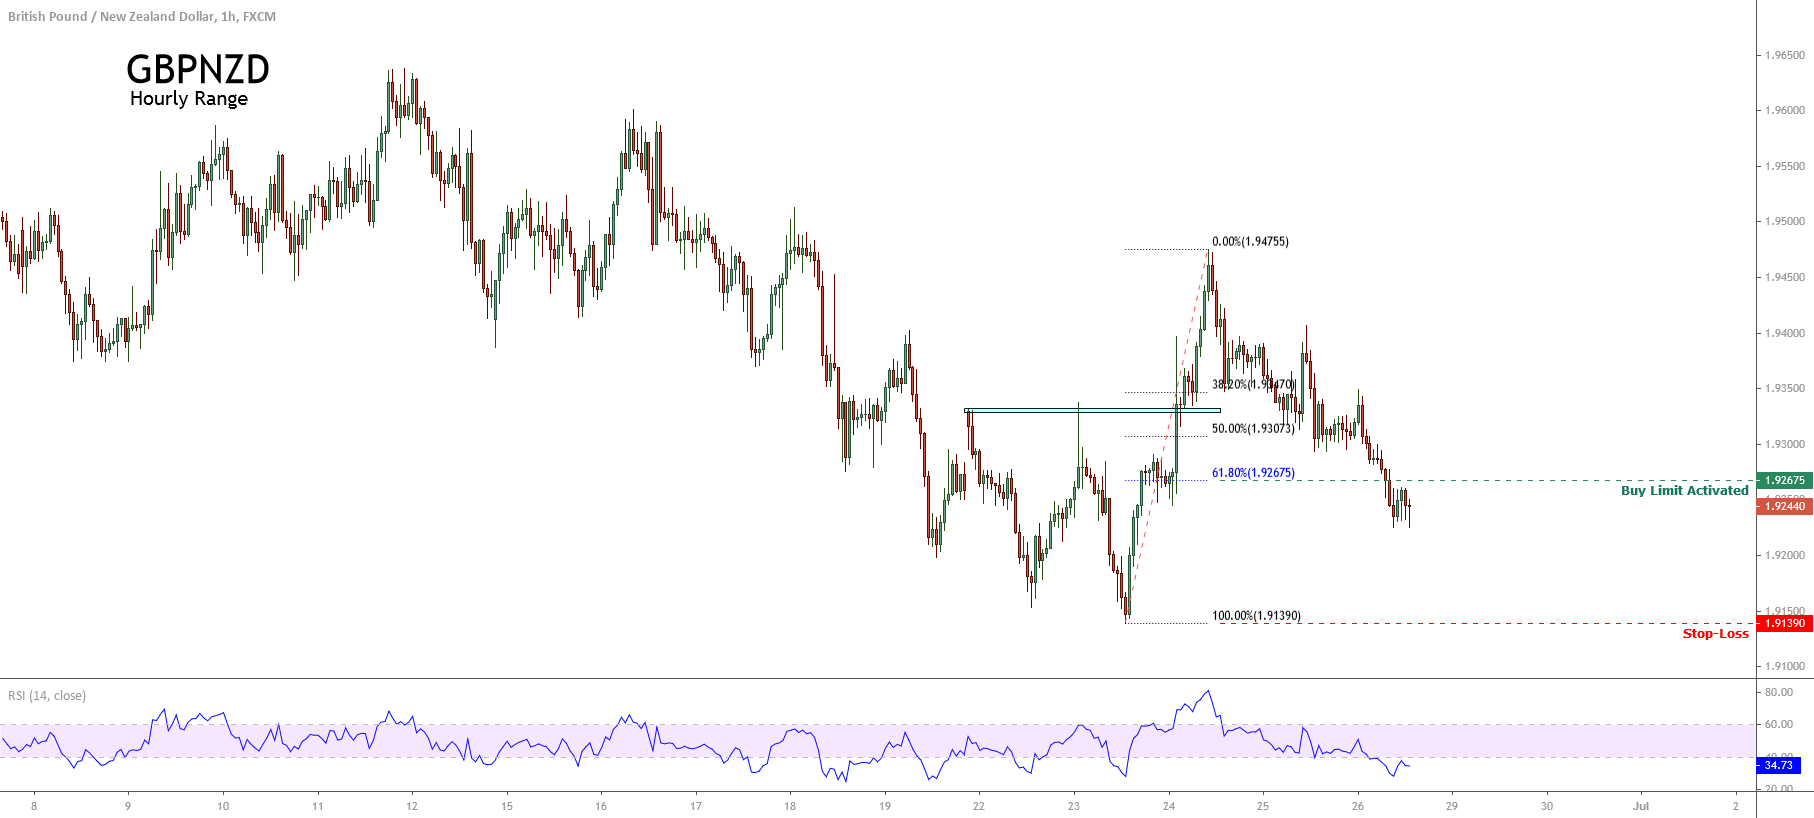
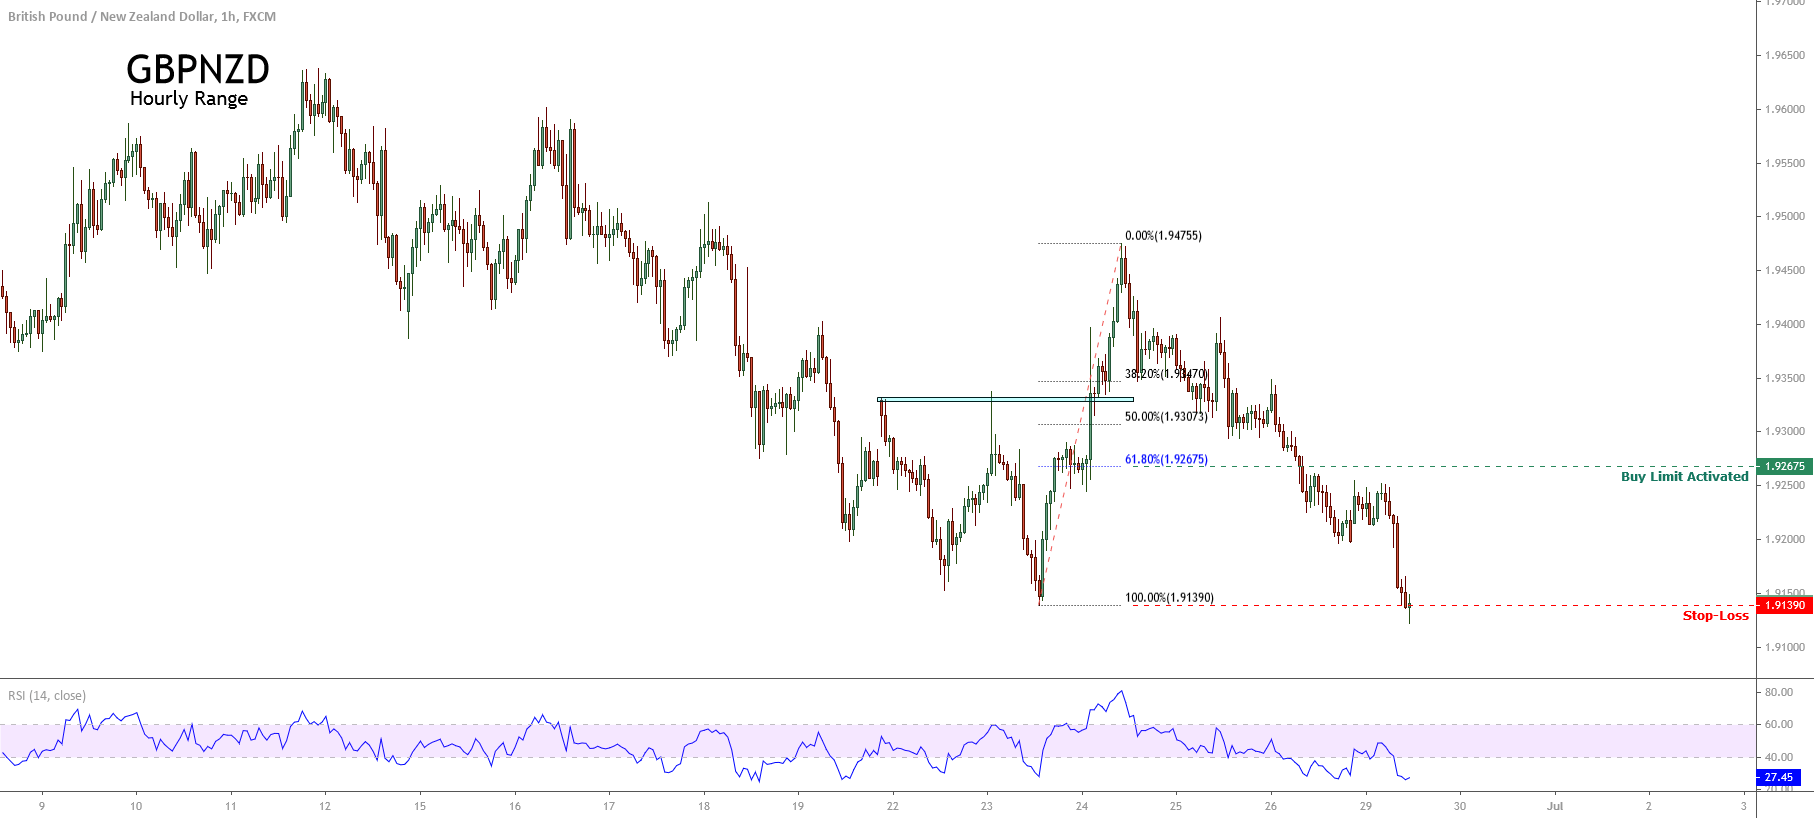
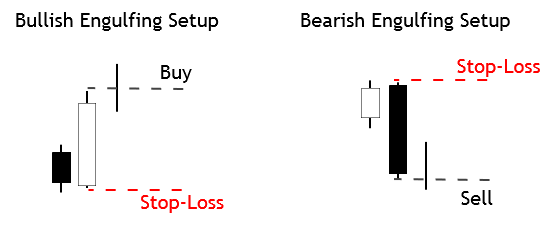
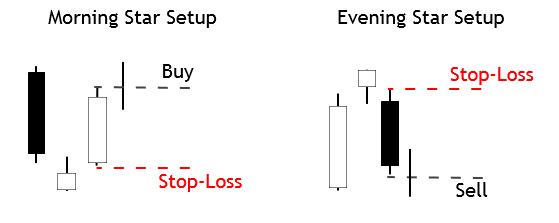
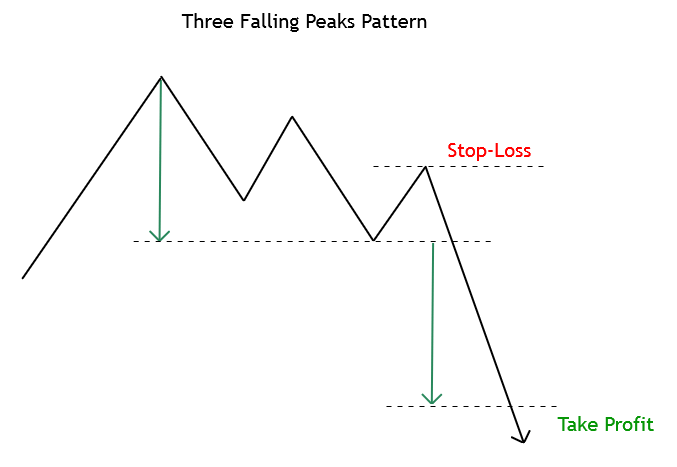
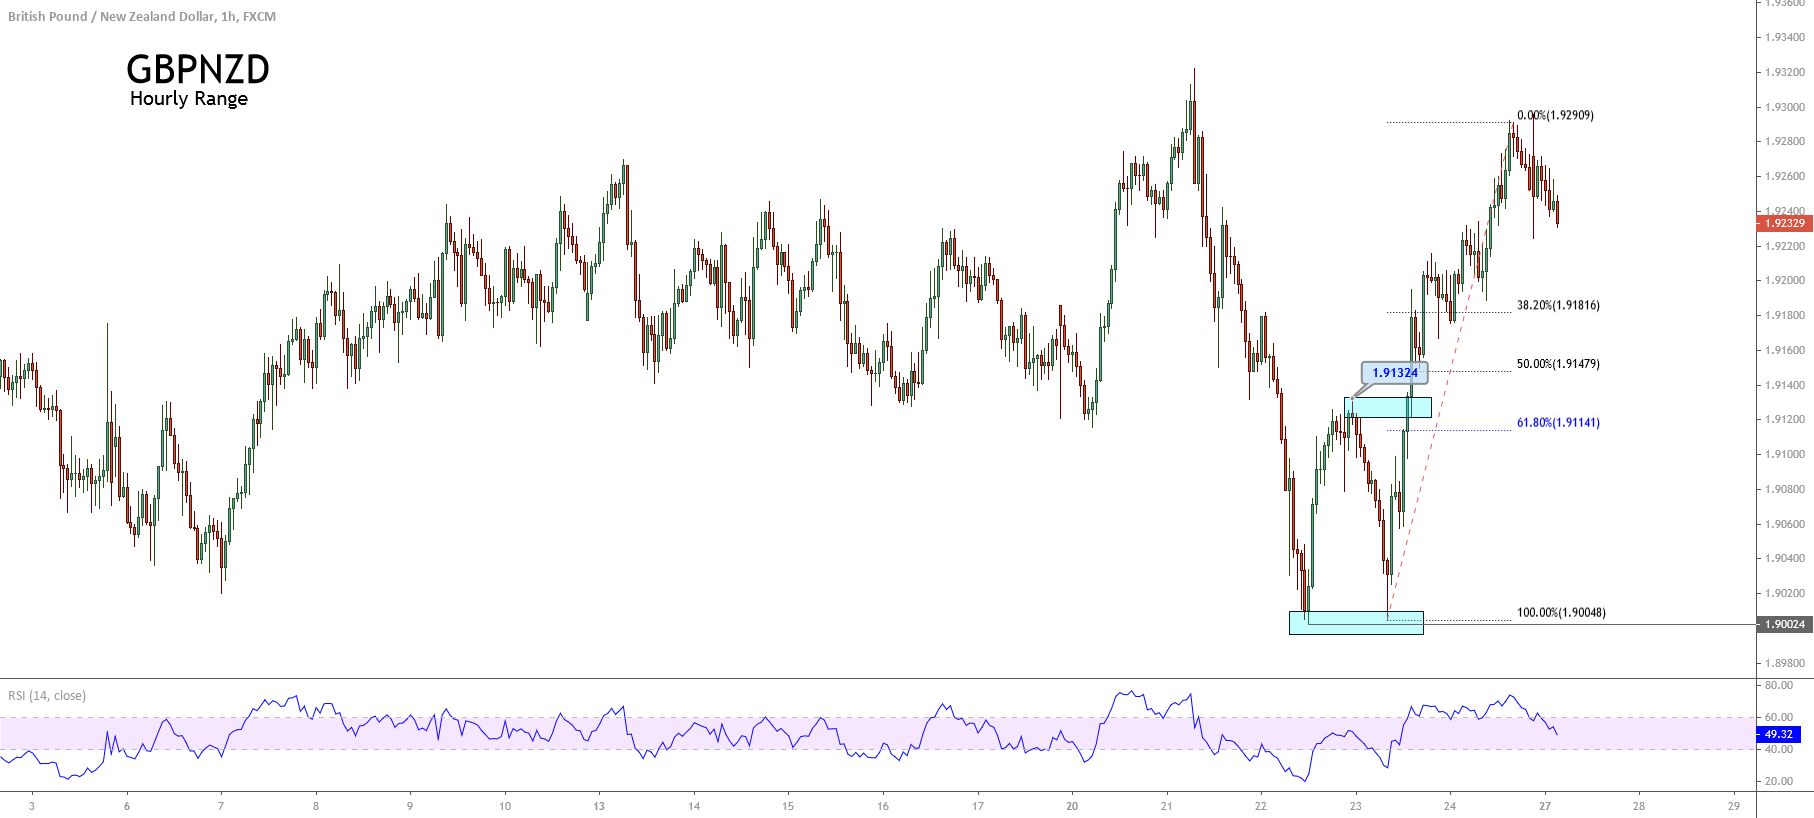
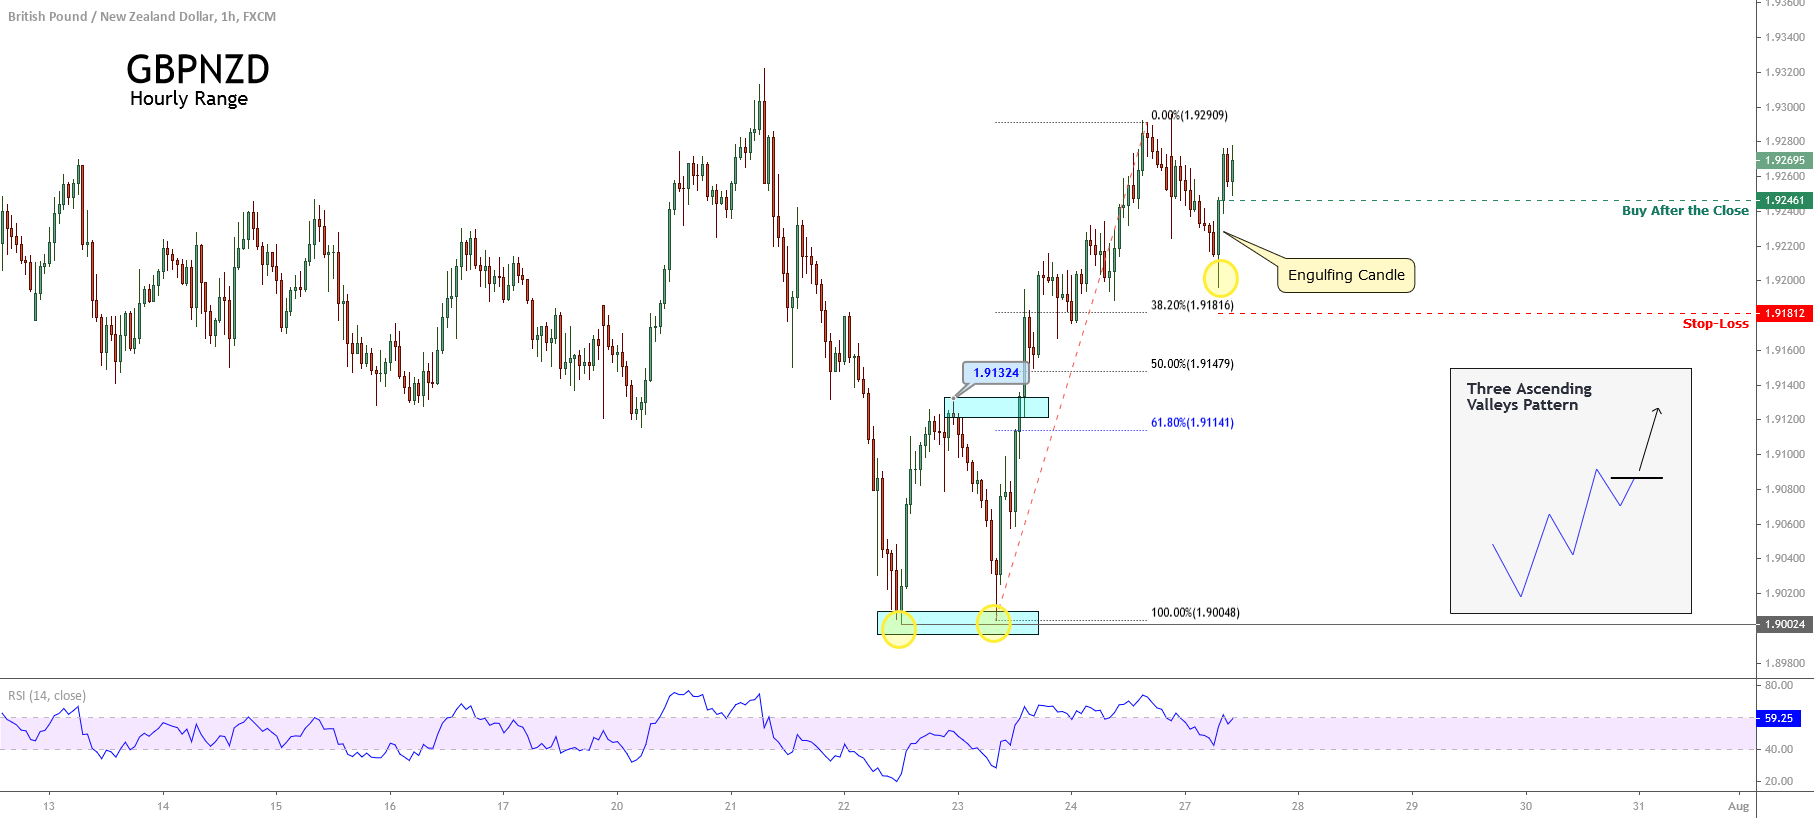

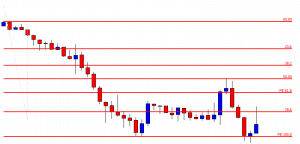
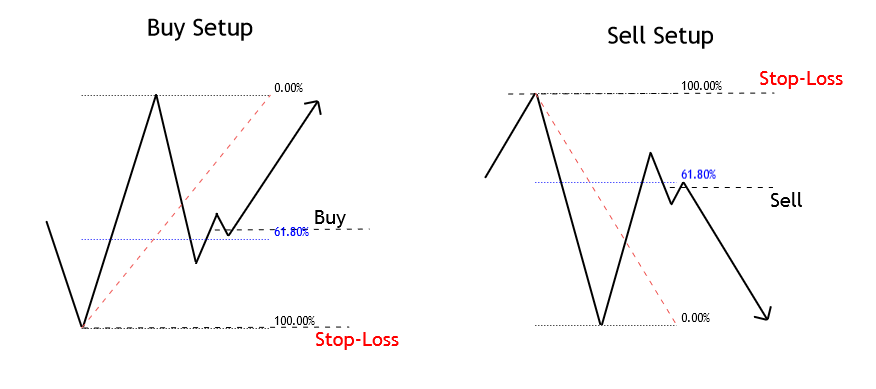
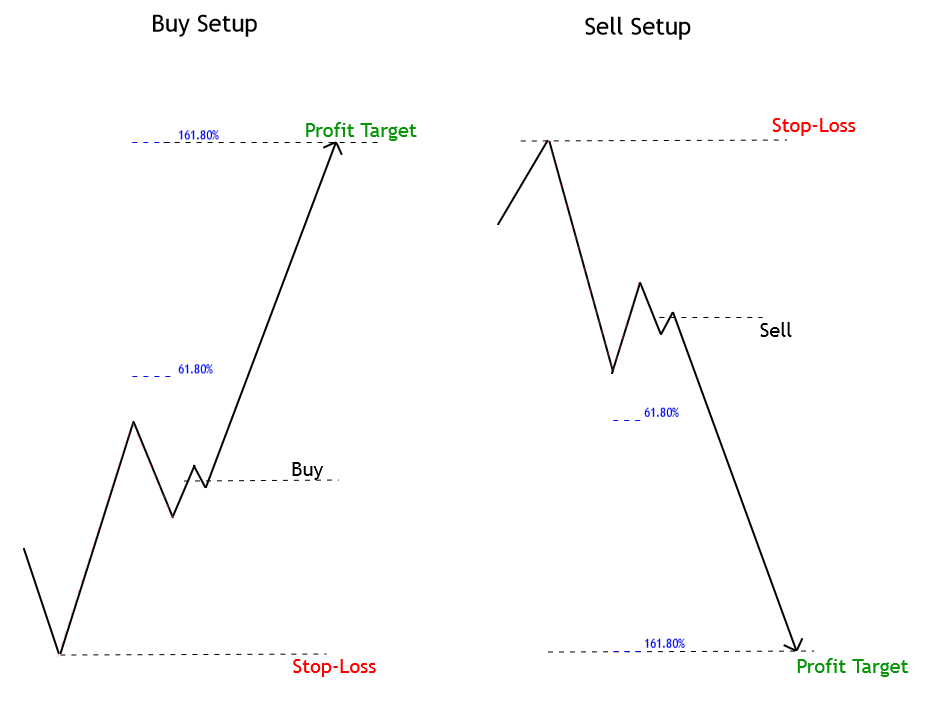
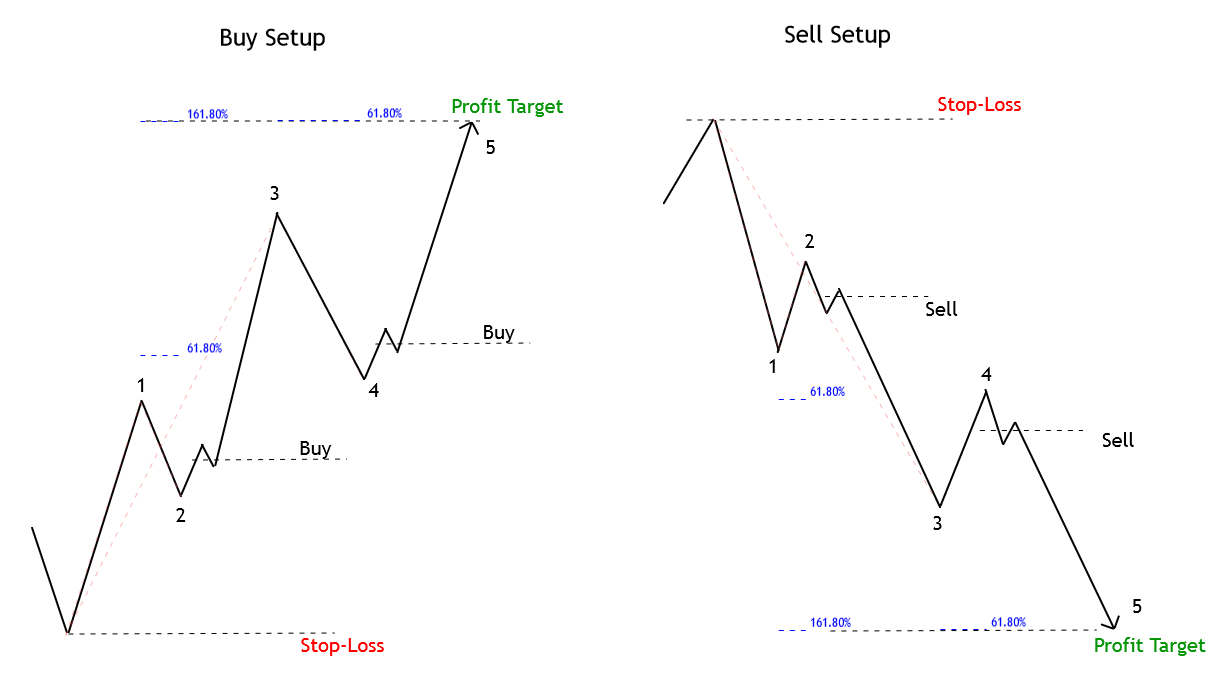
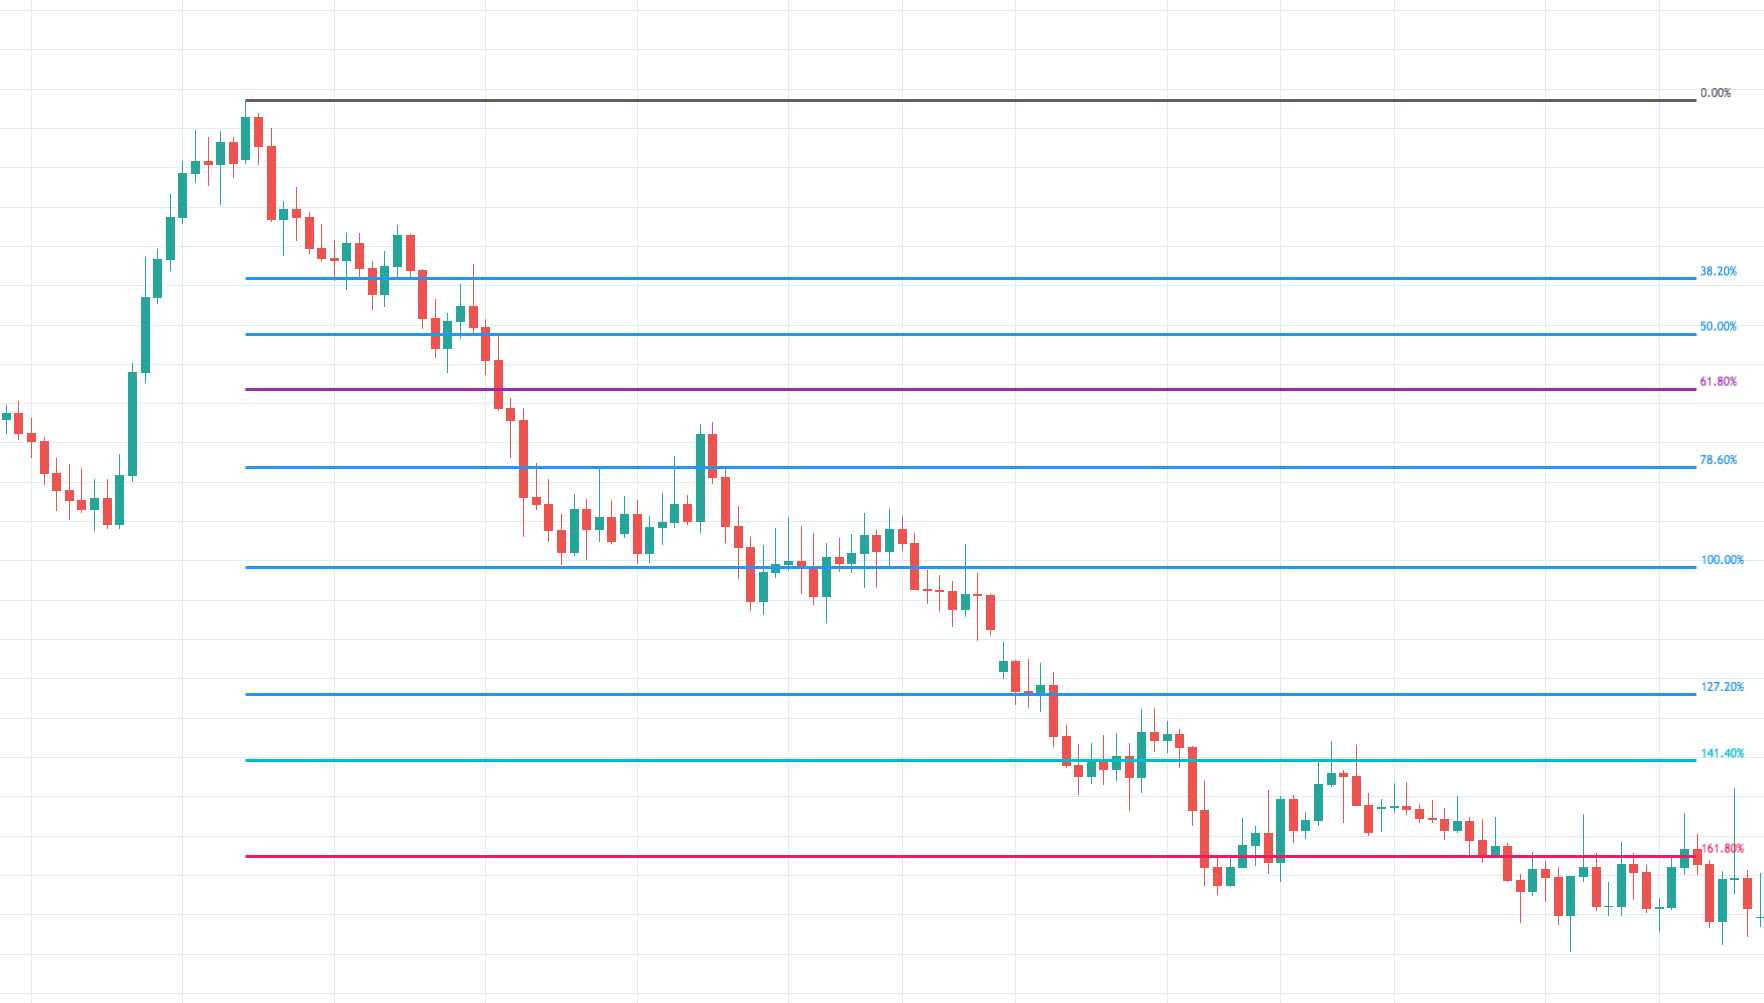
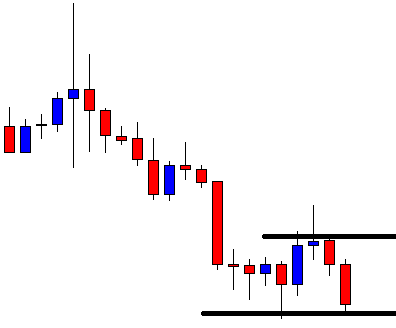
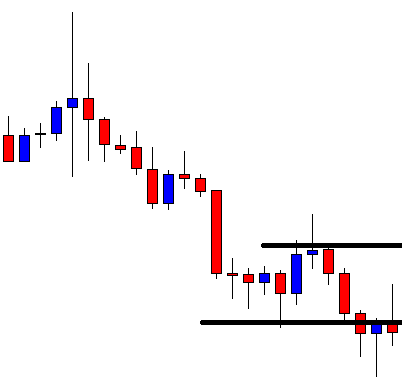
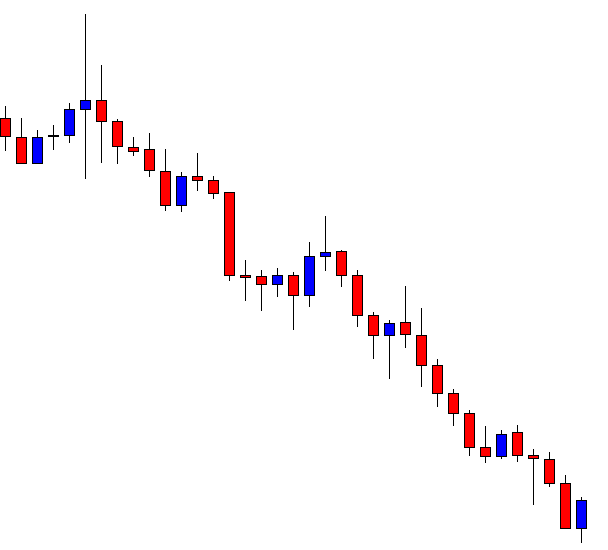
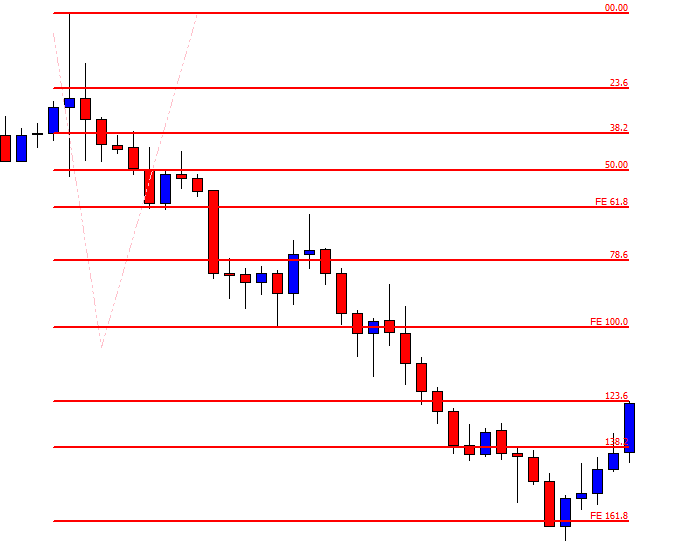

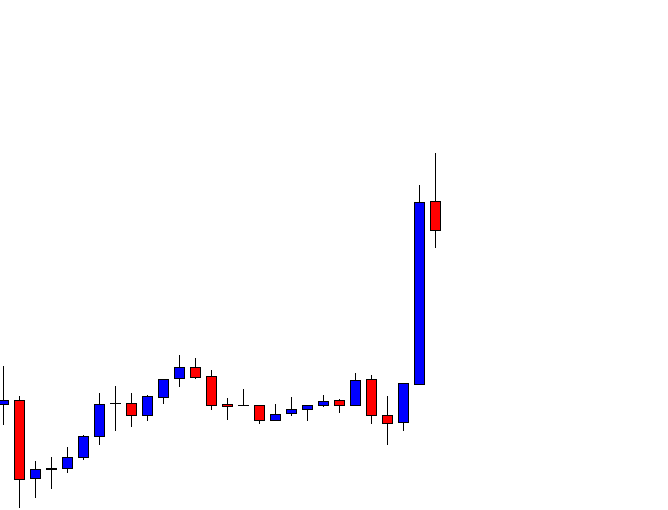
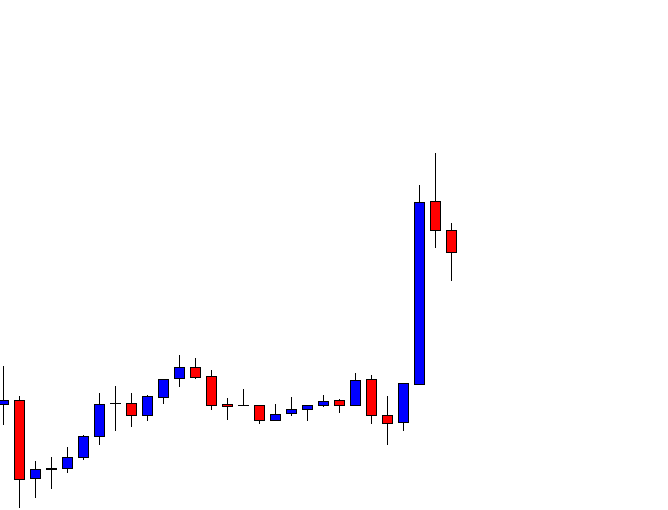

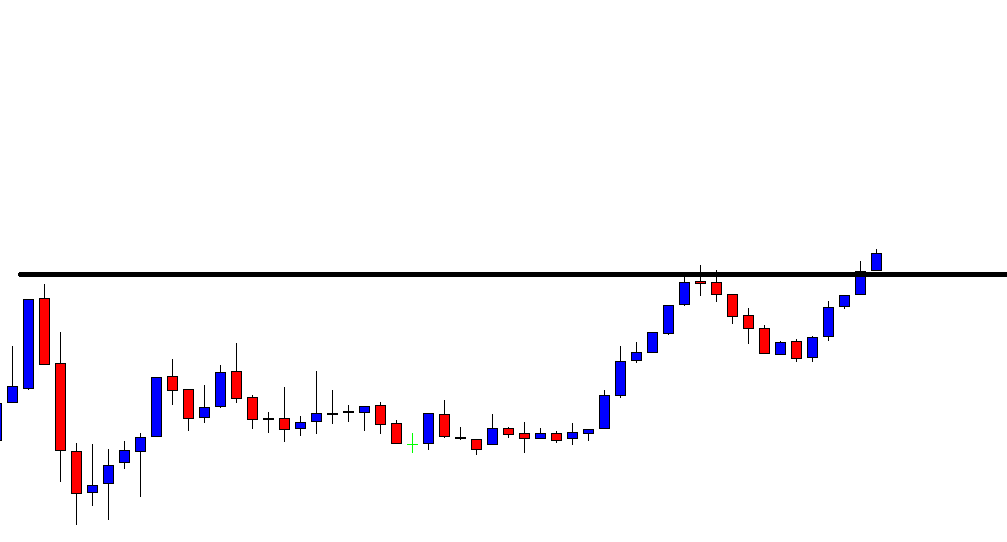
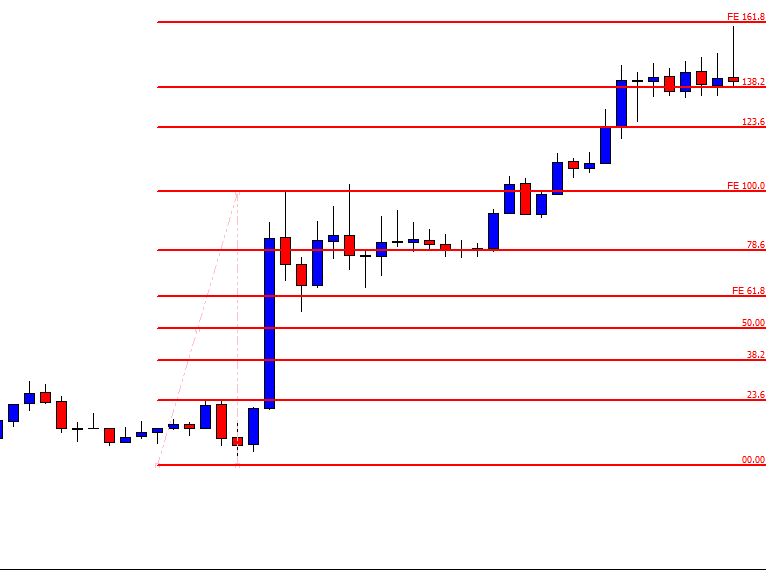
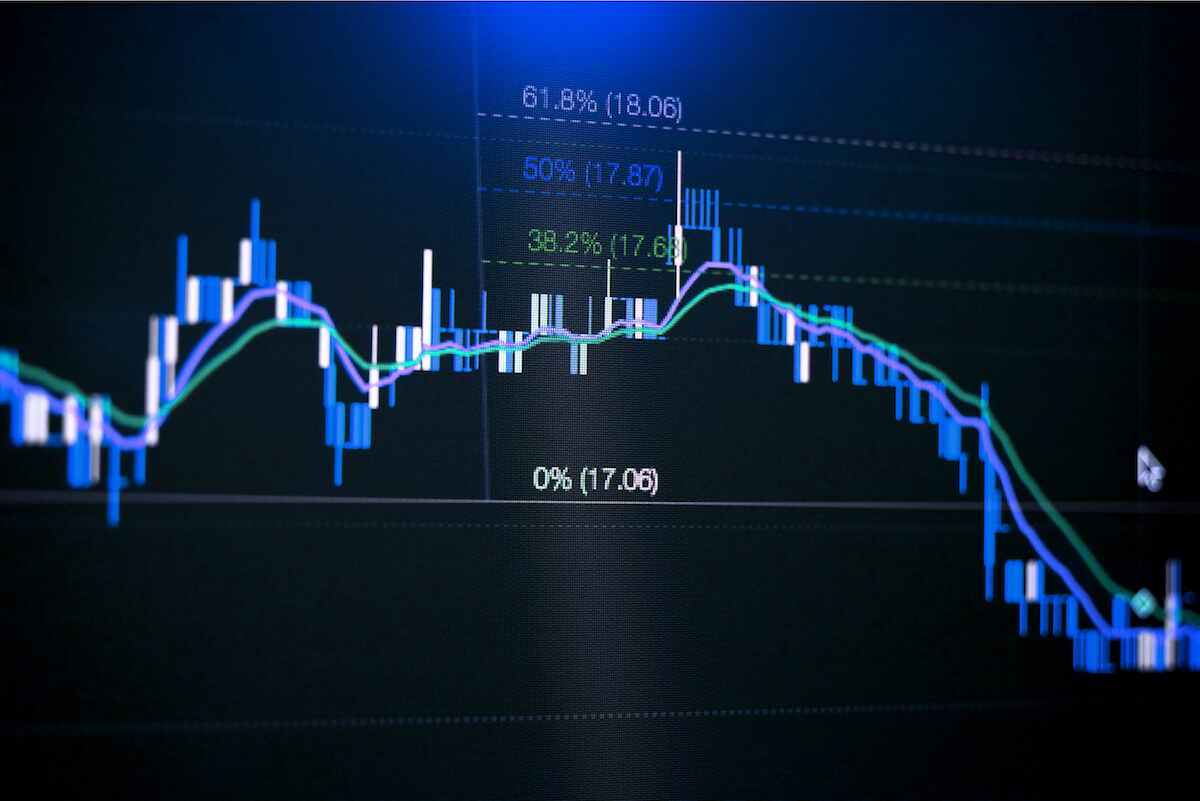
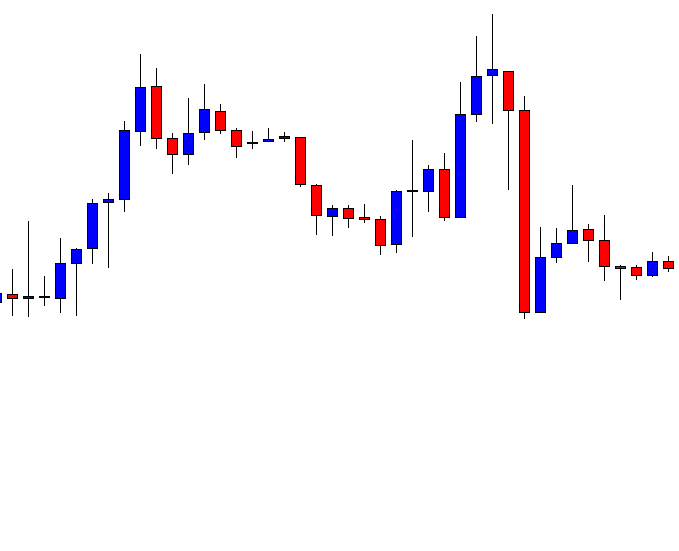
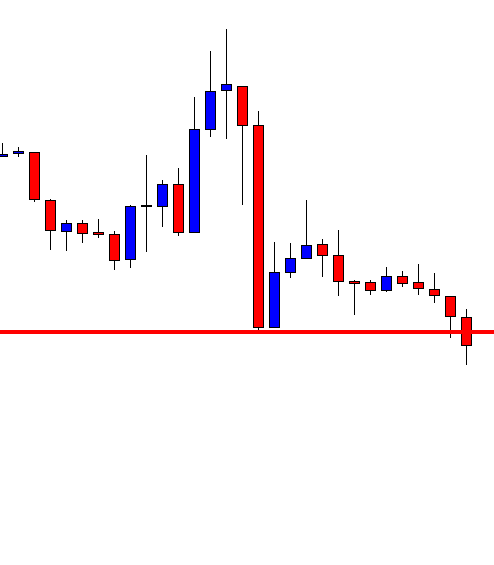
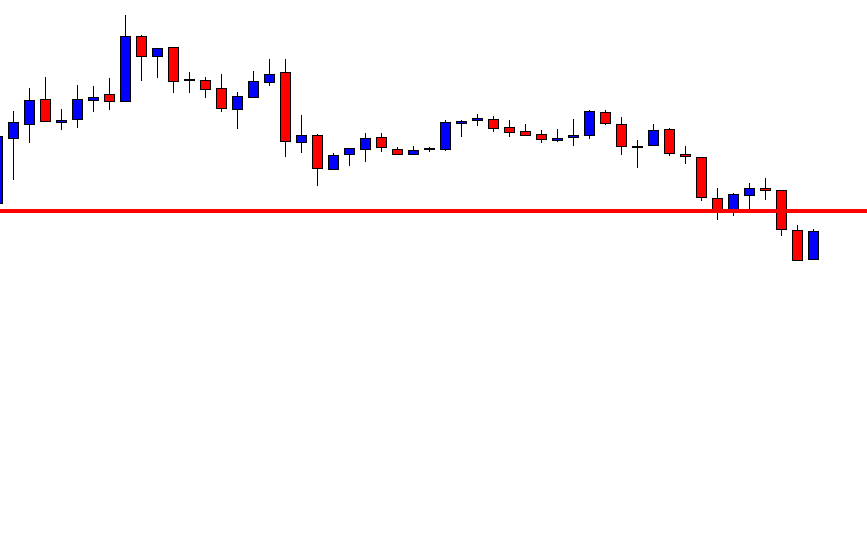
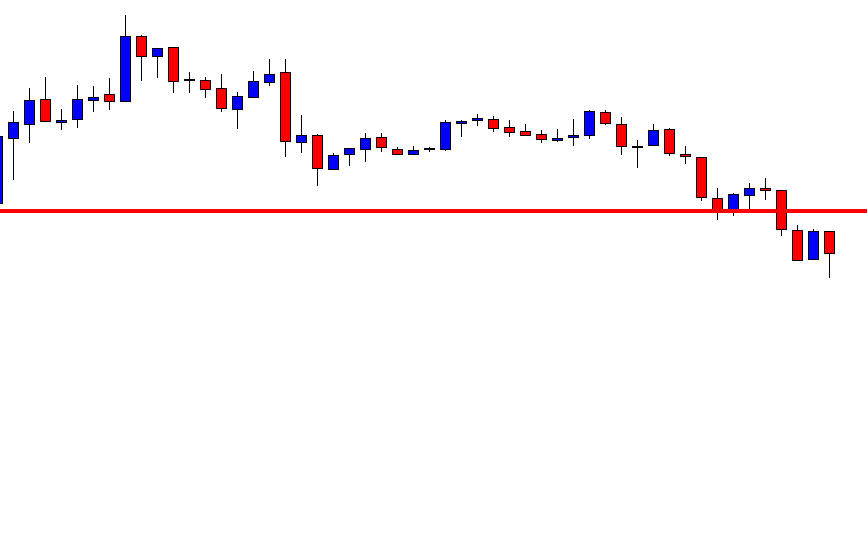
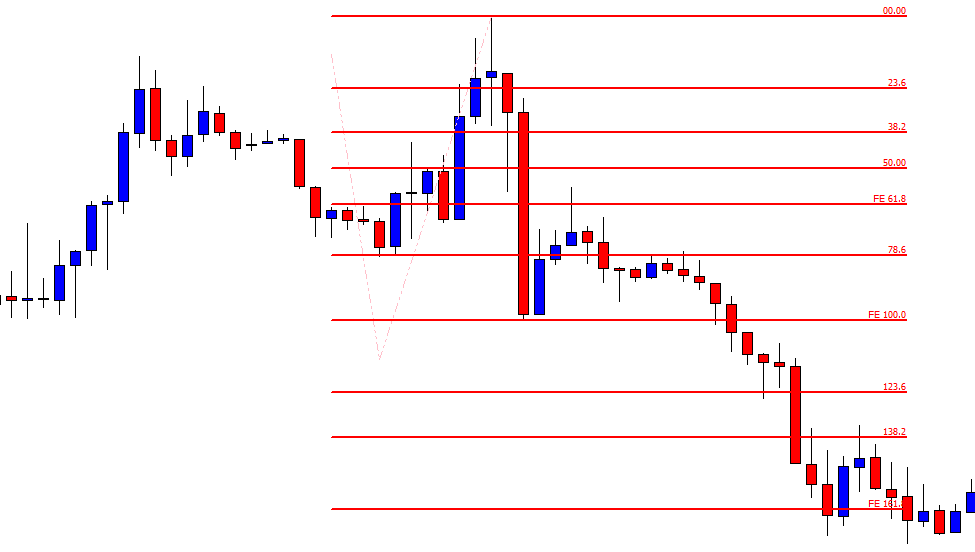
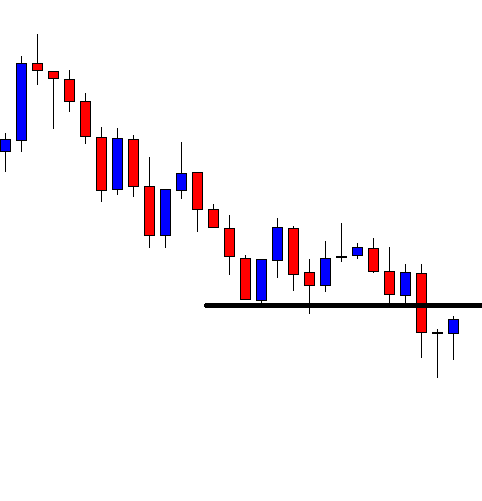
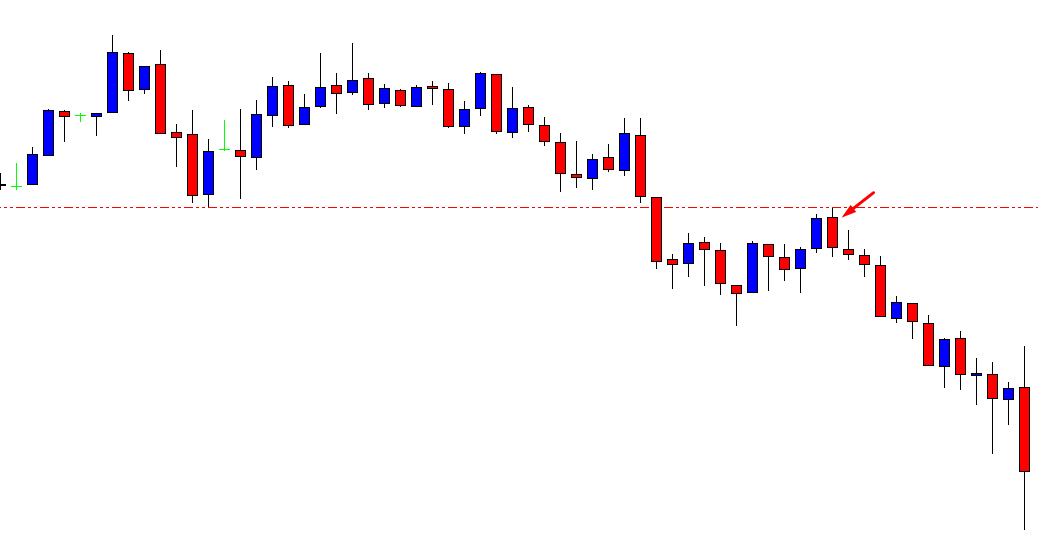
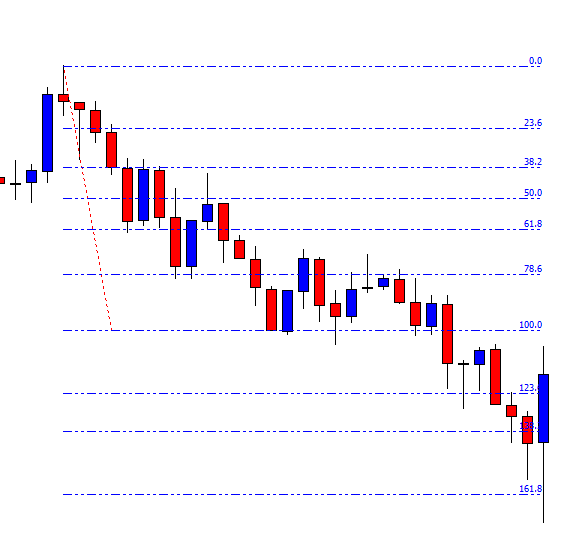

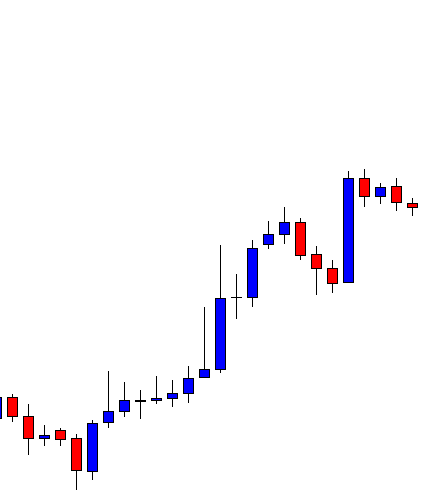
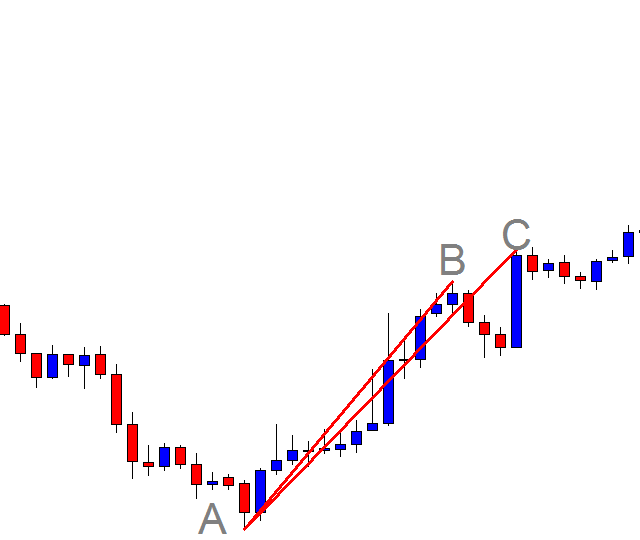

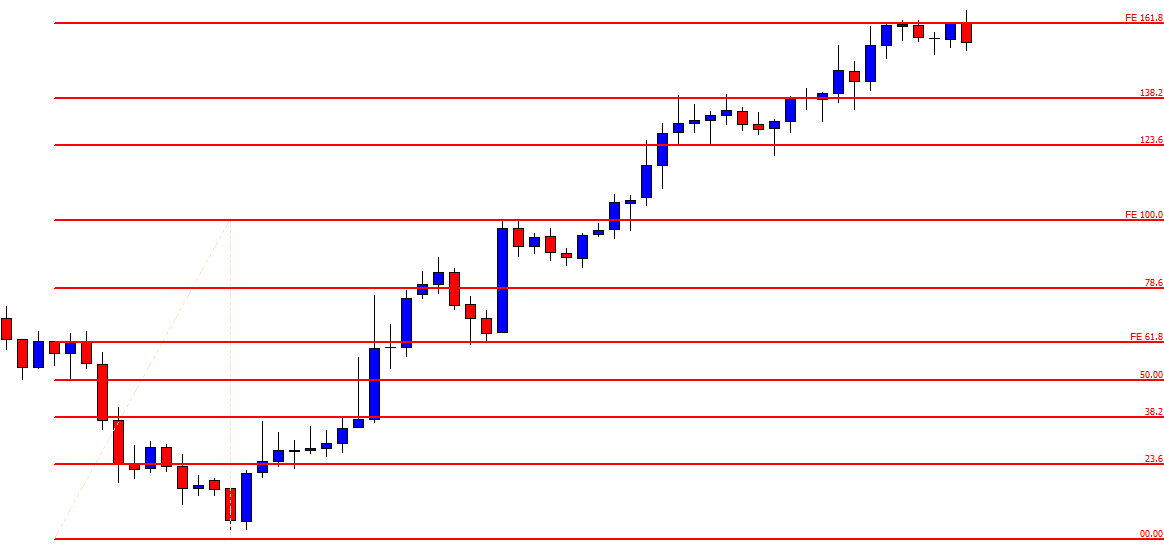
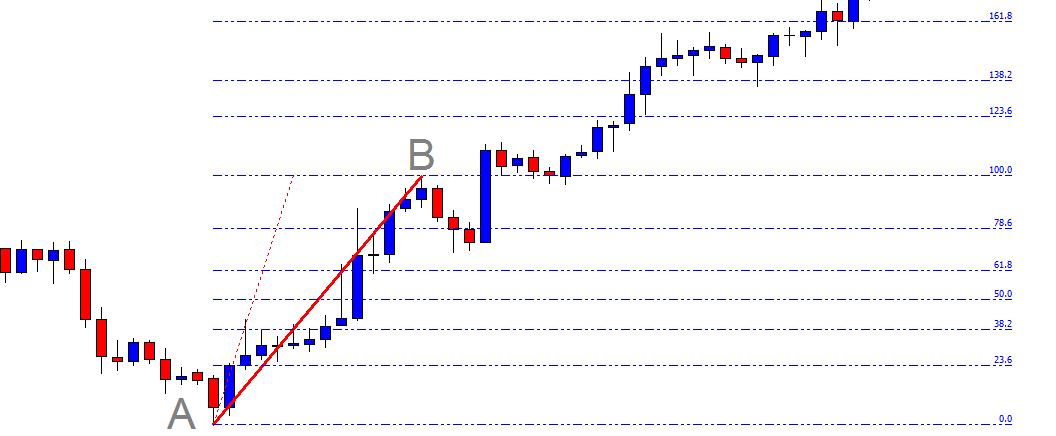
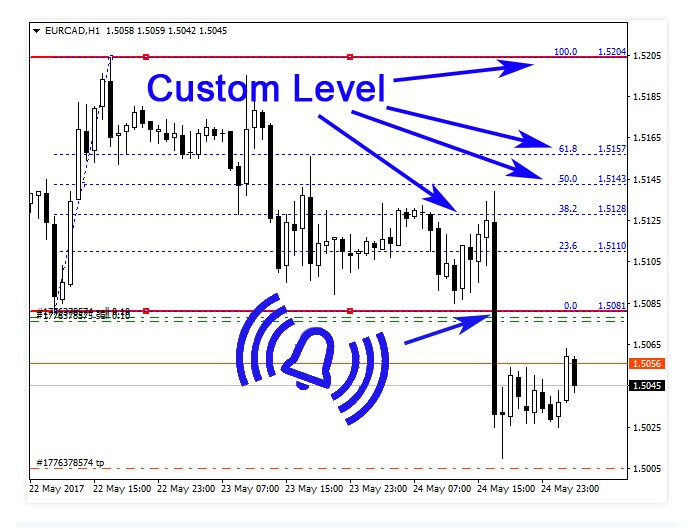
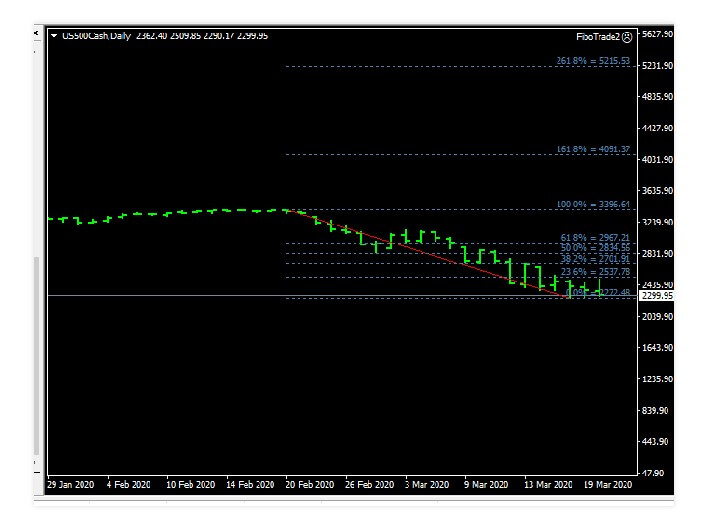
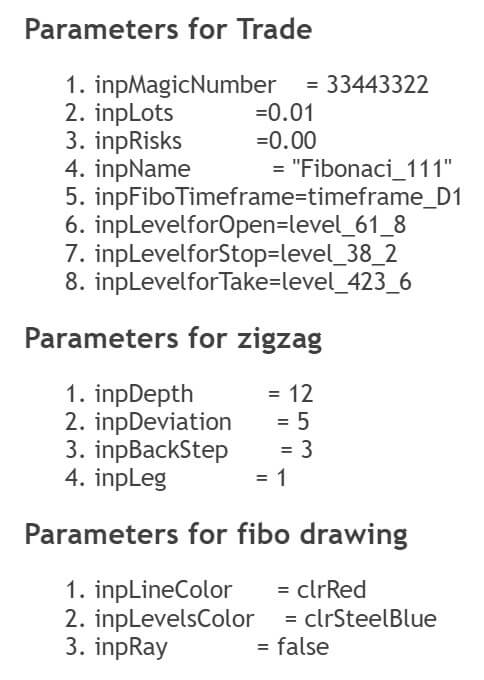

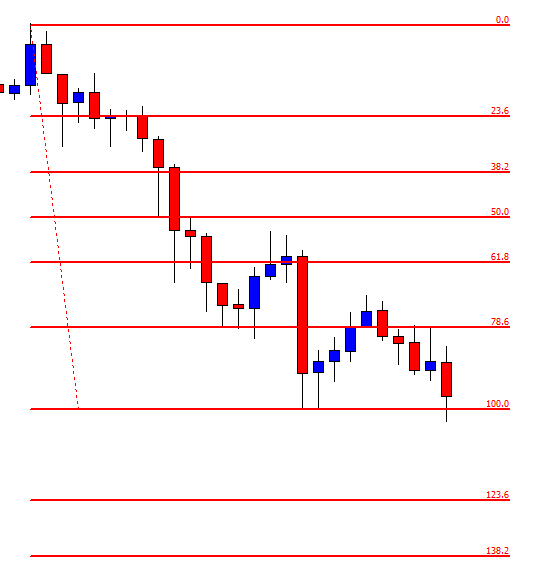
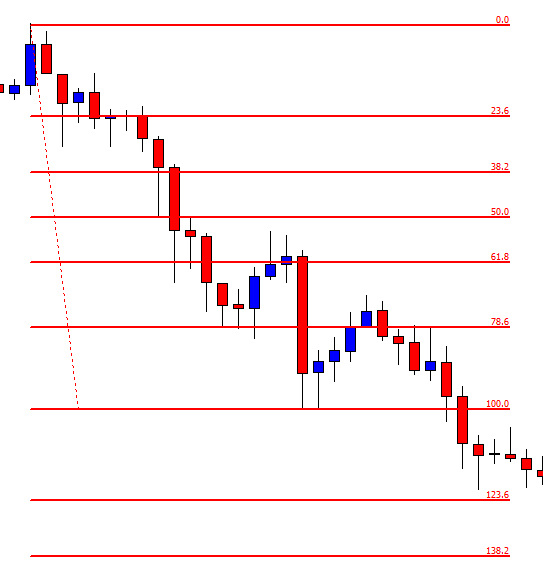
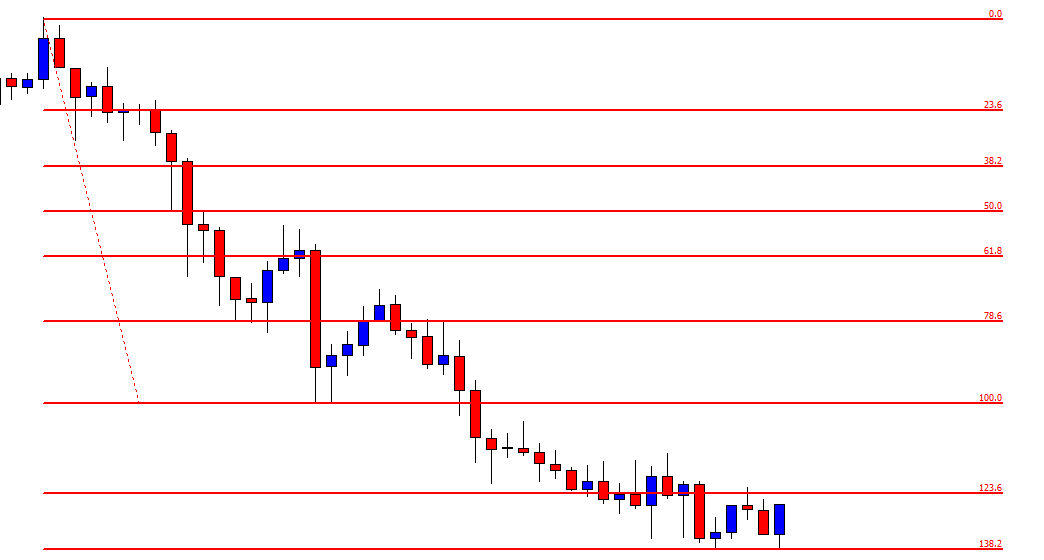

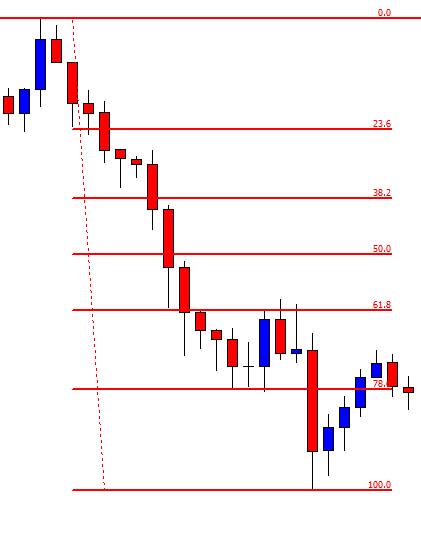
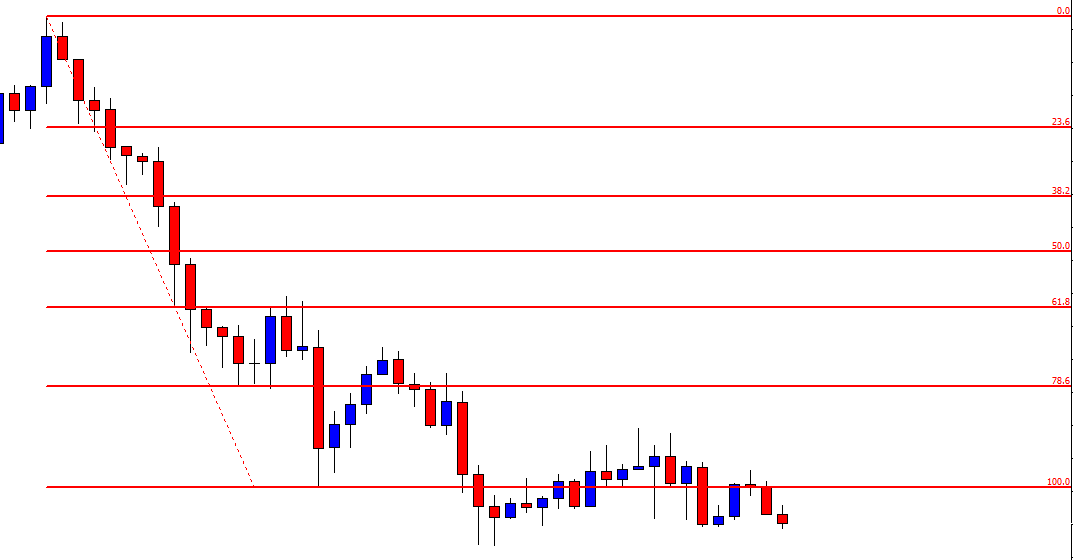


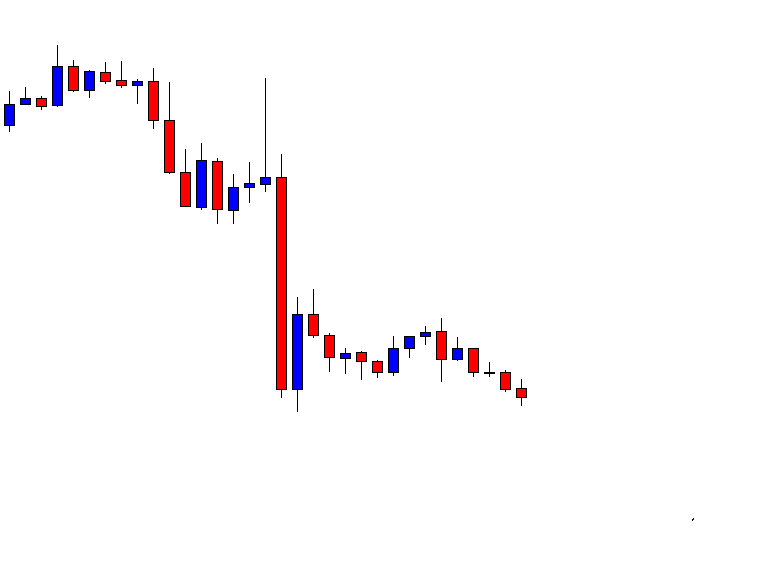
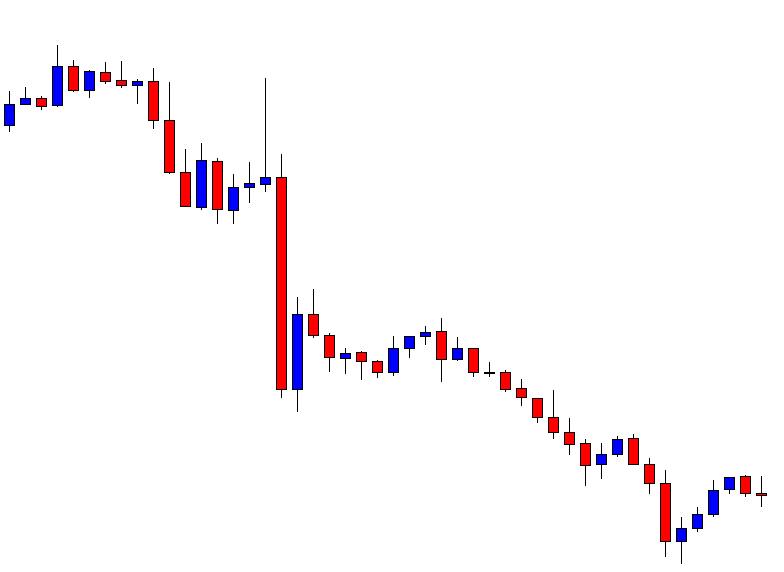
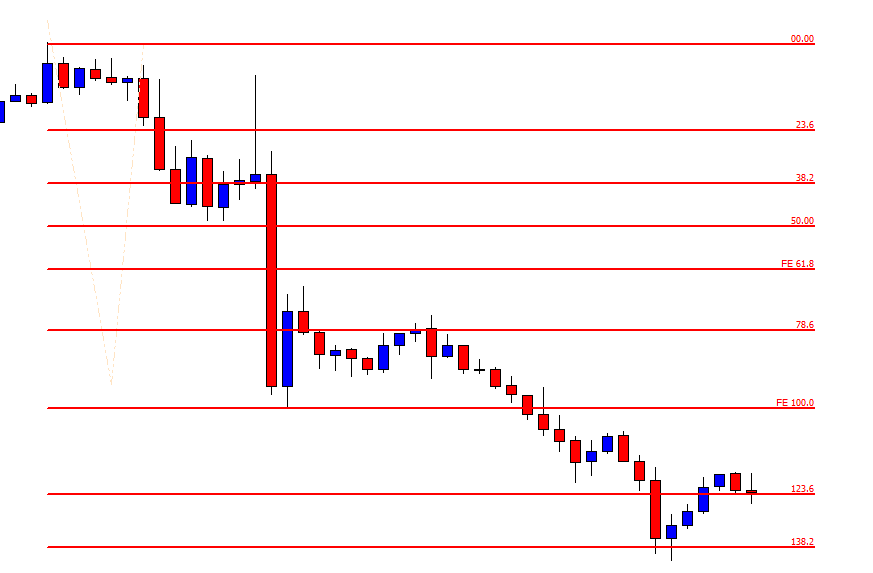
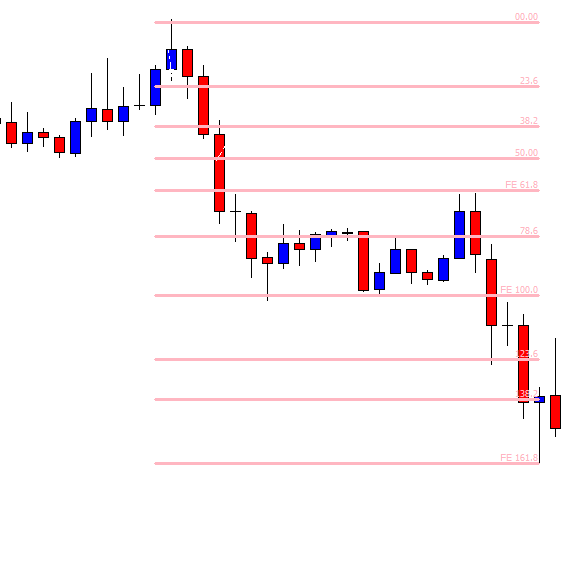

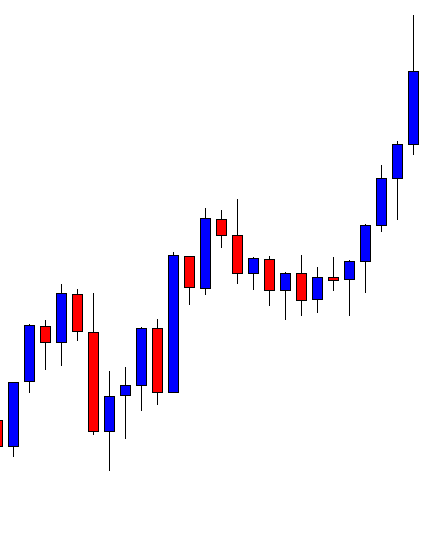
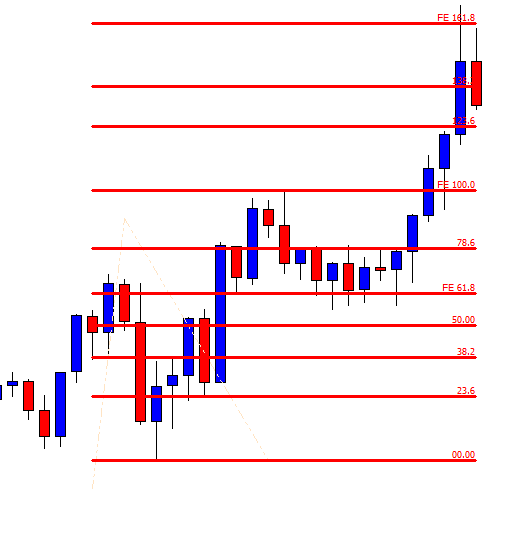
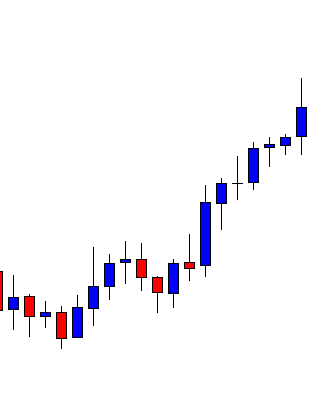
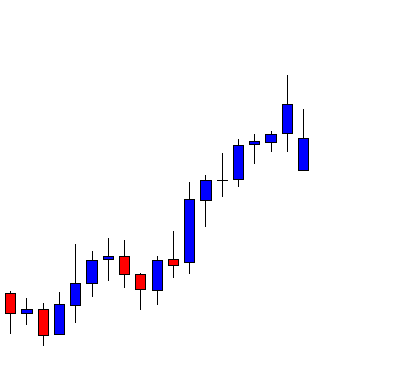
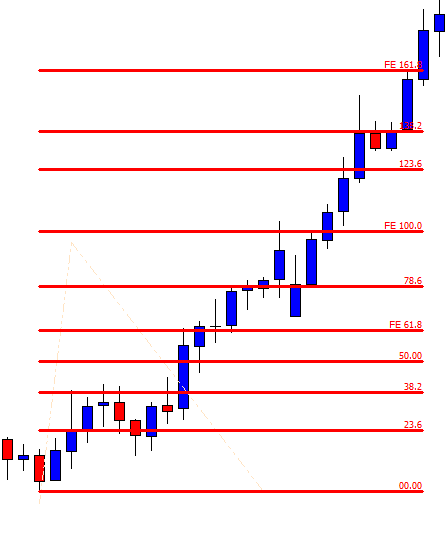

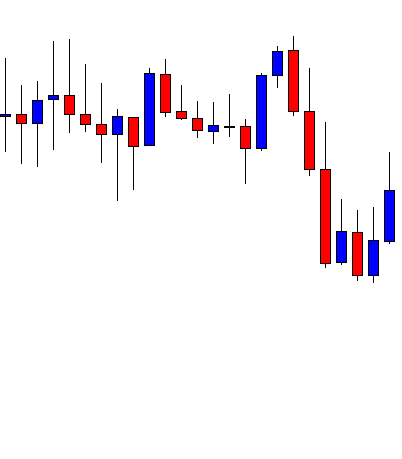
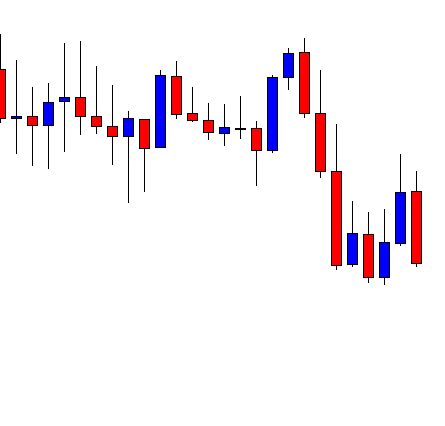
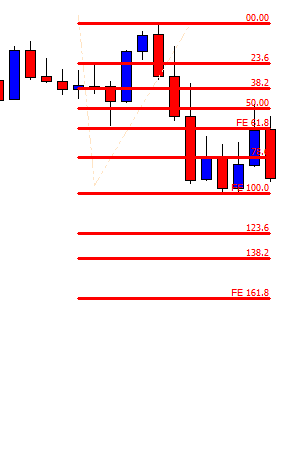
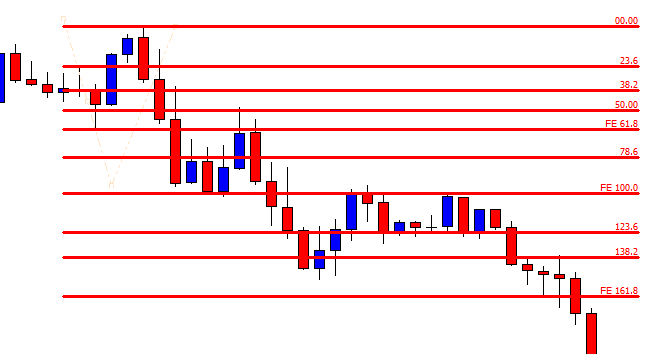
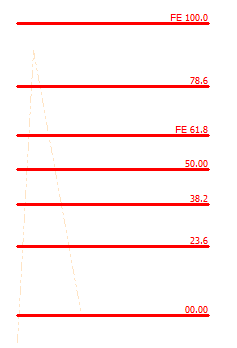
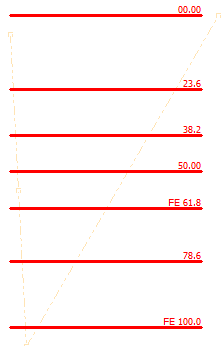

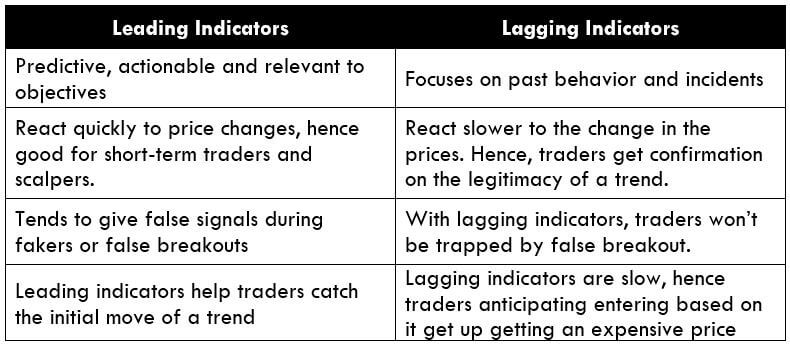


 An interesting proposal within Bonacci’s book was based on an observation of how the population of rabbits grew in ideal conditions. The solution to the rabbit problem was found within a mathematical sequence, which we now know as Fibonacci numbers.