Introduction
In previous educational articles, we presented a wide variety of trading setups that tell us what market to trade, the trade’s invalidation level, and where we will take profits. However, the question that arises is how we can improve its performance?

Considering that price action produces a vast quantity of false signals, how we could enhance the entry timing toward the market? This educational article will review how the integration of Fibonacci tools with chart patterns and candle formations could improve the trading strategy.
The Fibonacci Level 61.8% Problem
In a previous article, we discussed using the 61.8% Fibonacci as a criterion to set the market entry. However, considering that the price momentum does not always retrace until 61.8, and with this situation, the technical trader could not catch potential trades, “leaving money on the table.
On the other hand, there exist two Fibonacci ratios that tend to be used by traders; these ratios are 38.2% and 50%. However, the use of those ratios as potential entry levels could reduce the risk to reward ratio.
The following figure illustrates the GBPUSD pair in its 4-hour chart, from where, we distinguished that once the price competed for each advance, the retracement developed in three of our five observations the Cable retraced until 61.8%. In the other two cases, the price didn’t surpass 50% of the previous movement.
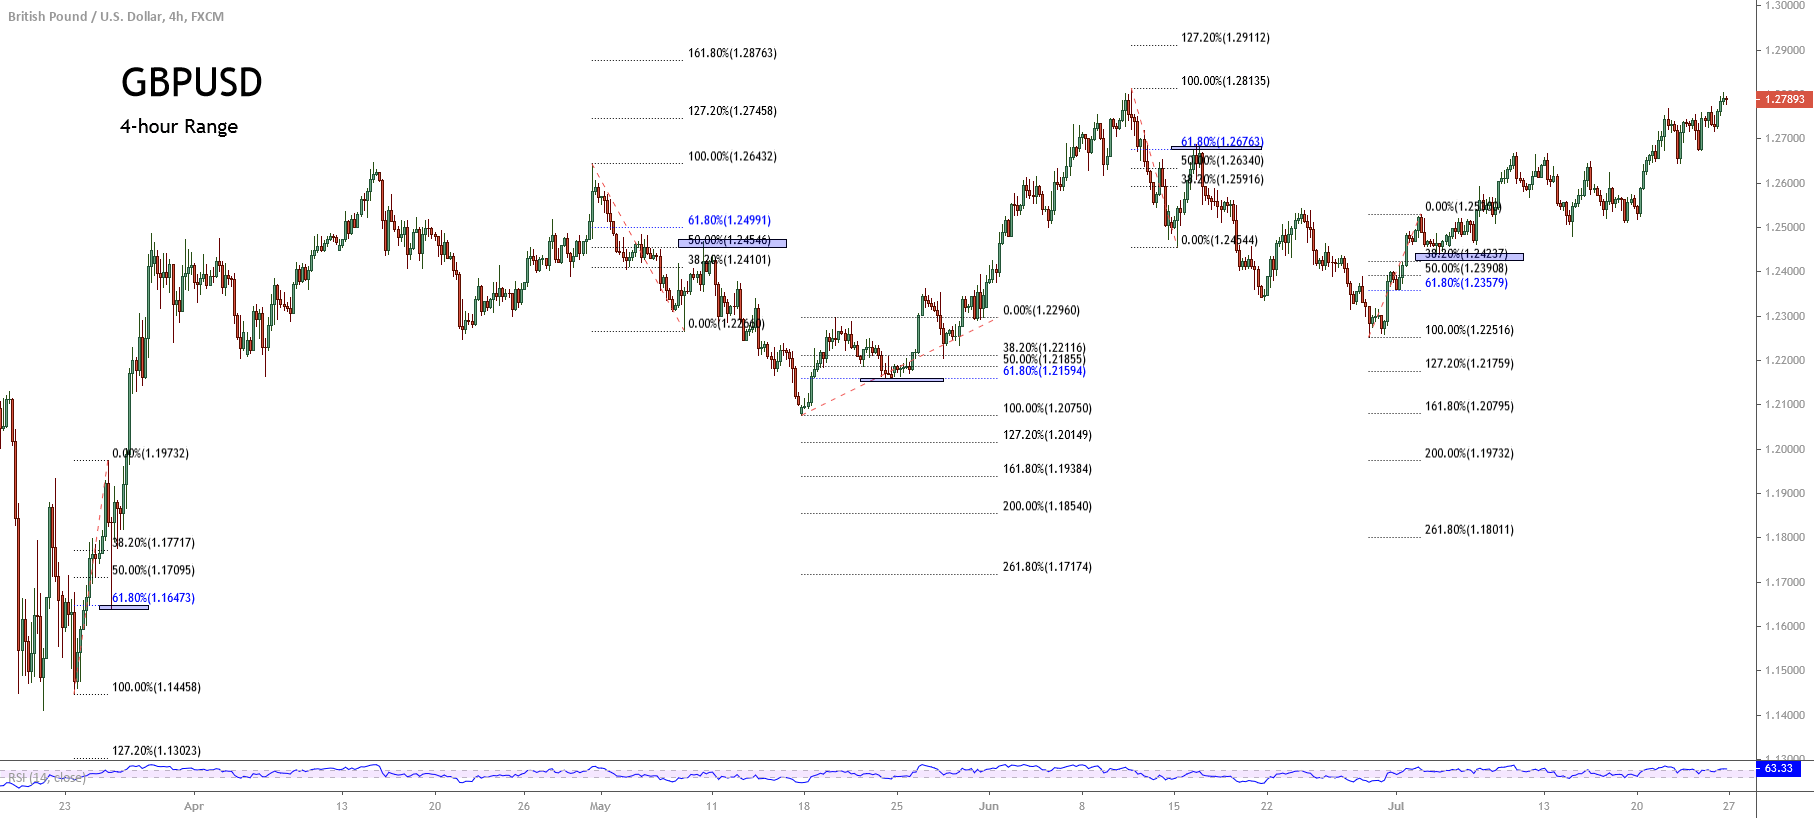
This situation leads us to observe that the technical trader could miss two opportunities. At the same time, it is essential to consider that the technical trader should practice and backtest the trading strategy before putting in action with real money.
In this context, Fischer and Fischer developed a simulation using this entry maker criterion. The study’s results revealed that seven out of nine trades using the 61.8% of entry criterion resulted in a loss.
Improving the 61.8% Entry Rule
To face the poor performance of the trading strategy based entries after the price reaches the 61.8% level, Fischer and Fischer propose using a filter to reduce the risk of loss. This additional criterion is based on candlestick patterns and three-point formations.
In their work, Fischer and Fischer determined that the incorporation of candlestick patterns and three-point formations as an additional entry criterion allowed reducing the entries and increasing the percentage of winning trades.
Conclusions
In this educational article, we presented how the incorporation of an additional rule in the market entry as the candlestick formation or a three-point pattern can represent a confirmation signal, which at the same time, reduces the possibility of a bad trade.
Although the promising results are obtained by introducing the improvements presented by Fischer and Fischer, the technical trader should practice and evaluate the accuracy of these criteria before jumping into the market.
Finally, traders must remember that there is no trading strategy without losses. In this regard, it is critical to use a stop-loss to manage the risk.
Suggested Readings
- Fischer, R., Fischer J.; Candlesticks, Fibonacci, and Chart Patterns Trading Tools; John Wiley & Sons; 1st Edition (2003).