Introduction
In our latest educational article, we discussed how a trading strategy based on a unique criterion as the 61.8% level of the Fibonacci retracement could increase the strategy’s risk.

In this article, we will extend and propose alternatives that could help the technical trader improve its strategy performance.
Recognizing the Risk of the 61.8% Level as a Unique Criterion
In his work, Fischer and Fischer discovered excessive risk, obtaining significative losses in a trading strategy based on a unique entry-criterion. Fischer and Fischer defined the 61.8% level of the Fibonacci retracement as the right level to place an order. When the price retraces and touches the 61.8%, an entry order is activated. The stop loss of this entry setup should be located below the recent low.
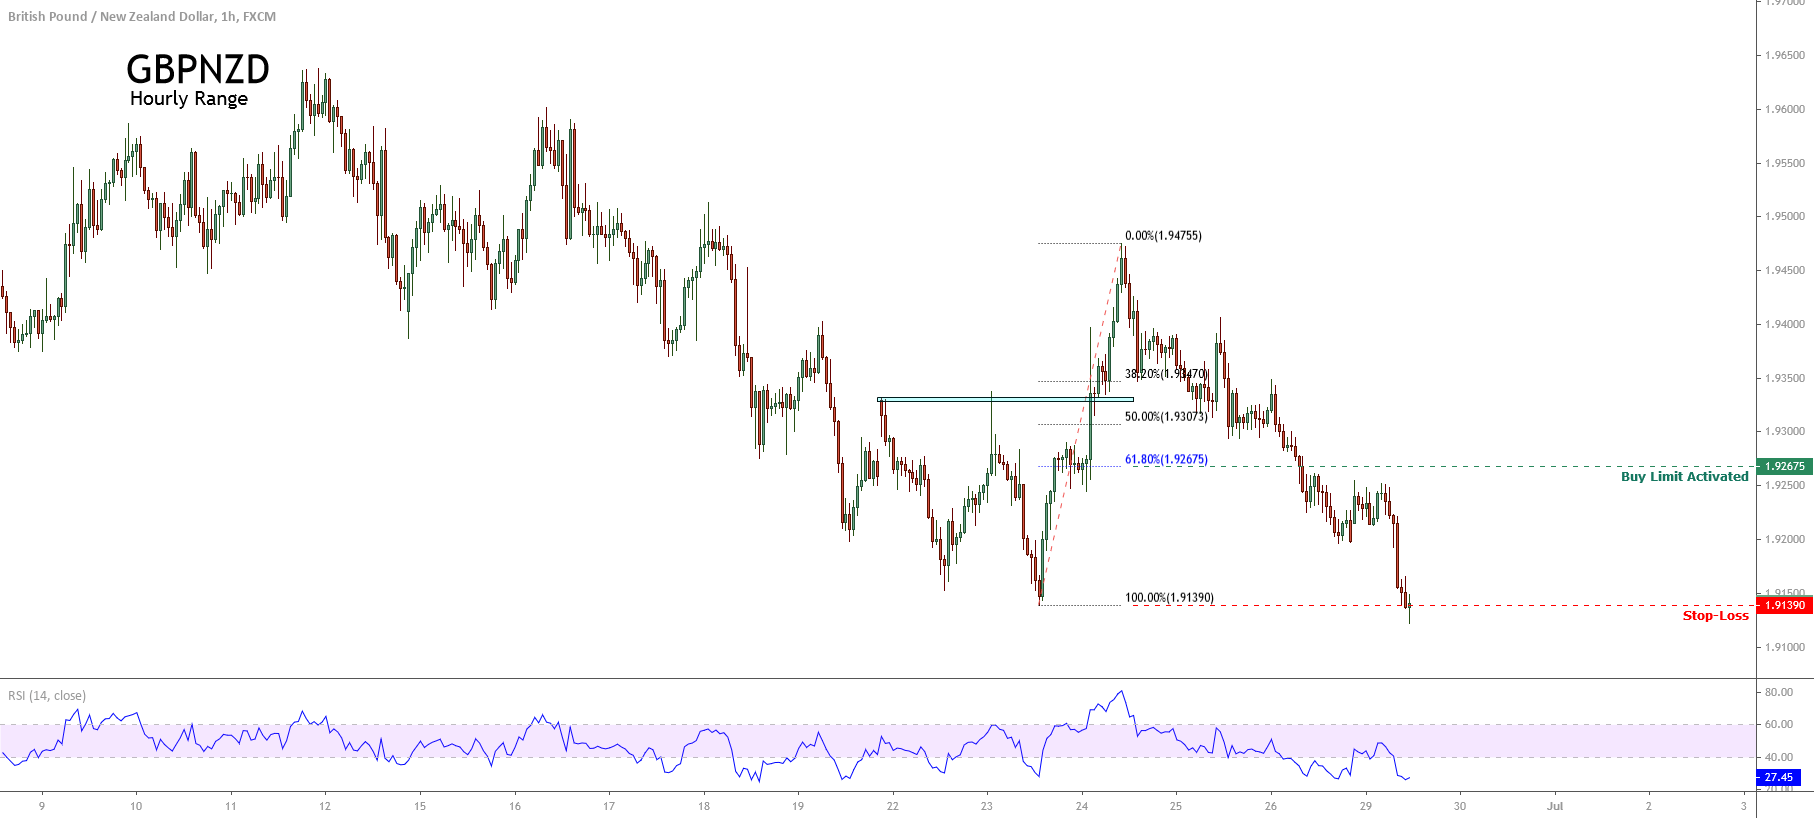
To illustrate this entry setup, consider the following chart exposing the GBPNZD cross in its hourly timeframe.
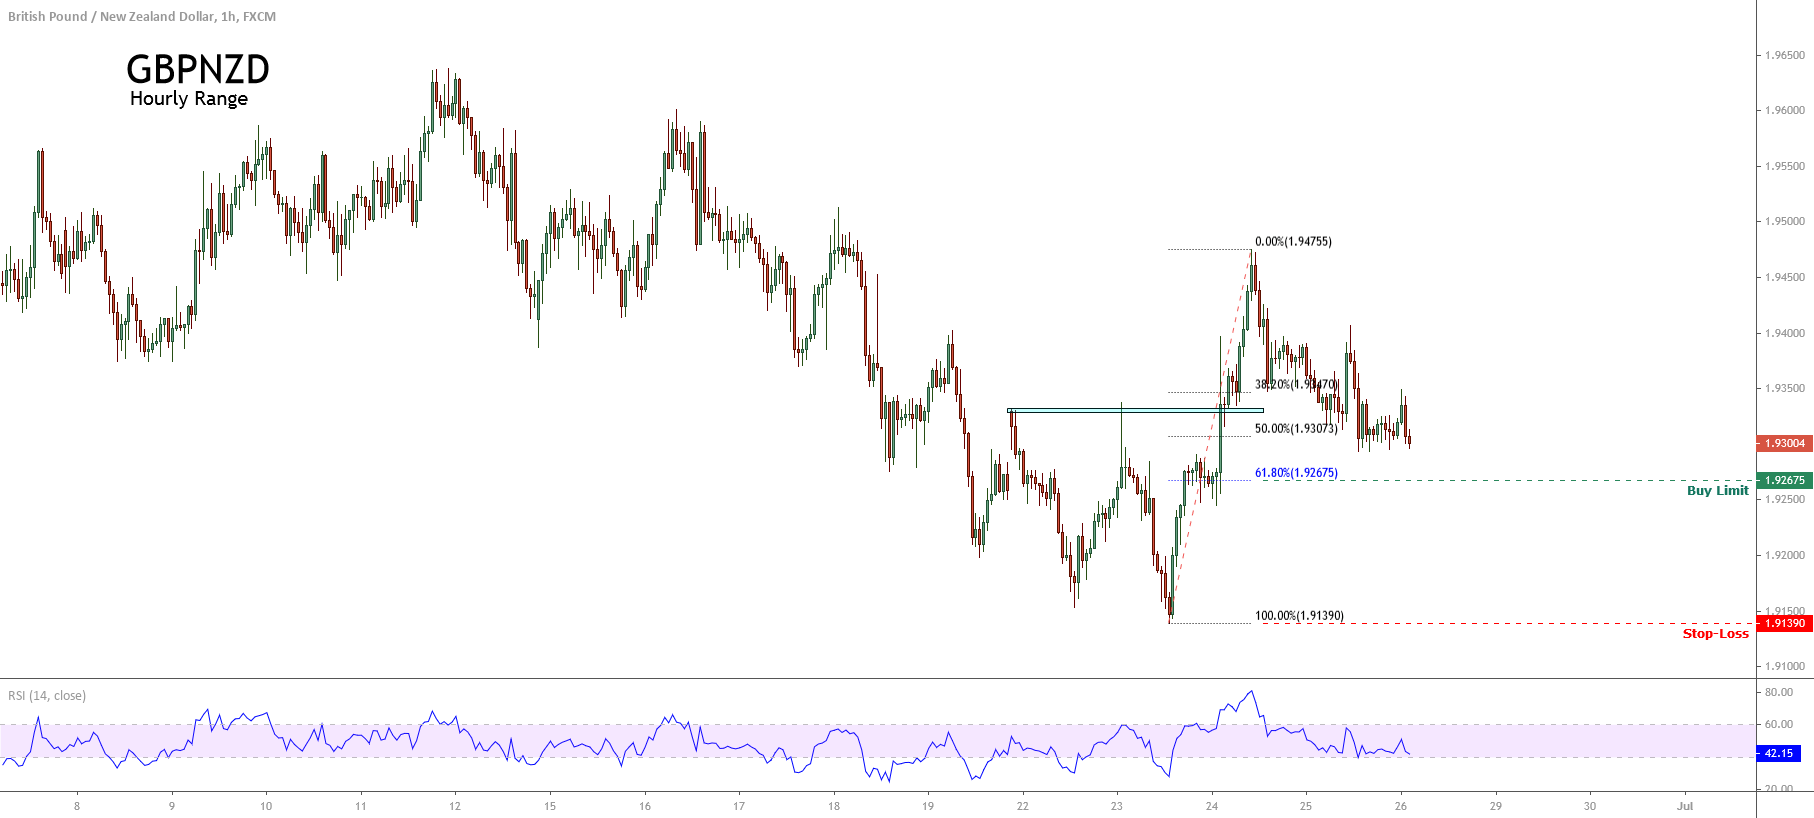
From the figure, we observe the price surpassing the recent previous highs, which could lead us to expect a new rally. Considering the 61.8% criterion, we should place a buy limit order at 1.92675 and the stop-loss at 1.91390. The retracement observed after the impulsive upward movement could lead us to increase our confidence in the pending buy limit order.
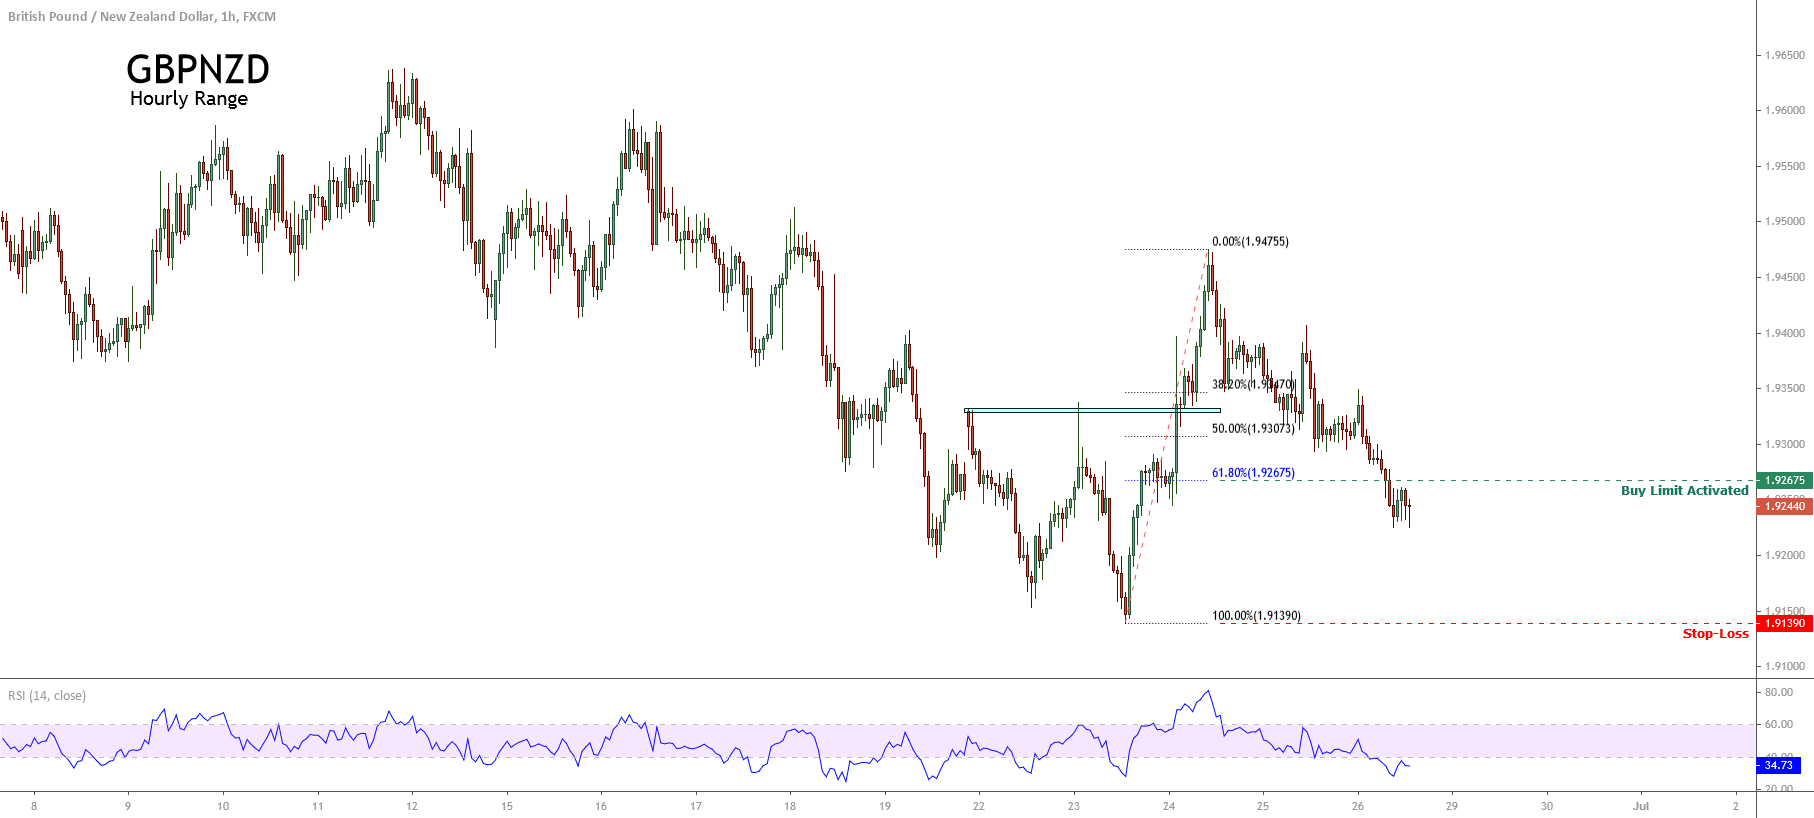
The following figure shows the descending continuation of the GBPNZD cross, which activated the buy limit order. Although the price didn’t bounce from the 61.8% level, the trade setup remains valid.
The next chart shows the price piercing down the stop loss level placed at 1.91390, as defined by the trade setup rule.
This situation leads us to observe that the entry setup could be improved through the use of an entry filter to reduce the false entry risk.
Tools to Filter Entries
In previous articles, we presented different trade setups that the technical trader can generally find in the real market. An example of potential filters for trade entries are listed as follows.
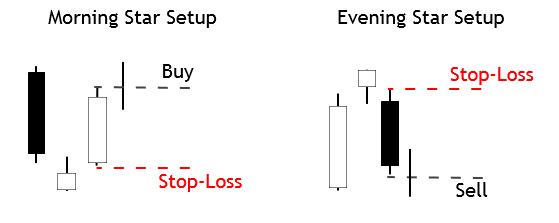
Morning / Evening Star
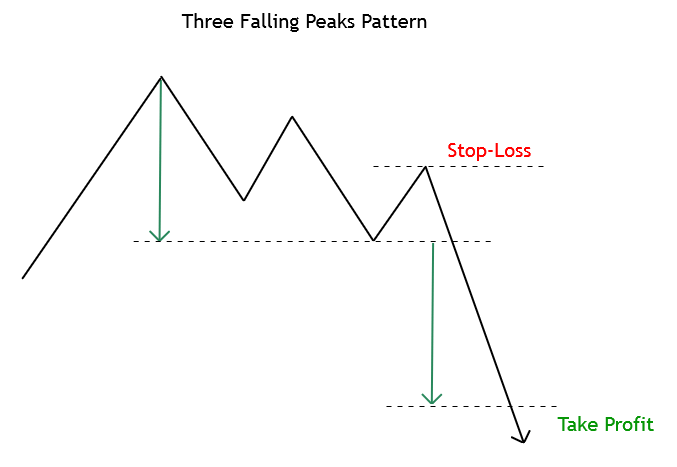
Three Ascending Valleys / Descending Peaks
The technical trader should consider that this list is not exhaustive or mandatory to optimize its trading entry criterion.
Example
The following figure corresponding to the GBPNZD in its hourly chart illustrates a retracement after the cross developed a rally once the upward breakout of a double bottom pattern, is confirmed. According to the 61.8% criterion, the technical trader should place a buy limit at 1.91141.
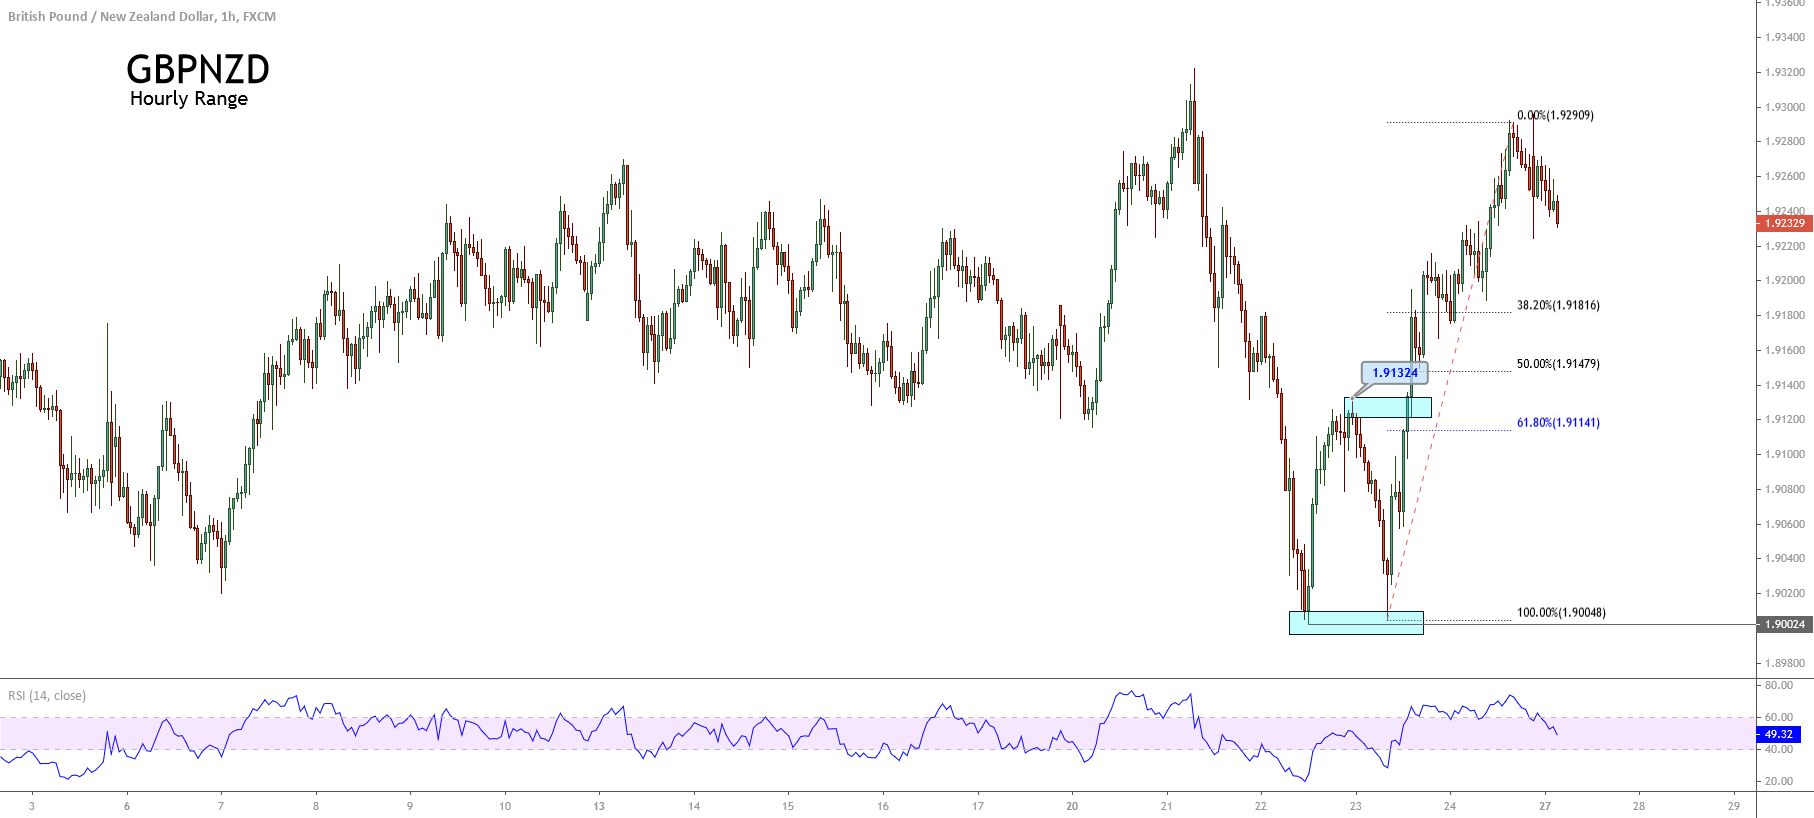
The chart below reveals that the corrective movement didn’t pierce the 61.8%, either the 38.2% zone, which leads us to observe that the technical trader could have missed a trade opportunity if the entry criterion were only the Fibonacci ratio level. However, the incorporation of a filter could aid the entry setup and reduce the risk in the trade.
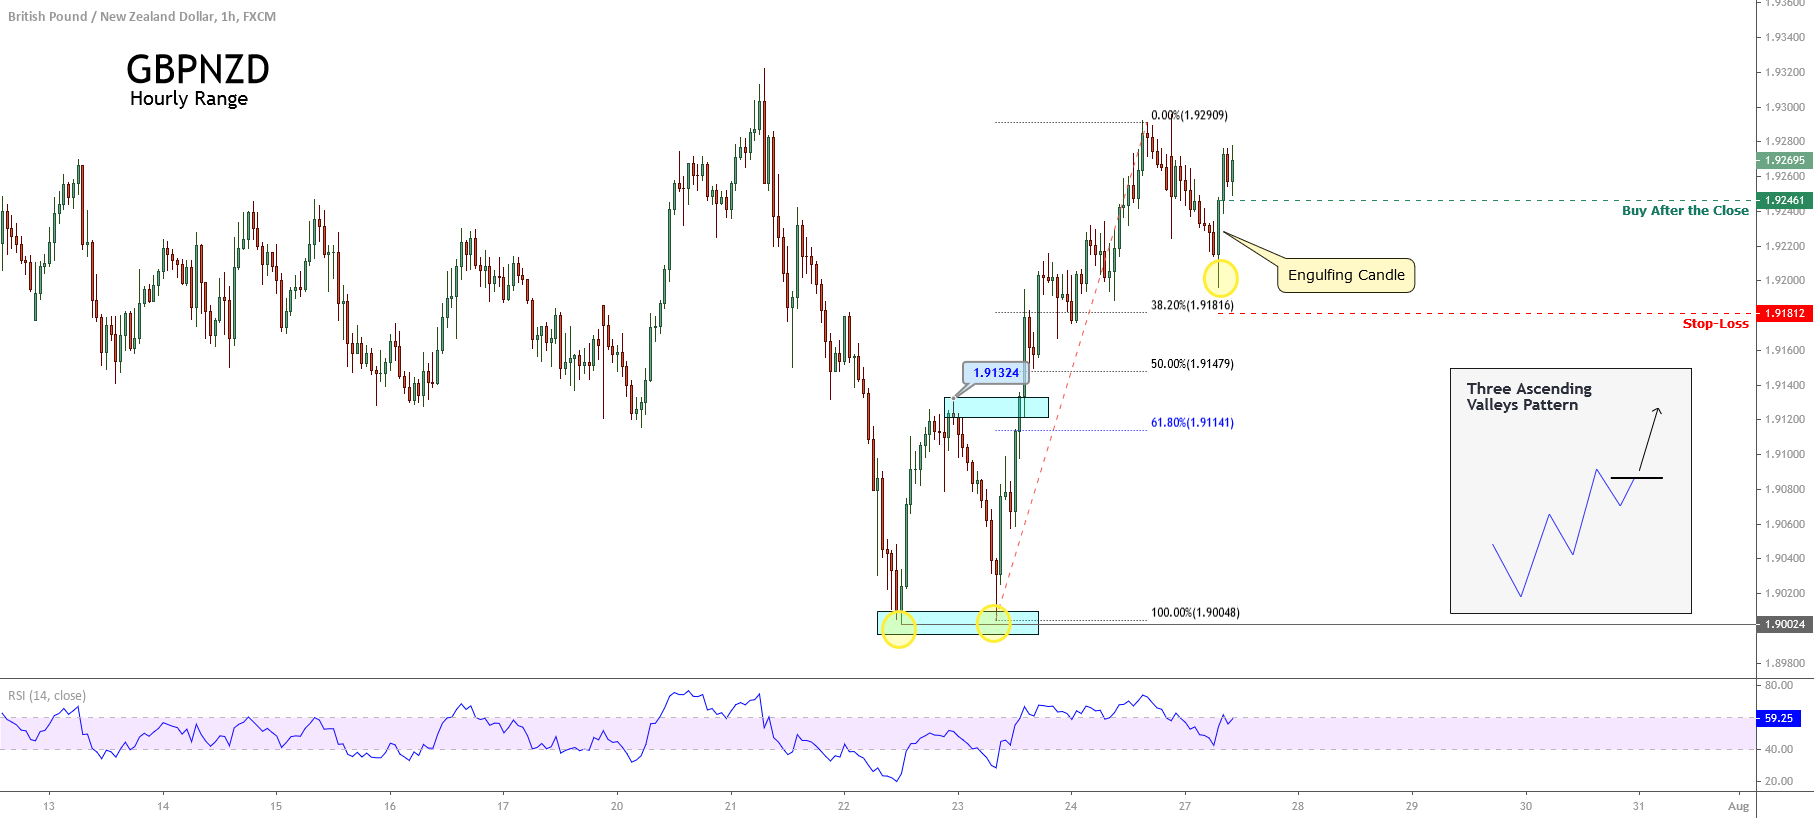
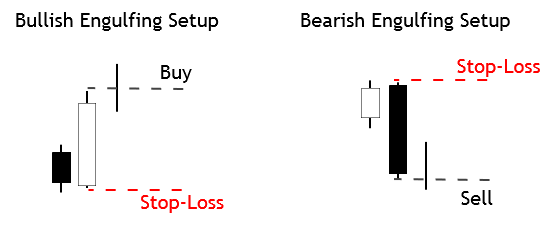
In the chart, we distinguish a three-ascending valley formation marked with circles in yellow and a bullish engulfing pattern. When putting all this together the arguments for a long-side position increase.
Conclusions
In this educational article, we discussed how the incorporation of filters as chart or candle patterns could improve and reduce the risk of a trade setup based on a unique criterion. In this context, the technical trader should practice pattern recognition before applying it in the real market.
Finally, the incorporation of a statistical study of the backtest could increase confidence in the trading strategy developed by the technical trade.
Suggested Readings
- Fischer, R., Fischer J.; Candlesticks, Fibonacci, and Chart Patterns Trading Tools; John Wiley & Sons; 1st Edition (2003).