
Introduction
In the previous section, we learned the steps to create a trading strategy. At this stage of the trading strategy development, we will focus on the strategy’s simulation process using historical data.

What is the Historical Simulation?
The simulation is defined as a mathematical representation that describes a system or process, making it possible to generate forecasts of such a system.
As the years have advanced, computational technologies have evolved to allow many processes simultaneously performed. Compared to what a processor could do 40 years ago, a mere smartphone outruns any of them. In this context, the trading strategies simulation has also done so, moving from the simulation using printed paper charts to the current computer systems we observe today.
By running a historical simulation on a trading strategy, the developer should be able to estimate the gains and losses the strategy would have generated under historic market conditions within a given period.
However, while the benefit of executing a historical simulation enables one to estimate the profits and losses and whether the strategy is profitable or not, this statement should be analyzed by the developer throughout the trading strategy developing process.
Getting Started
Once the developer has completed a trading strategy, including entry and exit rules, as well as the definition of risk management and position sizing, it is necessary to formulate the rules of the strategy using a computer language. This way, the trading simulation software will execute the rules algorithm and apply it to the study’s financial dataset.
Several programming languages are able to carry out the trading strategy simulation, such as MQL4 of MetaTrader, Easy Language of Trade Station, or Python. However, for this educational article, we will continue to use the MetaTrader MQL4 language.
First Steps in the Simulator
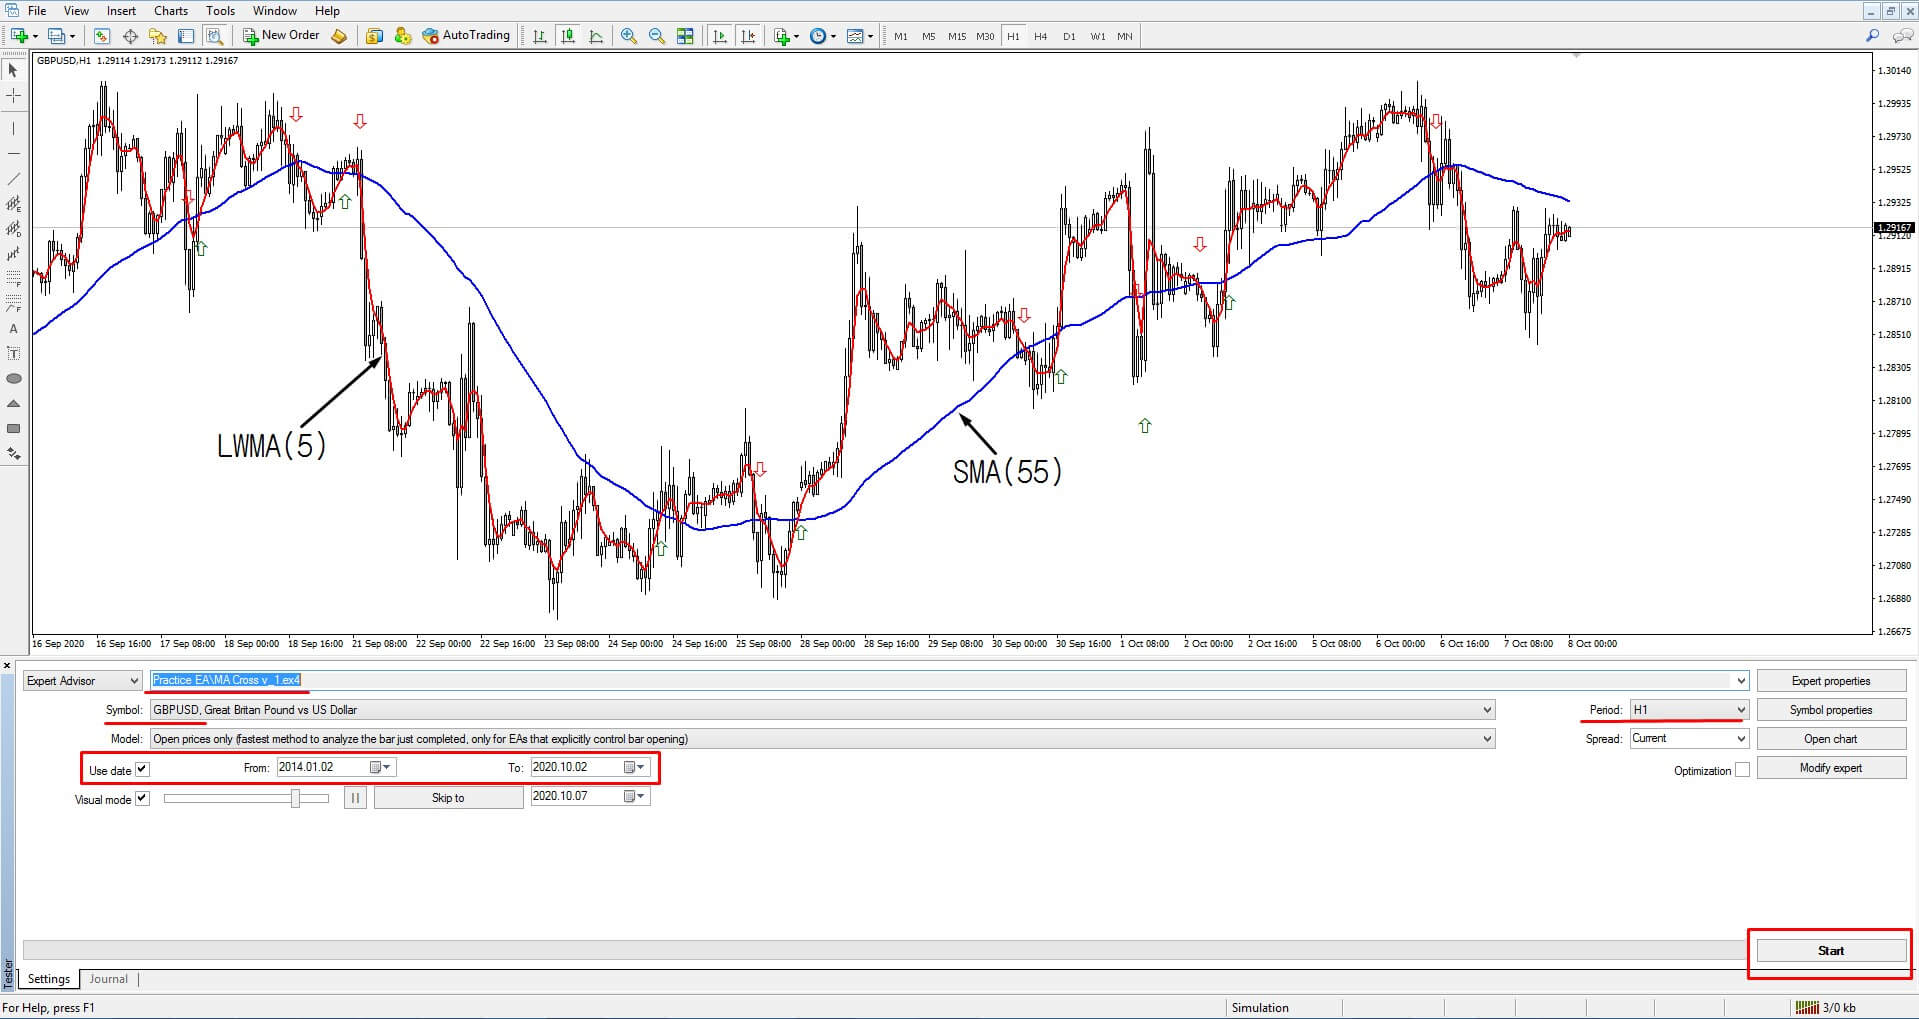
MetaTrader 4 offers its Strategy Tester to simulate trading strategies. In the following figure, we observe the Strategy Tester terminal, in which we can develop a historical simulation of any trading strategy under study.

The figure highlights that Strategy Tester has a user-friendly and intuitive interface for the developer, who can select the Expert Advisor that will contain the trading strategy to simulate. Similarly, the user can choose both the financial market, the timeframe, and the date span in which the simulation should run.
Running the First Simulation in Strategy Tester
In this example, we will continue using a moving-average-crossover-based trading strategy. To recap, this strategy is based on the following rules:
- A buy position will be opened when the 5-hour weighted moving average (LWMA) crosses above the 55-hour simple moving average (SMA).
- A sell position will be activated when the 5-hour LWMA crosses below the 55-hour SMA.
- The buy position will be closed when the LWMA 5-hour has crossed below the SMA 20-hour.
- The sell position will be closed when the LWMA 5-hour has crossed over the SMA 20-hour.
- The position sizing will be a constant 0.1-lot.
- Only one trade at a time is allowed.
The criteria for the execution of the historical simulation are as follows:
- Market to simulate: GBPUSD pair.
- Timeframe: 1 hour.
- Simulation range: from January/02/2014 to October/02/2020.
From the simulation’s execution, we observe the following result provided by the Strategy Tester at the end of the simulation.
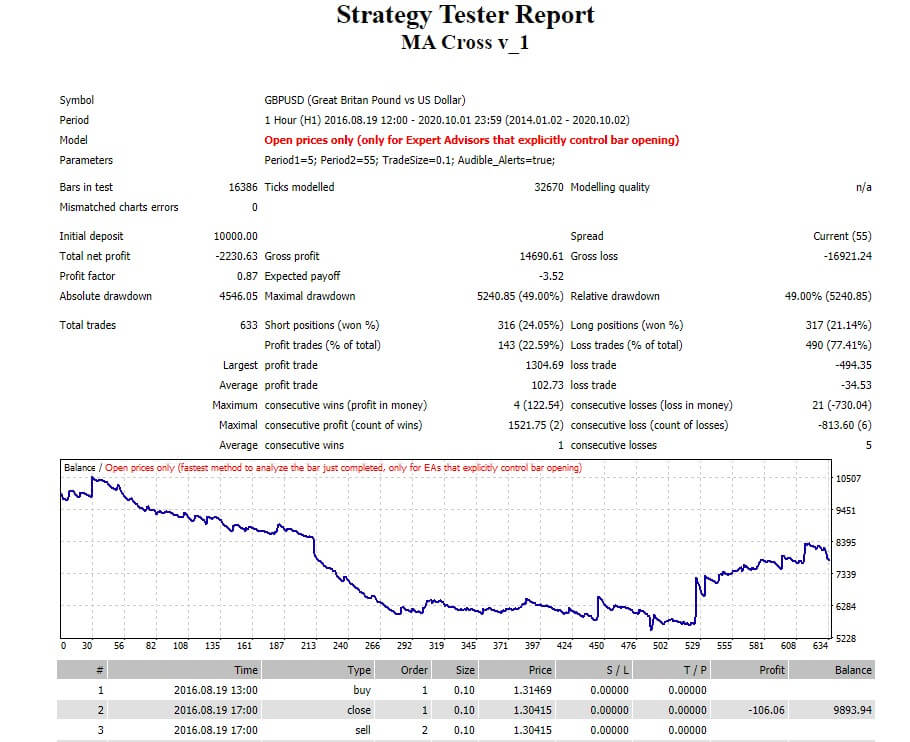
From the above figure, we note that the balance line was reduced by $2,230.63 from the initial balance of $10,000, reaching a final balance of $7,769.37. This result leads us to conclude that the average-crossover strategy is not profitable. However, this is just a preliminary result. It is still possible that we could make this strategy profitable through an optimization process, where we will assess what parameter values perform the best. We could also add stop-loss and take-profit targets that statistically boost the system into profitable territory.
Conclusions
In this educational article, we have seen the first steps to perform a historical simulation. This process provides the developer with an overview of the strategy’s performance in a given financial market under certain conditions. We highlight that the performance conditions could repeat in the future. For this reason, once evaluated the strategy feasibility in terms of profitability, the developer should test the trading strategy during a specific period with paper money in real-time.
On the other hand, the profitable or non-profitable result is just a snapshot of the strategy’s performance. During the optimization process, the developer will investigate the parameters that provide higher profitability or lower risk for the investor.
The next educational article will review the simulator’s information in detail once the historical simulation has been executed.
Suggested Readings
- Jaekle, U., Tomasini, E.; Trading Systems: A New Approach to System Development and Portfolio Optimisation; Harriman House Ltd.; 1st Edition (2009).
- Pardo, R.; The Evaluation and Optimization of Trading Strategies; John Wiley & Sons; 2nd Edition (2008).