Introduction
When the developer performs the trading strategy design, it evaluates through a historical simulation process to overview its results under certain conditions. However, once finished the simulation, the software delivers a series of data that could confuse the developer with a broad kind of information provided by the report.

In this educational article, we will present the main elements of the historical simulation report.
Essential Data of the Historical Simulation Report
Within the wide variety of platforms that allow historical simulations, there is a set of essential data that the software provides at the end of the simulation process. These data are grouped into three large blocks: Performance Summary, Equity Chart, and Trades List.
The following figure shows the example of a report of a historical simulation performed in Strategy Tester of MetaTrader 4.
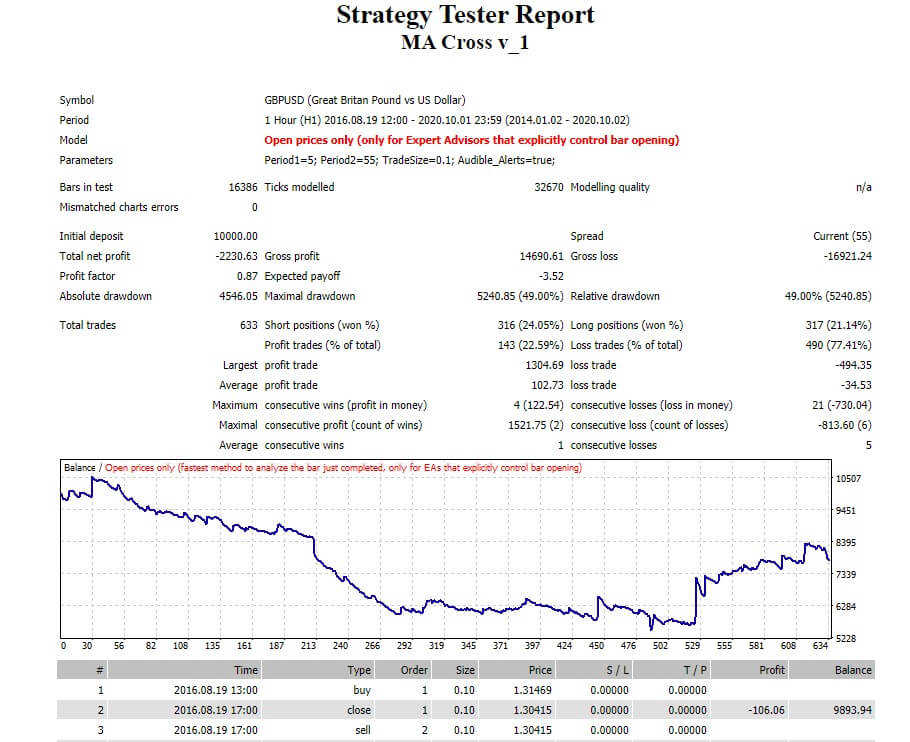
The report presents three blocks, which are detailed as follows.
Performance Data Summary
This section provides summarized statistical data from the historical simulation of the trading strategy. The key performance indicators are as follows:
- Total Net Profit: This is the financial result of all trades executed during the simulation period. This value corresponds to the difference between the “Gross Profit” and the “Gross Loss.” A reading above zero is indicative of a trading strategy with positive mathematical expectation.
- Maximal Drawdown: This is the highest local maximum loss expressed in the deposit currency and percentage of the deposit. In general terms, this value should be as low as possible. The criterion of maximum permissible drawdown will depend on the risk target of the trading strategy developer.
- Total Trades: Corresponds to the total number of trades executed during the historical simulation. The developer might consider this value to assess the level of aggressiveness of the strategy. Also, it can use it to value the strategy in terms of its operational costs. For example, a strategy with a high number of trades could be more aggressive for a conservative investor. In turn, it implies a high operational cost in terms of paying commissions.
- Percentage of Trades Winners: This is the number of profitable trading positions divided by the total number of positions.
- Profit Factor: This is the relationship between Gross Profit and Gross Loss. A reading lower than 1 suggests that the strategy generates more losses than gains. On the contrary, if it is greater than 1, then the strategy provides more profit than losses for each currency unit invested.
- Sharpe Ratio: Some historical simulation platforms of trading strategies provide the Sharpe Ratio. This indicator represents the expected return on a risk-adjusted investment of an asset. In general, investors tend to consider as risk-free return the rate of the United States Treasury bond. A reading of less than 1 suggests that the trading strategy provides more volatile results. In other words, the developer could assume that the trading system is riskier than another with a ratio greater than 1.
Balance Curve
The balance curve chart presents the cumulative result of the trading strategy using a line chart. The information provided in this chart represents the result of the strategy execution under conditions and parameters in which the developer carried out the historical simulation.
Considering the investor’s objectives, the developer could improve its performance by optimizing the initial parameters.
List of Trades
This section of the report shows in detail each trade that the strategy performed during the simulation period. This list usually shows the following data:
- Date of entry.
- Type of order (buy, sell).
- Entry price.
- Size of the position.
- Date of close.
- Closing price.
- Profit or loss of the trade.
- Profits and losses accumulated or Balance.
Conclusions
The historical simulation process provides an overview of trading strategy behavior according to the developer’s parameters initially defined. This information is reflected in the simulation report, which provides a wide variety of information about the strategy’s performance under predetermined conditions.
Within the information provided at the end of the historical simulation, there are key data that the developer should not fail to value these are: Total Net Profit, Maximal Drawdown, Total Trades, Percentage of Trades Winners, Profit Factor, and Sharpe Ratio, which some simulation software does not provide it. However, the lack of availability of this data is not a limitation for assessing the strategy’s performance but will depend greatly on the criteria and experience of the developer of the trading strategy.
The developer can use this information to confirm that the trading strategy is proceeding as specified initially. Also, it can use this data to understand the strategy’s behavior during each trade.
This information is also important to spot potential improvements in the strategy. For instance, you could detect that several large losses may be trimmed with a better stop-loss replacement. You could also find out that a good portion of the trades was closed at a less than optimal level. The developer may conclude that the system would greatly improve with a better take-profit algorithm.
Also, the information gathered from the simulation may help improve the entries. For instance, you could find out that there are large losses at the beginning of the trade most of the time. That could signal the entries flag too quickly, or you may notice that the strategy would benefit from early entries to improve profits.
Finally, according to the developer’s objectives and the information analysis, the developer could attempt to adjust and optimize the needed parameters that could improve the strategy’s performance.
Suggested Readings
- Pardo, R.; The Evaluation and Optimization of Trading Strategies; John Wiley & Sons; 2nd Edition (2008).